
Photo: FX derivative work: Jjtkk · CC BY 2.0 · via Wikimedia Commons, shown in greyscale

Gabon
Gabon places highest on Baseline Water Stress (Aqueduct) (top 3% worldwide) and lowest on Unemployment Rate (bottom 2%).
Share
Gabon in the Nations Inquiry Country Index
At a glance
Population
2,484,789
people
since 1950
Land area
257,670
km²
since 1961
GDP per person
18,986
international $, PPP
since 1990
Life expectancy
68.34
years at birth
since 1950
Human development
0.733
HDI, 0–1
since 1990
Unemployment
20.15
% of the labour force
since 1991
The newest published figure for each, the year it describes and who published it, with a line showing how it has moved.
01The country
About Gabon
Gabon sits astride the Equator, and rainforest covers most of it. The Ogooué drains the greater part of the country, gathering rivers from the interior plateaus and meeting the Atlantic in a maze of channels near Port-Gentil. Grassy savanna breaks the forest at Lopé, and the Crystal Mountains rise in the north-west. At Loango the trees run down to empty beaches where elephants and hippos wander onto the sand, and a network of national parks, created in 2002, shelters lowland gorillas and mandrills.
Forest peoples such as the Baka were joined over many centuries by Bantu-speaking farmers, among them the Fang, Punu and Myene. Portuguese sailors arrived in the 1470s and are said to have named the Komo estuary after the gabão, a hooded cloak. France signed treaties with coastal chiefs from 1839 and in 1849 settled Africans freed from a captured slave ship at Libreville. Albert Schweitzer opened his hospital at Lambaréné in 1913, and Gabon became independent in August 1960.
Bwiti, an initiation religion combining ancestor worship with Christian elements, uses the bitter root of the iboga shrub in all-night ceremonies, and Fang masks hang in museums worldwide. In 1972 scientists found that natural nuclear chain reactions had run in the uranium ore at Oklo some two billion years ago. Offshore oil brings in most export earnings, manganese from Moanda rides the Transgabonais railway to the port of Owendo, and the forests yield okoumé, a soft wood prized for plywood.
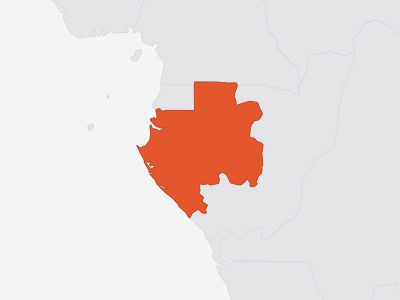
Key facts about Gabon
- Capital
- Libreville
- Official language
- French
- Currency
- Central African CFA franc (XAF)
- ISO code
- GAB · GA
- Domain · dialling
- .ga · +241
As Wikidata records them. Official languages are the least consistent — some countries list only a national language, others every regional one. Sources and licences.
02Country Index 2026
Where it stands, topic by topic
Strongest first. Each position is Gabon’s place among the countries with a standing on that topic, built from a few key statistics chosen to measure different things.
21stof 186
From 2 of 4 key statistics
70thof 177
From 4 of 4 key statistics
80thof 183
From 4 of 4 key statistics
93rdof 165
From 3 of 3 key statistics
114thof 198
From 4 of 4 key statistics
joint110thof 176
From 4 of 4 key statistics
102ndof 159
From 3 of 3 key statistics
124thof 193
From 4 of 4 key statistics
131stof 198
From 4 of 4 key statistics
139thof 200
From 3 of 4 key statistics
joint140thof 196
From 2 of 3 key statistics
139thof 184
From 3 of 4 key statistics
joint160thof 194
From 4 of 4 key statistics
160thof 177
From 3 of 4 key statistics
185thof 198
From 4 of 4 key statistics
177thof 182
From 4 of 4 key statistics
Each standing is built from a few key statistics chosen to measure different things. Select a subject for Gabon’s readings on it, or see every statistic held for Gabon in the table further down this page.
03Highs and lows
Where Gabon stands out
The two ends of its own record: every statistic on which Gabon sits within ten places of the best or worst in the world, plus its strongest and weakest readings overall. Each is turned into a percentile — its place among every country measured — which is what lets a hunger score and a press-freedom rank be compared at all.
Where Gabon does best6
In the top third of all countries measured. 3 are within ten places of the best in the world, in a field of at least 50 countries — marked with that place.
- 1stDeaths in Organized Violencetop 35%
Position · derived 59th of 59 · 1 = worst · 0 · 2025
world median 0
- 8th
Position · derived 8th of 181 · 67,469 · 2022
world median 2,528 (better)
- 9thDrought Risk (Aqueduct)top 6%
Rank 130th of 138 · 1 = worst · 1.471 · 2019
world median 2.623 (better)
Not ranked by the publisher · 0 · 2019
world median 1.663 (better)
- Gender Development Indextop 10%
Position · derived 18th of 184 · 0.994 · 2023
world median 0.971 (better) · ▲ 11 pts since 2013
Where Gabon struggles most6
In the bottom third of all countries measured. 4 are within ten places of the worst in the world, in a field of at least 50 countries — marked with that place.
- 4th
Position · derived 83rd of 86 · 19.25 · 2024
world median 35.86 (worse)
- 5thUnemployment Ratebottom 2%
Position · derived 5th of 182 · 1 = worst · 20.15 · 2025
world median 5.084 (worse) · ▼ 4 pts since 2015
- 8thLabour Income Sharebottom 4%
Position · derived 175th of 182 · 28.87 · 2025
world median 46.23 (worse) · ▲ 3 pts since 2015
- 9thEconomic Complexity Indexbottom 6%
Rank 137th of 145 · -1.797 · 2024
world median 0.131 (worse) · ▼ 28 pts since 2014
- Insecticide-Treated Net Usebottom 3%
Not ranked by the publisher · 10.17 · 2025
world median 45 (worse) · ▼ 21 pts since 2015
Not ranked by the publisher · 0.38 · 2024
world median 0.25 (worse) · ▼ 11 pts since 2014
A band is a place among the countries each publisher scores, so Gabon can move because other countries moved. See the Country Index for the full method.
04Over time
Which way it is moving
The published rank in widely quoted reports, edition by edition — each end with the size of that year’s field.
Human Development Index
UNDP Human Development Report Office
78th
of 141 · 1990
108th
of 193 · 2023
Ranked in 34 of 34 editions
Corruption Perceptions Index
Transparency International
101st
of 173 · 2012
135th
of 181 · 2025
Ranked in 14 of 14 editions
Gender Inequality Index
UNDP Human Development Report Office
64th
of 84 · 1993
135th
of 172 · 2023
Ranked in 31 of 34 editions
Economic Complexity Index
Growth Lab at Harvard University
134th
of 140 · 1995
137th
of 145 · 2024
Ranked in 30 of 30 editions
Government AI Readiness Index
Oxford Insights
110th
of 172 · 2020
133rd
of 195 · 2025
Ranked in 6 of 6 editions
05In context
Gabon and its neighbours
A position reads best beside the countries around it. Every position below is a place in the world ranking of 183, not within the region.
Shares a land border with
Placed either side in the Country Index 2026

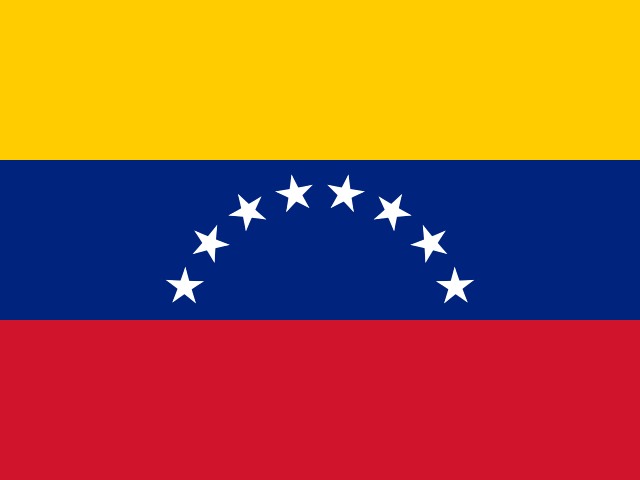


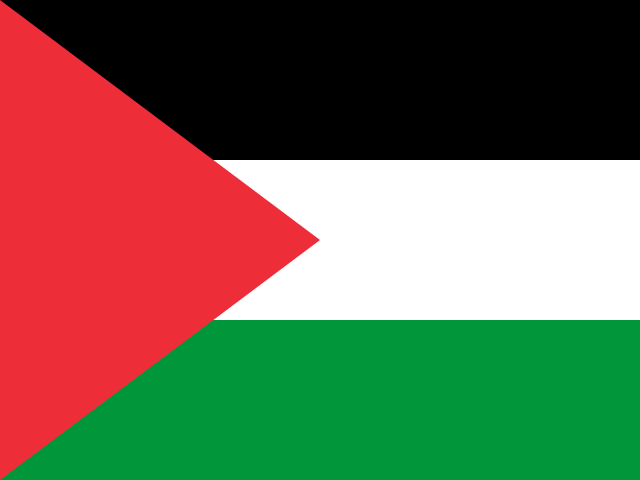

Across Middle Africa
Every country in the sub-region, by its position in the world (of 183 placed).
- 115
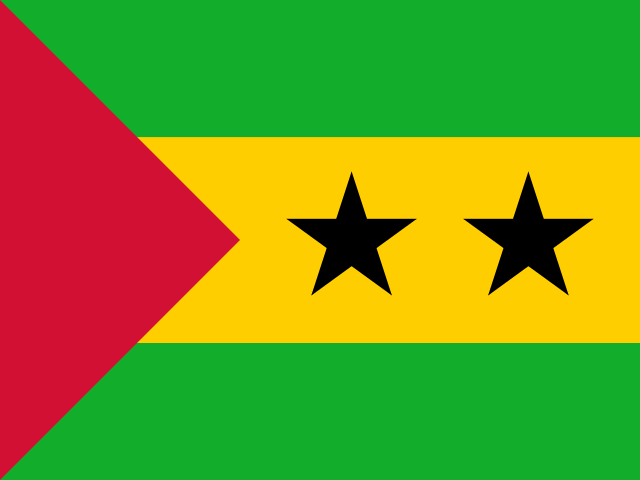 São Tomé and Príncipe
- 135Gabon
- 150
 Cameroon
- 154
 Angola
- =166
 Republic of the Congo
- 169
 Equatorial Guinea
- 172
 DR Congo
- =175
 Central African Republic
- 180
 Chad
06The evidence
Every statistic we hold for Gabon
Grouped by topic. Each row gives the newest edition’s rank or position, the published value and the year the numbers describe. Select a statistic for this country’s row beside every other country, the world median and every edition.
Governance & Institutions38
- Bribery IncidenceWorld Bank Group · Firms asked for a bribe at least once in six dealings with officials (%)36th of 175position · derived · 1 = worst20.552026
- Central Bank Independence IndexAna Carolina Garriga, University of Essex · CBI index (0–1, where 1 is the most statutory independence)top 49%0.6082023
- Child and Family Benefit CoverageILO · Children or households with children receiving child or family cash benefits (%)top 39%372024
- Civic Space RatingsCIVICUS · Civic space score (0–100)92nd of 198position · derived53.842025
- Climate Readiness (ND-GAIN)Notre Dame Global Adaptation Initiative (ND-GAIN), University of Notre Dame · ND-GAIN Readiness (0–1, where 1 is the most ready)145th of 192rank0.3022024
- Completeness of Birth RegistrationUNICEF · Children under 5 whose birth is registered (%)bottom 38%95.62025
- Control of CorruptionWorld Bank Group · Control of Corruption (−2.5 to 2.5)158th of 211position · derived-0.7762025
- Corruption Perceptions IndexTransparency International · CPI score (0–100, where 100 is very clean)135th of 181rank292025
- Equal Protection IndexV-Dem Institute, University of Gothenburg · Equal protection index (0–1); higher = rights and freedoms protected more equally across social groups and classes63rd of 176position · derived0.7342025
- External Debt Stocks (% of GNI)World Bank Group · External debt stocks (% of GNI)72nd of 110position · derived · 1 = worst35.952024
- Firms Expecting to Make Informal Payments to Public OfficialsWorld Bank Group · Firms saying firms like theirs pay officials informally to get things done (%)17th of 178position · derived · 1 = worst28.12026
- Foundational ID OwnershipWorld Bank Group (ID4D) · Adults who own a foundational ID (% of population aged 15+)bottom 11%78.322024
- General Government ConsumptionWorld Bank Group · General government final consumption expenditure (% of GDP)106th of 132position · derived11.162025
- Global Indicators of Regulatory Governance ScoreWorld Bank Group · Regulatory governance score (0–5, where 5 is the most transparent rule-making)bottom 10%0.52018
- Government AI Readiness IndexOxford Insights · AI readiness score (0–100)133rd of 195rank28.412025
- Government EffectivenessWorld Bank Group · Governance estimate (−2.5 weak to 2.5 strong)149th of 209position · derived-0.5512025
- Government Spending on EducationUIS · Government expenditure on education (% of GDP)102nd of 123position · derived2.3162023
- GovTech Maturity IndexWorld Bank Group · GTMI score (0–1)167th of 196position · derived0.2582025
- Judicial Constraints on the Executive IndexV-Dem Institute, University of Gothenburg · Judicial constraints on the executive index (0–1)125th of 175position · derived0.2662025
- Liberal Democracy IndexV-Dem Institute, University of Gothenburg · Liberal democracy index (0–1)113th of 176position · derived0.1782025
- Meritocratic Appointment in the State AdministrationV-Dem Institute, University of Gothenburg · Original latent estimate (≈ −2.9 to +3.6); higher = more appointments on merit124th of 176position · derived-0.3372025
- Neopatrimonial Rule IndexV-Dem Institute, University of Gothenburg · Neopatrimonial rule index (0–1; higher = more personalised rule)48th of 176position · derived · 1 = worst0.7552025
- Old-Age Pension CoverageILO · People above statutory pensionable age receiving an old-age pension (%)bottom 33%38.82025
- Open Data InventoryOpen Data Watch · ODIN overall score (0–100)151st of 168rank362024
- Political Corruption IndexV-Dem Institute, University of Gothenburg · Political corruption index (0–1; higher = more corrupt)52nd of 176position · derived · 1 = worst0.722025
- Public Sector EmploymentWorld Bank Group · Public sector employment (% of total employment)39th of 135position · derived22.632022
- Public Sector Wage BillWorld Bank Group · Public sector wage bill (% of GDP)133rd of 168position · derived4.9682022
- Regulatory QualityWorld Bank Group · Regulatory Quality (−2.5 to 2.5)158th of 209position · derived-0.732025
- Rigorous and Impartial Public AdministrationV-Dem Institute, University of Gothenburg · Original latent estimate (≈ −3.6 to +4.0); higher = a more rigorous and impartial administration33rd of 176position · derived1.6362025
- Rule of LawWorld Bank Group · Rule of Law estimate (−2.5 to 2.5)169th of 211position · derived-1.0232025
- Senior Management Time Spent on Government RegulationWorld Bank Group · Senior management time spent dealing with government regulation (% of a typical week)top 8%14.942026
- State Capacity IndexJonathan K. Hanson (University of Michigan) and Rachel Sigman (Naval Postgraduate School) · Latent estimate of state capacity (≈ −2.3 to +3.0, centred near 0); higher = a more capable state137th of 166position · derived-0.2092015
- State Fiscal Source of RevenueV-Dem Institute, University of Gothenburg · Original latent estimate (≈ −2.9 to +3.1); higher = broader taxation136th of 176position · derived-0.0672025
- Statistical Performance IndicatorsWorld Bank Group · SPI overall score (0–100)170th of 188position · derived45.482024
- V-Dem Electoral Democracy IndexV-Dem Institute, University of Gothenburg · Electoral democracy index (0–1)116th of 176position · derived0.3022025
- Voice and AccountabilityWorld Bank Group · Voice and Accountability estimate (−2.5 to 2.5)145th of 206position · derived-0.8262025
- Women, Business and the LawWorld Bank Group · WBL Index (0–100, where 100 is full legal parity)38th of 190position · derived91.882025
Economy & Innovation50
- Account Ownership at a Financial InstitutionWorld Bank Group · Adults with an account (% of population aged 15+)78th of 139position · derived68.182024
- Actual Individual Consumption per Capita (PPP)World Bank Group · Actual individual consumption per capita (PPP, current international $)119th of 173position · derived6,3392021
- Agriculture, Forestry and Fishing Value Added (% of GDP)World Bank Group · Agriculture, forestry and fishing value added (% of GDP)78th of 158position · derived6.7522025
- Commodity Export DependenceUNCTAD · Commodity exports (% of merchandise exports, three-year average)top 28%87.642024
- Complexity Outlook IndexGrowth Lab at Harvard University · Complexity Outlook Index (standardised; roughly −2.5 to +3)bottom 15%-1.132024
- Comprehensive Wealth per CapitaWorld Bank Group · National comprehensive wealth per person (real chained 2019 US$)77th of 150position · derived45,5842020
- Container Port TrafficUNCTAD · Container port traffic (TEU, twenty-foot equivalent units)92nd of 103position · derived180,8782024
- Crop Production IndexFAO · Crop production index (2014–2016 = 100)98th of 195position · derived106.232022
- Digitally-Deliverable Services ExportsUNCTAD · Digitally-deliverable services exports (% of services exports)71st of 170position · derived30.282024
- Economic Complexity IndexGrowth Lab at Harvard University · ECI score (standardised, roughly −3 to +3)137th of 145rank-1.7972024
- Export Concentration IndexUNCTAD · Export concentration index (0–1, normalised Herfindahl–Hirschman)top 16%0.5482025
- Exports of Goods and Services (% of GDP)World Bank Group · Exports of goods and services (% of GDP)31st of 138position · derived55.492025
- Firms Competing Against Informal FirmsWorld Bank Group · Firms competing against unregistered or informal firms (%)26th of 181position · derived · 1 = worst63.212026
- Firms with a Bank Loan or Line of CreditWorld Bank Group · Firms with a bank loan or line of credit (%)91st of 179position · derived35.732025
- Firms with an International Quality CertificationWorld Bank Group · Firms with an internationally recognised quality certification (%)bottom 47%9.3282026
- Food Production IndexFAO · Food production index (2014–2016 = 100)102nd of 195position · derived105.762022
- Foreign Direct Investment InflowsUNCTAD · FDI inflows (% of GDP)bottom 46%1.7592025
- Frontier Technology Readiness IndexUNCTAD · Frontier Technology Readiness Index (0–1)126th of 170position · derived0.3192023
- GDP GrowthWorld Bank Group · GDP growth (annual %)121st of 186position · derived2.4732025
- GDP per Capita (PPP)World Bank Group · GDP per capita (constant 2021 international $, PPP)88th of 185position · derived18,9862025
- GNI per Capita (PPP)World Bank Group · GNI per capita (constant 2021 international $, PPP)42nd of 102position · derived16,7842025
- Gross Capital Formation (% of GDP)World Bank Group · Gross capital formation (% of GDP)49th of 131position · derived24.832025
- Historical GDP per Capita (Maddison)GGDC · GDP per capita (2011 international $)72nd of 166position · derived15,7212022
- Household ConsumptionWorld Bank Group · Household and NPISH final consumption expenditure (% of GDP)125th of 131position · derived37.922025
- Imports of Goods and Services (% of GDP)World Bank Group · Imports of goods and services (% of GDP)100th of 138position · derived29.42025
- Industry Value Added including Construction (% of GDP)World Bank Group · Industry, including construction, value added (% of GDP)7th of 158position · derived47.192025
- Inflation, GDP DeflatorWorld Bank Group · Annual change in the GDP implicit deflator (%)bottom 3%-3.9612025
- Informal Output (DGE Model Estimate)World Bank Group (Prospects Group) · Informal output, model estimate (% of official GDP)bottom 4%45.982020
- Interest Payments on External DebtWorld Bank Group · Interest payments on external debt (% of GNI)43rd of 112position · derived · 1 = worst1.8462024
- Liner Shipping Connectivity IndexUNCTAD · LSCI (index, average Q1 2023 = 100)109th of 175rank32.312026
- Livestock Production IndexFAO · Livestock production index (2014–2016 = 100)112th of 194position · derived104.132022
- Logistics Performance IndexWorld Bank Group · LPI score (1–5)115th of 139rank2.42023
- Management Practices IndexWorld Bank Group · Management practices index, medium and large firms (0–100)98th of 169position · derived50.552026
- Manufacturing Value Added (% of GDP)World Bank Group · Manufacturing value added (% of GDP)21st of 132position · derived19.072025
- Merchant Fleet by Country of OwnershipUNCTAD · Merchant fleet owned (thousand dead-weight tons)bottom 38%75.792026
- New Business DensityWorld Bank Group · New limited liability companies registered per 1,000 people aged 15–64bottom 37%1.5732024
- Price Level of Household ConsumptionGGDC · Price level of household consumption (US output price level in 2021 = 1)bottom 49%0.5212023
- Productive Capacities IndexUNCTAD · Productive Capacities Index (1–100)152nd of 195position · derived34.782022
- Scholarly ArticlesOurResearch · Articles with at least one author at an institution in the country (full counting)bottom 30%4142025
- Services ExportsUNCTAD · Services exports (% of GDP)bottom 4%0.872025
- Statutory Corporate Income Tax RateOECD · Combined statutory corporate income tax rate, central and sub-central government (%)top 11%302026
- Statutory Minimum WageILO · Statutory minimum wage per month (2021 PPP $)bottom 40%529.252024
- Tariff Rate, Applied, Weighted Mean, All ProductsWorld Bank Group · Applied tariff rate, trade-weighted mean (%)top 5%16.572022
- Tax Revenue (% of GDP)OECD · Total tax revenue, all levels of government (% of GDP)bottom 25%15.122024
- Terms of Trade IndexUNCTAD · Terms of trade index (2015 = 100)top 44%1052025
- Total Factor Productivity LevelGGDC · TFP level at current PPPs (USA = 1)top 19%0.8432023
- Total Natural Resources Rents (% of GDP)World Bank Group · Natural resources rents (% of GDP)25th of 180position · derived18.492021
- Trade (% of GDP)World Bank Group · Exports plus imports (% of GDP)64th of 138position · derived84.892025
- Water-Use EfficiencyFAO · Value added per cubic metre of freshwater withdrawn (constant US$ per m³)top 13%106.042023
- World Energy Trilemma IndexWorld Energy Council · Trilemma score (0–100)64th of 99rank58.82023
Work & Labour27
- Agriculture, Forestry and Fishing Value Added per WorkerWorld Bank Group · Agricultural value added per worker (constant 2015 US$)78th of 151position · derived6,5032025
- Average Weekly Hours WorkedILO · Average weekly hours actually worked per employed person49th of 182position · derived42.292025
- Compliance with Labour RightsILO · Compliance with freedom of association and collective bargaining rights (0 = best, 10 = worst)top 24%0.712024
- Employment in AgricultureILO · Employment in agriculture (% of total employment)61st of 182position · derived28.872025
- Employment in IndustryILO · Employment in industry (% of total employment)92nd of 182position · derived18.852025
- Employment in ServicesILO · Employment in services (% of total employment)114th of 182position · derived52.282025
- Employment Injury Protection CoverageILO · Labour force covered in the event of a work injury (%)bottom 48%452024
- Employment-to-Population RatioILO · Employed share of the population aged 15+ (%)161st of 182position · derived40.772025
- Female Labour Force Participation RateILO · Women aged 15+ in the labour force (%)144th of 182position · derived41.632025
- Female Share of Senior and Middle ManagementILO · Women in senior and middle management (% of managers)83rd of 86position · derived19.252024
- Firms Offering Formal TrainingWorld Bank Group · Firms offering formal training to permanent full-time workers (%)top 47%33.82026
- Firms with a Female Top ManagerWorld Bank Group · Firms with a female top manager (%)89th of 179position · derived19.182025
- GDP per Person EmployedWorld Bank Group · GDP per person employed (constant 2021 international $)52nd of 168position · derived73,0462025
- Human Capital Wealth per CapitaWorld Bank Group · Human capital per person — present value of future earnings (real chained 2019 US$)92nd of 151position · derived15,3452020
- Labour Force Participation RateILO · Population aged 15+ in the labour force (%)157th of 182position · derived51.062025
- Labour Productivity per Hour WorkedILO · Output per hour worked (constant 2021 international $ at PPP)64th of 182position · derived33.012025
- Length of Paid Maternity LeaveWorld Bank Group · Paid maternity leave set in law (calendar days)top 48%982025
- Length of Paid Paternity LeaveWorld Bank Group · Paid paternity leave set in law (calendar days)top 47%32025
- Self-Employment RateILO · Self-employed (% of total employment)90th of 182position · derived32.392025
- Share of Temporary EmployeesILO · Employees on temporary contracts (% of employees)top 15%39.262024
- Unemployment Benefit CoverageILO · Unemployed people receiving unemployment benefits (%)bottom 26%02024
- Unemployment RateILO · Unemployment (% of labour force)5th of 182position · derived · 1 = worst20.152025
- Vulnerable EmploymentILO · Vulnerable employment (% of total employment)90th of 182position · derived · 1 = worst29.812025
- Working Poverty RateILO · Employed people living in extreme poverty (%)top 46%2.8622025
- Youth Not in Education, Employment or TrainingILO · Youth not in education, employment or training (%)31st of 97position · derived · 1 = worst20.212024
- Youth Unemployment RateILO · Unemployment, ages 15-24 (% of youth labour force)13th of 182position · derived · 1 = worst36.282025
Education & Knowledge17
- Academic Freedom IndexV-Dem Institute, University of Gothenburg · Academic freedom index (0–1)112th of 176position · derived0.4282025
- Adult Literacy RateUIS · Adults 15+ who can read and write (%)105th of 172position · derived88.862024
- Expected Years of SchoolingUNDP Human Development Report Office · Expected years of schooling128th of 195position · derived12.482023
- Female Share of ResearchersUIS · Researchers who are women (% of headcount; 50 = parity)bottom 23%28.182024
- Harmonized Test ScoresWorld Bank Group · Harmonized test score (TIMSS-equivalent points; 300 = minimum, 625 = advanced attainment)51st of 172position · derived456.132020
- Intergenerational Persistence in EducationWorld Bank Group · Correlation between own and parents' years of schooling, born 1980–89 (0–1)90th of 153position · derived · 1 = worst0.422017
- Learning PovertyWorld Bank Group and UNESCO Institute for Statistics · 10-year-olds who cannot read and understand a simple text (%)67th of 125position · derived · 1 = worst30.682023
- Learning-Adjusted Years of SchoolWorld Bank Group · Learning-adjusted years of school (0–14)127th of 172position · derived6.0252020
- Lower Secondary Completion RateUIS · Lower secondary completion rate (%)133rd of 164position · derived46.532025
- Mean Years of SchoolingUNDP Human Development Report Office · Mean years of schooling (adults 25+)100th of 193position · derived9.6862023
- Minimum Proficiency in Mathematics, End of PrimaryUIS · Pupils at the end of primary reaching minimum proficiency in mathematics (%)bottom 32%22.92023
- Minimum Proficiency in Reading, End of PrimaryUIS · Pupils at the end of primary reaching minimum proficiency in reading (%)top 39%76.32023
- Primary Completion RateUIS · Primary completion rate (%)136th of 165position · derived74.252025
- Trust in ScientistsWellcome Trust · People aged 15+ who trust scientists in their country 'a lot' (%)bottom 3%10.412020
- Upper Secondary Completion RateUIS · Upper secondary completion rate (%)134th of 164position · derived22.782025
- Wealth Parity Index, Lower Secondary CompletionUIS · Adjusted wealth parity index, lower secondary completion (poorest vs richest fifth; 1 = parity)bottom 48%0.4242024
- Youth Literacy RateUIS · 15–24 year-olds who can read and write (%)bottom 36%93.982024
Health & Wellbeing53
- Adolescent Birth Rate (Ages 15–19)UN DESA Population Division · Live births per 1,000 women aged 15–1924th of 222position · derived · 1 = worst91.712023
- Adult Mortality (Probability of Dying Between 15 and 60)UN DESA Population Division · Deaths before age 60 per 1,000 people alive at 15, at that year's death rates48th of 222position · derived · 1 = worst204.32023
- Adults Who Have Been Too Anxious or Depressed to Carry OnWellcome Trust · People aged 15+ who have ever been too anxious or depressed to continue their usual activities for two weeks or more (%)top 36%24.392020
- Agreement That Vaccines Are SafeWellcome Trust · People aged 15+ who agree that vaccines are safe (% of those who had heard of vaccines)122nd of 144position · derived62.652018
- Antenatal Care Coverage, At Least Four VisitsUNICEF · Women with a live birth who had 4+ antenatal visits (%)89th of 153position · derived77.82025
- Caesarean Section RateUNICEF · Live births delivered by caesarean section (%)bottom 22%8.62025
- Care-Seeking for Children with Symptoms of PneumoniaUNICEF · Children under 5 with pneumonia symptoms taken to a health provider (%)67th of 127position · derived67.12024
- Catastrophic Out-of-Pocket Health SpendingWorld Bank Group · Population in households spending more than 10% of their budget on health out of pocket (%)bottom 30%3.8342019
- Coefficient of Variation of Habitual Caloric ConsumptionFAO · Coefficient of variation of habitual calorie consumption across the population (standard deviation ÷ mean)bottom 4%0.382024
- Contraceptive Prevalence (Any Method)UN DESA Population Division · Share of all women aged 15–49 using any contraceptive method (%)bottom 17%24.92023
- Cost of a Healthy DietFAO · Cost of the cheapest locally available healthy diet, PPP dollars per person per daytop 39%4.782025
- Days Above 35°CECMWF · Days a year with a maximum temperature above 35°C, averaged over the country’s landtop 34%0.032025
- Demand for Family Planning Satisfied by Modern MethodsUN DESA Population Division · Share of women aged 15–49 wanting to avoid pregnancy who use a modern method (%)175th of 196position · derived412023
- Dietary Energy SupplyFAO · Dietary energy supply (kcal per person per day)119th of 155position · derived2,6252024
- Early Initiation of BreastfeedingUNICEF · Newborns put to the breast within one hour of birth (%)22nd of 136position · derived70.332024
- Exclusive Breastfeeding Under Six MonthsUNICEF · Infants under 6 months exclusively breastfed (%)124th of 136position · derived19.362024
- Fish and Seafood Supply per PersonFAO · Fish and seafood available as food (kg per person per year, live-weight equivalent)top 24%27.032023
- Fruit Supply per PersonFAO · Fruit available as food, excluding wine (kg per person per year)top 17%131.32023
- Gender Inequality IndexUNDP Human Development Report Office · GII (0 = full equality, 1 = maximum inequality)135th of 172rank0.5052023
- Global Multidimensional Poverty IndexOPHI · MPI (0–1)56th of 109position · derived · 1 = worst0.0372025
- Human Capital IndexWorld Bank Group · HCI score (0–1)123rd of 172position · derived0.4582020
- Human Development IndexUNDP Human Development Report Office · HDI score (0–1)108th of 193rank0.7332023
- Immunisation Coverage, DTP3WUENIC · Infants given a third dose of DTP vaccine (%)bottom 6%622025
- Immunisation Coverage, Measles First Dose (MCV1)WUENIC · Infants given a first dose of measles vaccine (%)bottom 5%562025
- Infant Mortality RateUN IGME · Deaths before age one (per 1,000 live births)55th of 200position · derived · 1 = worst25.932024
- Insecticide-Treated Net UseMAP · Population that slept under an insecticide-treated net (%)bottom 3%10.172025
- Institutional DeliveriesUNICEF · Live births delivered in a health facility (%)bottom 44%95.12025
- Life Expectancy at Age 65UN DESA Population Division · Further years a 65-year-old would live at current death rates158th of 222position · derived14.52023
- Life Expectancy at BirthUN DESA Population Division · Years a newborn would live at current death rates169th of 222position · derived68.342023
- Low Birthweight PrevalenceUNICEF and WHO (Joint Low Birthweight Estimates) · Live births weighing under 2,500 g (%)35th of 158position · derived · 1 = worst14.652020
- Malaria Incidence (P. falciparum)MAP · New P. falciparum malaria cases per 1,000 people per yearbottom 30%189.122025
- Malaria Mortality (P. falciparum)MAP · Deaths from P. falciparum malaria per 100,000 people per yearbottom 32%32.882024
- Maternal Mortality RatioMMEIG · Maternal deaths per 100,000 live births34th of 195position · derived · 1 = worst232.662023
- Meat Supply per PersonFAO · Meat available as food (kg per person per year, carcass weight)top 45%63.082023
- Minimum Dietary Diversity, Children Aged 6–23 MonthsUNICEF · Children aged 6-23 months fed from at least 5 of 8 food groups (%)75th of 115position · derived26.322025
- Modern Contraceptive PrevalenceUN DESA Population Division · Share of all women aged 15–49 using a modern contraceptive method (%)bottom 17%18.92023
- Mortality Rate, Ages 5–14UN IGME · Deaths between ages 5 and 14 (per 1,000 children aged 5)39th of 200position · derived · 1 = worst8.2432024
- Neonatal Mortality RateUN IGME · Deaths in the first 28 days (per 1,000 live births)56th of 200position · derived · 1 = worst16.342024
- Oral Rehydration Salts for Children with DiarrhoeaUNICEF · Children under 5 with diarrhoea given oral rehydration salts (%)113th of 127position · derived202024
- Overweight Prevalence in Children Under FiveUNICEF, WHO and World Bank Group (Joint Malnutrition Estimates) · Children under 5 who are overweight (%)76th of 163position · derived · 1 = worst6.0692024
- Pesticide Use per HectareFAO · Pesticide use (kg per hectare of cropland)98th of 178position · derived1.512024
- PM2.5 Air Pollution ExposureAtmospheric Composition Analysis Group, Washington University in St. Louis · Population-weighted PM2.5 concentration (µg/m³)66th of 220position · derived · 1 = worst21.92023
- Postnatal Care for Newborns Within Two DaysUNICEF · Newborns with a health check within 2 days of birth (%)62nd of 109position · derived78.42025
- Prevalence of UndernourishmentFAO · Population undernourished (%)14th of 104position · derived · 1 = worst25.32023
- Severe Child Food Poverty, Children Aged 6–23 MonthsUNICEF · Children aged 6-23 months fed from at most 2 of 8 food groups (%)40th of 113position · derived · 1 = worst27.252024
- Share of Population Unable to Afford a Healthy DietFAO · Share of the population unable to afford a healthy diet (%)56th of 145position · derived · 1 = worst39.32025
- Stillbirth RateUN IGME · Stillbirths (per 1,000 total births)56th of 200position · derived · 1 = worst12.942023
- Stunting Prevalence in Children Under FiveUNICEF, WHO and World Bank Group (Joint Malnutrition Estimates) · Children under 5 who are stunted (%)78th of 162position · derived · 1 = worst14.362024
- Under-Five Mortality RateUN IGME · Deaths before age five (per 1,000 live births)56th of 200position · derived · 1 = worst32.632024
- Vegetable Supply per PersonFAO · Vegetables available as food (kg per person per year)bottom 28%55.482023
- Violent Discipline of ChildrenUNICEF · Children aged 1-14 experiencing violent discipline (%)33rd of 90position · derived · 1 = worst812025
- Wasting Prevalence in Children Under FiveUNICEF, WHO and World Bank Group (Joint Malnutrition Estimates) · Children under 5 who are wasted (%)89th of 163position · derived · 1 = worst3.4222024
Development & Human Capital12
- Access to ElectricityWorld Bank Group · Population with electricity access (%)bottom 29%95.12024
- Access to Electricity, RuralWorld Bank Group · Rural population with electricity access (%)bottom 17%51.32024
- Cereal YieldFAO · Cereal yield (kg per hectare)141st of 179position · derived1,5882023
- Child MarriageUNICEF · Women 20–24 married before 18 (%)90th of 143position · derived · 1 = worst13.32025
- Coefficient of Human InequalityUNDP Human Development Report Office · Coefficient of Human Inequality (%)59th of 169position · derived · 1 = worst23.72023
- Gender Development IndexUNDP Human Development Report Office · Gender Development Index (1.000 = parity)18th of 184position · derived0.9942023
- Inequality-adjusted Human Development IndexUNDP Human Development Report Office · IHDI (0–1)101st of 169position · derived0.5582023
- Multidimensional Poverty MeasureWorld Bank Group · Multidimensional poverty headcount ratio (%)62nd of 157position · derived · 1 = worst9.322025
- Net Official Development Assistance ReceivedOECD Development Assistance Committee · Net ODA received (% of GNI)108th of 130position · derived0.2982023
- Planetary pressures-adjusted HDIUNDP Human Development Report Office · PHDI (0–1)61st of 156position · derived0.7042023
- Poverty Headcount at $3.00 a Day, Line-up EstimatesWorld Bank Group · Population below $3.00 a day, 2021 PPP, World Bank line-up estimate (%)bottom 39%4.922024
Environment & Sustainability39
- Agricultural EmissionsFAO · Farm-gate emissions (kt CO₂eq)147th of 193position · derived1,1332023
- Agricultural Emissions IntensityFAO · Greenhouse gases from farming per value of agricultural output (kg CO₂eq per international dollar)145th of 190position · derived · 1 = worst0.912023
- Agricultural LandFAO · Agricultural land (% of land area)185th of 209position · derived8.3572023
- Annual Forest Area Change RateFAO · Compound annual change in forest area over the interval ending that year (%)bottom 39%-0.032025
- Arable Land per PersonFAO · Arable land (hectares per person)91st of 206position · derived0.1312023
- Baseline Water Stress (Aqueduct)WRI · Baseline water stress score (0–5)top 3%02019
- Burned AreaGWIS · Burned area (hectares)top 23%443,3992025
- Carbon Intensity of ElectricityEmber · Carbon intensity (gCO₂e per kWh generated)67th of 165position · derived · 1 = worst525.382024
- Children's Climate Risk IndexUNICEF · Children's Climate Risk Index (0–10, higher is more risk)77th of 163rank · 1 = worst5.12020
- Climate Vulnerability (ND-GAIN)Notre Dame Global Adaptation Initiative (ND-GAIN), University of Notre Dame · ND-GAIN Vulnerability (0–1, where 1 is the most vulnerable)95th of 190rank0.452024
- CO₂ Emissions per CapitaGlobal Carbon Project · Fossil CO₂ (tonnes per person)128th of 210position · derived · 1 = worst2.1262024
- Coal Share of Electricity GenerationEmber · Coal (% of electricity generated)top 32%02024
- Cropland Nitrogen BalanceFAO · Nitrogen surplus (+) or deficit (−) on cropland, kg per hectarebottom 21%10.992023
- Energy Intensity of GDP (PPP)EIA · Energy use per dollar of GDP (thousand Btu per US$ at PPP)top 18%1.6562024
- Environmentally Related Tax RevenueOECD · Environmentally related tax revenue (% of GDP)bottom 41%0.852024
- Fertilizer Consumption per HectareFAO · Fertilizer consumption (kg per hectare of arable land)120th of 188position · derived50.272023
- Fisheries and Aquaculture ProductionFAO · Fish, crustaceans, molluscs and other aquatic animals caught or farmed, tonnes (live weight)bottom 42%30,2432024
- Forest AreaFAO · Forest area (% of land area)3rd of 210position · derived91.182023
- Forest Area within Legally Established Protected AreasFAO · Forest within legally established protected areas, as a share of the country's 2015 forest area (%)top 46%19.662025
- Land Under Cereal ProductionFAO · Land under cereal production (hectares)145th of 179position · derived30,1212023
- Livestock DensityFAO · Livestock units per hectare of agricultural land181st of 188position · derived0.062023
- Low-Carbon Share of Electricity GenerationEmber · Low-carbon sources (% of electricity generated)86th of 162position · derived35.382024
- Mangrove AreaGlobal Mangrove Watch (Aberystwyth University, JAXA, soloEO, Wetlands International, The Nature Conservancy) · Mangrove forest area (hectares)top 18%189,2412025
- Methane EmissionsEDGAR · Methane emissions (gigagrams of CH₄)top 42%462.232025
- Municipal Solid Waste GenerationWorld Bank Group · Municipal solid waste generated (kg per person per day)163rd of 201position · derived · 1 = worst0.4972026
- ND-GAIN Country IndexNotre Dame Global Adaptation Initiative (ND-GAIN), University of Notre Dame · ND-GAIN Index (0–100, where 100 is best placed to adapt)126th of 190rank42.622024
- Population Living Below 5 m ElevationCenter for International Earth Science Information Network (CIESIN), Columbia University · Population living below 5 m elevation (% of total population)top 21%9.5272015
- Progress Toward Productive and Sustainable Agriculture (SDG 2.4.1 Proxy)FAO · Current status score, from 1 (worst) to 5 (best), averaged over up to seven sub-indicators90th of 186position · derived3.172024
- Renewable Internal Freshwater Resources per CapitaFAO · Renewable internal freshwater (cubic metres per person)8th of 181position · derived67,4692022
- Renewable Share of Electricity GenerationEmber · Renewables (% of electricity generated)76th of 162position · derived35.382024
- Solar Electricity Installed CapacityEIA · Solar generating capacity installed (gigawatts)bottom 24%0.0122024
- Solar Share of Electricity GenerationEmber · Solar (% of electricity generated)bottom 5%02024
- Temperature Change on LandFAO · Change in mean land-surface temperature against the country's own 1951–1980 average, °Cbottom 21%1.0912025
- Tree Cover LossWorld Resources Institute — Global Forest Watch (data: University of Maryland) · Tree cover loss (hectares, where canopy cover exceeded 30% in 2000)top 33%21,9202025
- Tropical Moist Forest DeforestationJRC · Tropical moist forest deforested in the year (million hectares)top 20%0.0132025
- Water StressFAO · Freshwater withdrawal as a share of available resources (%)164th of 177position · derived · 1 = worst0.52023
- Water Withdrawal by SectorFAO · Freshwater withdrawn for agriculture (% of total)124th of 171position · derived28.972022
- Wind and Solar Share of Electricity GenerationEmber · Wind and solar (% of electricity generated)bottom 5%02024
- World Risk IndexInstitute for International Law of Peace and Armed Conflict (IFHV), Ruhr University Bochum · WorldRiskIndex score (0–100, where 100 is the most at risk)75th of 193position · derived · 1 = worst6.182025
Gender & Equality8
- Account Ownership Among WomenWorld Bank Group · Women with an account (% of women aged 15+)80th of 139position · derived63.722024
- Female-Headed HouseholdsUN DESA Population Division · Households headed by a woman (% of households)bottom 47%31.892026
- Firms with Female Participation in OwnershipWorld Bank Group · Firms with at least one woman among the owners (%)83rd of 181position · derived36.692026
- Mean Age at First Marriage, WomenUN DESA Population Division · Singulate mean age at marriage, women (years)top 47%25.12019
- Sex Ratio at BirthUN DESA Population Division · Male births per 100 female birthsbottom 2%102.12023
- Social Institutions and Gender IndexOECD · SIGI score (0 = no discrimination, 100 = absolute)58th of 140position · derived · 1 = worst28.32023
- Women Who Think a Husband Is Justified in Hitting or Beating His WifeUNICEF · Women aged 15-49 who say a husband is justified in hitting or beating his wife (%)53rd of 125position · derived · 1 = worst29.32025
- Women's Political Empowerment IndexV-Dem Institute, University of Gothenburg · Women's political empowerment index (0–1)80th of 176position · derived0.7982025
Democracy & Civil Liberties17
- Deliberative Democracy IndexV-Dem Institute, University of Gothenburg · Deliberative democracy index (0–1)114th of 176position · derived0.2272025
- Egalitarian Democracy IndexV-Dem Institute, University of Gothenburg · Egalitarian democracy index (0–1)104th of 176position · derived0.2462025
- Exclusion by Socio-Economic GroupV-Dem Institute, University of Gothenburg · Exclusion by socio-economic group index (0–1; higher = more exclusion)48th of 174position · derived · 1 = worst0.5932023
- Freedom of Expression and Alternative Sources of Information IndexV-Dem Institute, University of Gothenburg · Freedom of expression index (0–1)79th of 176position · derived0.7482025
- Freedom of Foreign MovementV-Dem Institute, University of Gothenburg · Original latent estimate (≈ −3.6 to +2.9); higher = freer movement52nd of 176position · derived1.8842025
- Freedom of Peaceful AssemblyV-Dem Institute, University of Gothenburg · Original latent estimate (≈ −3.5 to +3.5); higher = more freedom70th of 172position · derived1.0962025
- Freedom of ReligionV-Dem Institute, University of Gothenburg · Original latent estimate (≈ −3.5 to +3); higher = more religious freedom91st of 176position · derived1.2842025
- Government Censorship of the MediaV-Dem Institute, University of Gothenburg · Original latent estimate (≈ −3 to +3.5); higher = less censorship105th of 176position · derived0.072025
- Government Dissemination of False Information (Domestic)V-Dem Institute, University of Gothenburg · Original latent estimate (≈ −3.6 to +3.2); higher = less disinformation82nd of 176position · derived0.0082025
- Government Internet ShutdownsV-Dem Institute, University of Gothenburg · Original latent estimate (≈ −4 to +2); higher = fewer shutdowns113th of 176position · derived0.2252025
- Mass MobilizationV-Dem Institute, University of Gothenburg · Original latent estimate (≈ −3.6 to +4); higher = more and larger eventsbottom 16%-1.3412025
- Military Dimension IndexV-Dem Institute, University of Gothenburg · Military dimension index (0–1; higher = larger military role)bottom 7%0.52025
- Participatory Democracy IndexV-Dem Institute, University of Gothenburg · Participatory democracy index (0–1)104th of 176position · derived0.242025
- Perceptions of Electoral Integrity IndexEIP · Electoral Integrity Index (0–100; higher = greater electoral integrity)bottom 31%43.392025
- Physical Violence IndexV-Dem Institute, University of Gothenburg · Freedom from political killings and torture (0–1)90th of 176position · derived0.7872025
- Political PolarizationV-Dem Institute, University of Gothenburg · Original latent estimate (≈ −3.8 to +3.9); higher = more polarized110th of 172position · derived · 1 = worst-0.3472025
Peace & Security12
- Armed Forces Personnel (% of population)U.S. Department of State · Active-duty armed forces personnel (% of population)bottom 47%0.312019
- Arms Imports (% of total imports)U.S. Department of State · Arms imports (% of all imports of goods and services)top 33%0.52019
- Civilian Deaths in Organized ViolenceUCDP · Civilians killed in organized violence (people)top 37%02025
- Deaths in Non-State ConflictUCDP · Deaths in non-state conflict (people)top 43%02025
- Deaths in Organized ViolenceUCDP · Deaths in organized violence (people)59th of 59position · derived · 1 = worst02025
- Deaths in State-Based Armed ConflictUCDP · Deaths in state-based armed conflict (people)top 39%02025
- Global Militarisation IndexBICC · GMI score (higher means a heavier military weight)62nd of 149rank · 1 = worst113.72023
- Government Cyber Security CapacityV-Dem Institute, University of Gothenburg · Original latent estimate (≈ −3.6 to +3.7); higher = more capacity78th of 176position · derived0.3832025
- INFORM Risk IndexEuropean Commission Joint Research Centre, with the Inter-Agency Standing Committee · INFORM Risk score (0–10, where 10 is the highest risk)94th of 191position · derived · 1 = worst3.72025
- Political Stability and Absence of ViolenceWorld Bank Group · Political Stability estimate (−2.5 to 2.5)111th of 211position · derived0.1172025
- Political Violence by Non-State ActorsV-Dem Institute, University of Gothenburg · Original latent estimate (≈ −3.5 to +4); higher = more violence142nd of 171position · derived · 1 = worst-2.012025
- Refugees by Country of OriginUNHCR, the UN Refugee Agency · Refugees under UNHCR's mandate from this country, end of year (people)bottom 49%9842025
Risk & Resilience9
- Able to Raise Emergency Funds Within 30 DaysWorld Bank Group · Adults who could raise emergency funds within 30 days without great difficulty (% of population aged 15+)77th of 98position · derived42.582024
- Adults Who Experienced a Natural Disaster or Severe WeatherWorld Bank Group · Adults who experienced a natural disaster or severe weather in the past three years (% of population aged 15+)30th of 98position · derived · 1 = worst26.32024
- Asylum-Seekers by Country of AsylumUNHCR, the UN Refugee Agency · Asylum-seekers awaiting a decision, end of year (people)bottom 22%862025
- Drought Risk (Aqueduct)WRI · Drought risk score (0–5)130th of 138rank · 1 = worst1.4712019
- Firms Whose Assets Were Damaged by Extreme WeatherWorld Bank Group · Firms whose physical assets were damaged by extreme weather (%)65th of 163position · derived · 1 = worst11.332026
- Per Capita Food Supply VariabilityFAO · Year-to-year variability of the food supply (kcal per person per day)top 16%172024
- Refugee Population by Country of AsylumUNHCR, the UN Refugee Agency · Refugees under UNHCR's mandate hosted, end of year (people)bottom 20%1662025
- Riverine Flood Risk (Aqueduct)WRI · Riverine flood risk score (0–5)62nd of 163rank · 1 = worst3.0382019
- World Risk Poll Resilience IndexLloyd's Register Foundation · Resilience Index, 0–100 (higher = more reported capacity to cope with a shock; the mean of individual, household, community and societal sub-indices)bottom 30%482023
Mobility & Trade8
- Average Time to Clear Exports Through CustomsWorld Bank Group · Average time to clear exports through customs (days)63rd of 174position · derived · 1 = worst6.2392025
- Cereal Import Dependency RatioFAO · Share of the cereal supply that is imported (%)top 19%90.62022
- Container Import Dwell TimeWorld Bank Group · Median days a full import container waits in port16th of 156position · derived · 1 = worst9.42024
- Digital Services Trade Restrictiveness IndexOECD · Digital STRI (0 = open, 1 = closed)46th of 125position · derived · 1 = worst0.2642025
- EmigrantsUN DESA Population Division · Migrants from the country living abroad, mid-year (people)bottom 28%61,1602024
- International MigrantsUN DESA Population Division · International migrants living in the country, mid-year (people)top 39%449,7462024
- Net Migration RateUN DESA Population Division · Net migrants per 1,000 populationtop 38%0.3972023
Poverty & Inequality1
- Poverty Headcount at National Poverty LinesWorld Bank Group · Population below the national poverty line (%)top 29%33.42025
Money & Public Finance5
- Firms Using Banks to Finance InvestmentWorld Bank Group · Firms using banks to finance investment in fixed assets (%)bottom 41%23.932026
- Made or Received a Digital PaymentWorld Bank Group · Adults who made or received a digital payment in the past year (% of population aged 15+)27th of 98position · derived66.522024
- Saved at a Financial Institution or with Mobile MoneyWorld Bank Group · Adults who saved at a financial institution or with mobile money in the past year (% of population aged 15+)17th of 98position · derived39.062024
- Share of Firms' Payments Made ElectronicallyWorld Bank Group · Payments made electronically in a typical month, excluding payroll and payments to government (%)bottom 38%51.372026
- Short-Term Share of External DebtWorld Bank Group · Short-term debt (% of total external debt)top 22%2.2312024
Energy11
- Crude Oil ProductionEIA · Crude oil produced (thousand barrels per day)top 16%239.322025
- Firms Identifying Electricity as a Major ConstraintWorld Bank Group · Firms rating electricity a major or very severe constraint (%)71st of 179position · derived · 1 = worst32.152026
- Firms Owning or Sharing a GeneratorWorld Bank Group · Firms owning or sharing a generator (%)bottom 7%66.32026
- Gas Share of Electricity GenerationEmber · Natural gas (% of electricity generated)top 22%44.232024
- Hydro Share of Electricity GenerationEmber · Hydropower (% of electricity generated)top 29%352024
- Natural Gas ProductionEIA · Dry natural gas produced (billion cubic metres)top 33%0.4772024
- Net Electricity Imports (share of generation)Ember · Net electricity imports (% of domestic generation)top 13%22.312024
- Nuclear Share of Electricity GenerationEmber · Nuclear (% of electricity generated)bottom 45%02024
- Photovoltaic Power Potential (PVOUT)World Bank Group (ESMAP), data by Solargis · Practical solar power potential (kWh per kWp per day, long-term average)bottom 18%3.6022020
- Primary Energy Consumption per CapitaEIA · Energy use per person (million Btu)bottom 34%23.082024
- Primary Energy ProductionEIA · Primary energy produced (quadrillion Btu)top 32%0.4842024
Digital & Technology9
- Firms Experiencing Internet DisruptionsWorld Bank Group · Firms that experienced internet outages or slow-downs (%)16th of 163position · derived · 1 = worst65.112026
- Firms with Their Own WebsiteWorld Bank Group · Firms with their own website (%)91st of 181position · derived62.392026
- GitHub DevelopersGitHub · Developer accounts located in the economy (as of quarter end)bottom 31%16,2232026
- GitHub Git PushesGitHub · Git pushes during the quarterbottom 19%16,2722025
- GitHub RepositoriesGitHub · Public repositories located in the economy (as of quarter end)bottom 30%23,2062026
- Internet Use Among AdultsWorld Bank Group · Adults who used the internet in the past three months (% of population aged 15+)99th of 140position · derived68.722024
- Mobile Phone OwnershipWorld Bank Group · Adults who own a mobile phone (% of population aged 15+)93rd of 140position · derived87.222024
- Smartphone OwnershipWorld Bank Group · Adults whose main mobile phone is a smartphone (% of population aged 15+)104th of 140position · derived59.892024
People & Population16
- Average Household SizeUN DESA Population Division · Average number of usual residents per household (people)top 43%3.922026
- Crude Birth RateUN DESA Population Division · Births per 1,000 populationtop 19%27.672023
- Crude Death RateUN DESA Population Division · Deaths per 1,000 populationbottom 30%6.2692023
- Historical Index of Ethnic FractionalizationLenka Dražanová, European University Institute (Migration Policy Centre) · Ethnic fractionalization index (0–1): the probability that two randomly drawn people belong to different ethnic groupstop 10%0.7892013
- Mean Age at ChildbearingUN DESA Population Division · Mean age of mothers at the birth of their children (years)bottom 31%28.522023
- Median Age of the PopulationUN DESA Population Division · Median age (years)bottom 24%21.52023
- One-Person HouseholdsUN DESA Population Division · Households with exactly one member (% of households)top 34%22.52026
- Population Aged 65 and OverUN DESA Population Division · Share of the total population aged 65 and over (%)bottom 24%4.0422023
- Population DensityUN DESA Population Division · People per square kilometre of landbottom 7%9.6432023
- Population Growth RateUN DESA Population Division · Population growth (% per year)top 19%2.1792023
- Population Living in Cities (Degree of Urbanisation)UN DESA Population Division · Share of the population living in cities as the Degree of Urbanisation defines them (%)top 15%61.22025
- Population Under Age 15UN DESA Population Division · Share of the total population aged 0–14 (%)top 22%36.662023
- Sex Ratio of the Total PopulationUN DESA Population Division · Males per 100 femalestop 16%103.252023
- Total Dependency RatioUN DESA Population Division · People aged 0–14 and 65+ per 100 people aged 15–64top 23%68.652023
- Total Fertility RateUN DESA Population Division · Live births per womantop 18%3.6472023
07Method
Sources and how to read them
How to read this page
- The scores and ranks belong to their publishers. Nothing is adjusted, rescaled or re-ranked; each is reproduced from the edition named beside it. Where a row says position · derived, the publisher ranks nobody on that measure and the position is ours, made by ordering the published score.
- Each statistic shows its newest edition, which is not always the edition the Country Index uses: the index pins every source to one data year so its average compares like with like.
How a standing is built from percentiles, why Gabon can move because other countries moved, and why publishers measure between 120 and 215 countries each are set out in full in how a standing is made and what a standing cannot tell you.
Sources
- Statistics: 58 publishers, each named beside its numbers, with every edition and licence on the datasets pages.
- Capital, languages, currency, codes: Wikidata, public domain (CC0).
- Map and land borders: Natural Earth, public domain. Borders are de facto — where administration actually changes — not claimed.
Photographs
The photograph of Gabon on this page comes from Wikimedia Commons and is shown in greyscale. The photographer and the licence are named beside each one.
Cite this page
Nations Inquiry (2026). Gabon: country statistics, rankings and trends. https://nationsinquiry.com/countries/gabon