Loading…
Notre Dame Global Adaptation Initiative (ND-GAIN), University of Notre Dame · Climate Readiness (ND-GAIN)
Climate adaptation readiness by country
How able is a country to turn investment into adaptation to climate change?
Singapore placed first of the 192 countries compared in 2024, at 0.74947, and Central African Republic last, at 0.13683. In the middle country the figure was 0.38733. Among the 192 countries measured in every edition since 1995, the middle one moved from 0.38528 to 0.38733.
Climate adaptation readiness · 2024
Context statistic

Highest of 192Singapore
0.74947012024 · Notre Dame Global Adaptation Initiative (ND-GAIN), University of Notre Dame’s rank
Who leads
The three countries at the highest end of 192 compared, the three at the other end, and the first on each continent.
 1
1Photo: Khairul Nizam . · CC BY 2.0, greyscale
 2
2Photo: Joonas Lyytinen · CC BY-SA 2.5, greyscale
 3
3Photo: Unknown author · CC BY-SA 2.0, greyscale
Lowest in 2024
- 192
 Central African Republic0.13683
 - 191
 Equatorial Guinea0.16092
 - 190
 Chad0.16614
Ranks out of 192. Where a country sits says how it compares with the others measured, and nothing about why.
02Every measured country
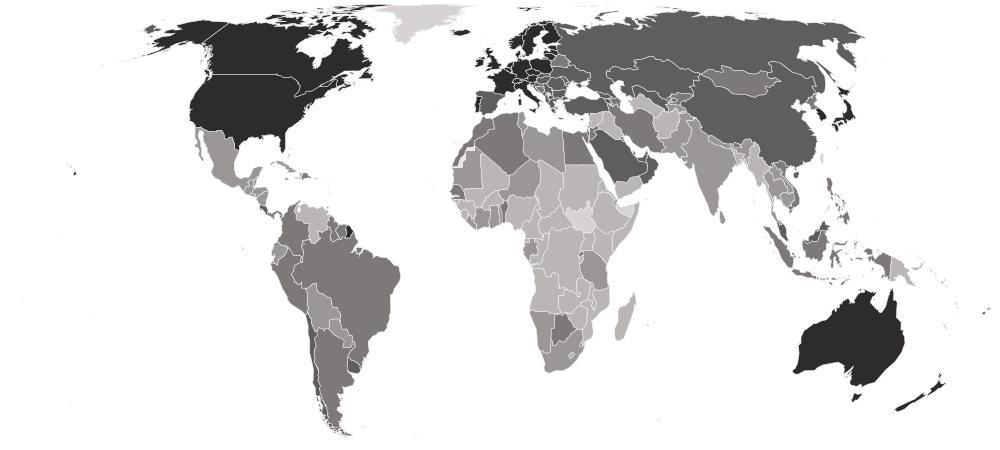
Climate adaptation readiness on a map
Each country is shaded by its value, in five groups holding the same number of countries. Hover a country for its value, or select it to open its profile. Below the map, each continent’s middle country.
Darker is a higher value — the better end.
- 0.13683–0.28751
- 0.28965–0.36612
- 0.37008–0.43375
- 0.43637–0.56390
- 0.56939–0.74947
- No reading in 2024
- Europe
0.60061
the middle country, of 43 measured · 49 members
 Finland0.72742
 Bosnia and Herzegovina0.38029
Highest and lowest reading in Europe.
- Asia
0.40534
the middle country, of 47 measured · 52 members
Singapore0.74947 Iraq0.20993
Highest and lowest reading in Asia.
- Oceania
0.40119
the middle country, of 14 measured · 21 members
 Australia0.65849
 Papua New Guinea0.22256
Highest and lowest reading in Oceania.
- Americas
0.38514
the middle country, of 35 measured · 48 members
 Canada0.64342
 Haiti0.19989
Highest and lowest reading in Americas.
- Africa
0.28116
the middle country, of 53 measured · 55 members
 Mauritius0.47840Central African Republic0.13683
Highest and lowest reading in Africa.
- Every region
22 sub-regions, highest middle country first
- Western Europe
0.66987
the middle country, of 9 measured · 9 members
 Monaco0.71486
 Belgium0.60489
Highest and lowest reading in Western Europe.
- Northern Europe
0.63112
the middle country, of 10 measured · 13 members
Finland0.72742 Lithuania0.57870
Highest and lowest reading in Northern Europe.
- Southern Europe
0.54938
the middle country, of 14 measured · 17 members
 San Marino0.70498Bosnia and Herzegovina0.38029
Highest and lowest reading in Southern Europe.
- Eastern Europe
0.50210
the middle country, of 10 measured · 10 members
 Czechia0.60686
 Belarus0.43375
Highest and lowest reading in Eastern Europe.
- Western Asia
0.45689
the middle country, of 17 measured · 19 members
 Israel0.53975Iraq0.20993
Highest and lowest reading in Western Asia.
- Eastern Asia
0.45498
the middle country, of 5 measured · 8 members
 South Korea0.72170
 North Korea0.37957
Highest and lowest reading in Eastern Asia.
- Caribbean
0.42170
the middle country, of 13 measured · 24 members
 Saint Kitts and Nevis0.61978Haiti0.19989
Highest and lowest reading in Caribbean.
- Micronesia
0.41990
the middle country, of 5 measured · 7 members
 Palau0.58162
 Micronesia0.36149
Highest and lowest reading in Micronesia.
- South America
0.38216
the middle country, of 12 measured · 12 members
 Chile0.54806
 Venezuela0.23202
Highest and lowest reading in South America.
- South-eastern Asia
0.37210
the middle country, of 11 measured · 11 members
Singapore0.74947 Myanmar0.21737
Highest and lowest reading in South-eastern Asia.
- Central Asia
0.37177
the middle country, of 5 measured · 5 members
 Kazakhstan0.48379
 Turkmenistan0.23517
Highest and lowest reading in Central Asia.
- Northern Africa
0.35897
the middle country, of 6 measured · 6 members
 Morocco0.40319
 Sudan0.19418
Highest and lowest reading in Northern Africa.
- Central America
0.34594
the middle country, of 8 measured · 8 members
 Costa Rica0.47671
 Honduras0.29750
Highest and lowest reading in Central America.
- Southern Asia
0.34576
the middle country, of 9 measured · 9 members
 Bhutan0.41416
 Afghanistan0.27211
Highest and lowest reading in Southern Asia.
- Southern Africa
0.31557
the middle country, of 5 measured · 5 members
 Botswana0.38392
 Lesotho0.27432
Highest and lowest reading in Southern Africa.
- Western Africa
0.29410
the middle country, of 16 measured · 16 members
 Cabo Verde0.38083
 Nigeria0.24164
Highest and lowest reading in Western Africa.
- Eastern Africa
0.26240
the middle country, of 17 measured · 19 members
Mauritius0.47840 Eritrea0.17583
Highest and lowest reading in Eastern Africa.
- Middle Africa
0.22357
the middle country, of 9 measured · 9 members
 São Tomé and Príncipe0.35892Central African Republic0.13683
Highest and lowest reading in Middle Africa.
- Australia and New Zealand
2 of 2 measured — too few for a middle: Australia, New Zealand.
Australia0.65849 New Zealand0.62166
Highest and lowest reading in Australia and New Zealand.
- Melanesia
4 of 5 measured — too few for a middle: Fiji, Papua New Guinea, Solomon Islands, Vanuatu.
 Fiji0.43783Papua New Guinea0.22256
Highest and lowest reading in Melanesia.
- Northern America
2 of 4 measured — too few for a middle: Canada, United States.
Canada0.64342 United States0.63182
Highest and lowest reading in Northern America.
- Polynesia
3 of 7 measured — too few for a middle: Samoa, Tonga, Tuvalu.
 Tuvalu0.44979
 Samoa0.33994
Highest and lowest reading in Polynesia.
03The whole field at once
The spread
192 countries, one dot each, on one scale — further right is a higher value. Half the countries are above 0.38733; a quarter are above 0.50762, and a quarter below 0.30429. The bar in each row marks that continent’s middle country.
04All 192 ever measured
Every country
In order, highest value first. “=” marks a rank shared with another country. Readiness is built from general measures — governance, education, infrastructure, the business climate — rather than anything specific to climate, so it sits close to broad development rankings. Countries that display the same three-decimal figure share a rank.
Showing 25 of 192 countries












































































































































Values for 2024. The change column compares 2024 with 2023 only; the sparkline covers the recent editions.
051995–2024 · 30 reference years
Over time
Each point is one year from 1995, all recomputed on the current release’s method, so the line is comparable end to end. Readiness moves faster than vulnerability: institutions and economies change within a decade, geography does not.
- the middle country
- the middle half of countries
- the middle of the 192 countries measured every time
- each continent’s middle country
The same, year by year
| Year | Countries | Middle country | Middle half | Measured every time |
|---|---|---|---|---|
| 2024 | 192 | 0.38733 | 0.30429 – 0.50762 | 0.38733 |
| 2023 | 192 | 0.39205 | 0.30542 – 0.50853 | 0.39205 |
| 2022 | 192 | 0.39000 | 0.30824 – 0.50849 | 0.39000 |
| 2021 | 192 | 0.41083 | 0.31026 – 0.52365 | 0.41083 |
| 2020 | 192 | 0.40951 | 0.31196 – 0.52615 | 0.40951 |
| 2019 | 192 | 0.41007 | 0.31145 – 0.52364 | 0.41007 |
| 2018 | 192 | 0.40843 | 0.31060 – 0.51633 | 0.40843 |
| 2017 | 192 | 0.40634 | 0.30808 – 0.51371 | 0.40634 |
| 2016 | 192 | 0.40534 | 0.30427 – 0.51357 | 0.40534 |
| 2015 | 192 | 0.39947 | 0.30256 – 0.51409 | 0.39947 |
| 2014 | 192 | 0.39809 | 0.29869 – 0.50870 | 0.39809 |
| 2013 | 192 | 0.38712 | 0.29828 – 0.50805 | 0.38712 |
| 2012 | 192 | 0.38644 | 0.30417 – 0.51132 | 0.38644 |
| 2011 | 192 | 0.39112 | 0.30962 – 0.50929 | 0.39112 |
| 2010 | 192 | 0.39031 | 0.31039 – 0.51470 | 0.39031 |
| 2009 | 192 | 0.38812 | 0.31053 – 0.50888 | 0.38812 |
| 2008 | 192 | 0.38801 | 0.31363 – 0.50226 | 0.38801 |
| 2007 | 192 | 0.39017 | 0.31848 – 0.50223 | 0.39017 |
| 2006 | 192 | 0.38998 | 0.31654 – 0.49736 | 0.38998 |
| 2005 | 192 | 0.38774 | 0.31552 – 0.50221 | 0.38774 |
| 2004 | 192 | 0.38689 | 0.32017 – 0.48869 | 0.38689 |
| 2003 | 192 | 0.38181 | 0.31205 – 0.49078 | 0.38181 |
| 2002 | 192 | 0.38580 | 0.31283 – 0.48807 | 0.38580 |
| 2001 | 192 | 0.38343 | 0.31409 – 0.48480 | 0.38343 |
| 2000 | 192 | 0.38406 | 0.31279 – 0.48258 | 0.38406 |
| 1999 | 192 | 0.38243 | 0.31371 – 0.48334 | 0.38243 |
| 1998 | 192 | 0.38216 | 0.31114 – 0.48159 | 0.38216 |
| 1997 | 192 | 0.38358 | 0.31229 – 0.48201 | 0.38358 |
| 1996 | 192 | 0.38320 | 0.31256 – 0.48132 | 0.38320 |
| 1995 | 192 | 0.38528 | 0.31245 – 0.48079 | 0.38528 |
062023 → 2024
Who rose and fell
The biggest changes in value between the two newest editions — reference years recalculated in one report, not two separate publications. Places are shown second, because they also move when other countries do.
Improved most
before → after- Palau0.53116 → 0.58162 · 45th → 33rd+0.05046
 Vanuatu0.27371 → 0.30071 · 163rd → 146th+0.02700
- Tuvalu0.43349 → 0.44979 · 75th → 71st+0.01630
 Marshall Islands0.40369 → 0.41990 · 92nd → 82nd+0.01621
 Saudi Arabia0.47879 → 0.49367 · 58th → 50th+0.01488
Declined most
before → after Nepal0.36314 → 0.32704 · 117th → 134th−0.03610
- Chad0.19556 → 0.16614 · 186th → 190th−0.02942
- Samoa0.36873 → 0.33994 · 114th → 127th−0.02879
 Bangladesh0.31179 → 0.28428 · 142nd → 156th−0.02752
 Rwanda0.44852 → 0.42166 · 70th → 80th−0.02687
192 countries were measured in both 2023 and 2024.
07Across every edition
Climate adaptation readiness in records
The extremes of the statistic. A record reached by more than one country names none of them.
Highest reading on record
0.81516
ND-GAIN Readiness (0–1, where 1 is the most ready)
Notre Dame Global Adaptation Initiative (ND-GAIN), University of Notre Dame · 2021
Lowest reading on record
0.12151
ND-GAIN Readiness (0–1, where 1 is the most ready)
Notre Dame Global Adaptation Initiative (ND-GAIN), University of Notre Dame · 2014
Biggest improvement between editions
+0.10685
0.59893 → 0.70578
Notre Dame Global Adaptation Initiative (ND-GAIN), University of Notre Dame · 2005 → 2006
Biggest decline between editions
−0.13549
0.48912 → 0.35363
Notre Dame Global Adaptation Initiative (ND-GAIN), University of Notre Dame · 2021 → 2022
Most improved since first measured
+0.19403
0.32448 → 0.51851
Notre Dame Global Adaptation Initiative (ND-GAIN), University of Notre Dame · 1995 → 2024
At the top most often
13 of 30
editions, alone at the first-listed end
Notre Dame Global Adaptation Initiative (ND-GAIN), University of Notre Dame · 1995–2024
08The measure
About climate adaptation readiness
ND-GAIN’s Readiness score measures how able a country is to turn investment into adaptation to climate change — through its economy, its governance and its social conditions — on a scale from 0 to 1, where higher is more ready. It is one of the two halves of the ND-GAIN Country Index.
What the number is: ND-GAIN Readiness (0–1, where 1 is the most ready).
What it does not measure
It is built from general economic, governance and social conditions, not from climate policy, so it does not show whether a country has an adaptation plan or is spending on one.
09Where it fits
Connections
Its part in the Country Index, the statistics whose values line up most closely with it across countries, and others on the same subject.
In the Country Index
Context, with no vote
This statistic is published in full under Governance & Institutions and Risk & Resilience, but does not help decide any Country Index standing.
Governance & InstitutionsRisk & ResilienceWhich statistics vote, and why
Moves with
Where climate adaptation readiness is higher, these tend to be higher too.
- ND-GAIN Country IndexNotre Dame Global Adaptation Initiative (ND-GAIN), University of Notre Dame · 190 countries in commonρ 0.96
- Global Innovation IndexWorld Intellectual Property Organization · 138 countries in commonρ 0.91
- World Energy Trilemma IndexKeyWorld Energy Council · 125 countries in commonρ 0.91
Moves against
Where climate adaptation readiness is higher, these tend to be lower.
- Gender Inequality IndexUNDP Human Development Report Office · 172 countries in commonρ −0.91
- Learning PovertyWorld Bank Group and UNESCO Institute for Statistics · 105 countries in commonρ −0.90
- Coefficient of Human InequalityUNDP Human Development Report Office · 166 countries in commonρ −0.85
Rank correlation (ρ, from −1 to 1) across countries, on each statistic’s newest edition, out of 188 statistics sharing at least 80 countries with this one. Two statistics that move together do not cause each other.
10Keep reading
Explore further
The subject
The countries at either end
More from Notre Dame Global Adaptation Initiative (ND-GAIN), University of Notre Dame
11Questions
Climate adaptation readiness: questions and answers
Which country has the highest climate adaptation readiness?
Singapore, at 0.74947, among the 192 countries compared in 2024.
Which country has the lowest climate adaptation readiness?
Central African Republic, at 0.13683, among the 192 countries compared in 2024.
How many countries does the Climate Readiness (ND-GAIN) cover?
192 in 2024.
What is the world average climate adaptation readiness?
This site does not calculate a world average, which would depend on how countries are weighted. In the middle country of the 192 compared in 2024, the figure was 0.38733.
Is this Notre Dame Global Adaptation Initiative (ND-GAIN), University of Notre Dame’s own ranking?
Yes. The rank shown is the one Notre Dame Global Adaptation Initiative (ND-GAIN), University of Notre Dame publishes.
How often is the Climate Readiness (ND-GAIN) published?
This site holds 30 reference years, 1995–2024, all recalculated in Notre Dame Global Adaptation Initiative (ND-GAIN), University of Notre Dame’s 2026 report on one method — not 30 separate publications.
Where does the data come from, and can I download it?
From Notre Dame Global Adaptation Initiative (ND-GAIN), University of Notre Dame, under CC BY 3.0 Unported. Imported from ND-GAIN’s own download, the readiness file only. The economic, governance and social components and the underlying indicators are not republished; the latter are other agencies’ data. The ranks are those ND-GAIN prints on its own ranking page. Every edition is on this site’s Datasets pages as a full table, and downloads as a CSV file with every value unrounded.
12Method
Sources, method and citation
Source
Climate Readiness (ND-GAIN) — Notre Dame Global Adaptation Initiative (ND-GAIN), University of Notre Dame
Imported from ND-GAIN’s own download, the readiness file only. The economic, governance and social components and the underlying indicators are not republished; the latter are other agencies’ data. The ranks are those ND-GAIN prints on its own ranking page.
Newest edition
Report year 2024Data year 2024
Cite the source as: University of Notre Dame Global Adaptation Initiative. ND-GAIN Country Index, 2026 release — Readiness. Method: Chen, C., Noble, I., Hellmann, J., Coffee, J., Murillo, M. and Chawla, N. (2015). University of Notre Dame Global Adaptation Index: Country Index Technical Report. Notre Dame, IN: University of Notre Dame.
Licence: CC BY 3.0 Unported, checked 2026-09-26.
How this page reads the numbers
- The rank is Notre Dame Global Adaptation Initiative (ND-GAIN), University of Notre Dame’s own, as published.
- Which end is better follows the publisher’s own reading of the measure.
- A country is named at an end only when it holds that value alone. Where several share it, the page says how many and names none first.
- Values are stored exactly as published and trimmed only for display. “The middle country” is the median of the countries measured, not a world average.
The file itself, column by column — where it came from, what each column holds, and every edition as a CSV — is on its dataset page.
Photographs
The countries at the top of this statistic, from their profiles: Wikimedia Commons, shown in greyscale, each used under the licence named.
- Singapore — Khairul Nizam ., CC BY 2.0
- Finland — Joonas Lyytinen, CC BY-SA 2.5
- South Korea — Unknown author, CC BY-SA 2.0
Cite this page
Nations Inquiry (2026). Climate adaptation readiness by country: Climate Readiness (ND-GAIN), data from Notre Dame Global Adaptation Initiative (ND-GAIN), University of Notre Dame. https://nationsinquiry.com/statistics/climate-readiness