
Photo: Guido Radig,Inkey · CC BY 3.0 · via Wikimedia Commons, shown in greyscale

Liechtenstein
Liechtenstein places highest on Researchers per Million Inhabitants (top 1% worldwide) and lowest on Municipal Solid Waste Generation (bottom 6%).
Share
Liechtenstein in the Nations Inquiry Country Index
Liechtenstein appears in 90 of the statistics tracked here, but is not placed in the Country Index: the index needs a standing on three quarters of its topics, and Liechtenstein is measured on too few of them. Every published reading below is unaffected.
At a glance
Population
39,598
people
since 1950
Land area
160
km²
since 1961
Life expectancy
83.63
years at birth
since 1950
Human development
0.938
HDI, 0–1
since 2000
The newest published figure for each, the year it describes and who published it, with a line showing how it has moved.
01The country
About Liechtenstein
Liechtenstein follows the east bank of the Alpine Rhine, then climbs into the mountains, and both countries around it are landlocked too, so reaching any coast means crossing two borders. A principality, it is a constitutional monarchy in which the reigning prince shares power with an elected parliament, the Landtag. Gutenberg Castle stands on its rock above Balzers, the Walser village of Triesenberg clings to the slope, and the Rätikon range rises behind to the Grauspitz and the ski runs of Malbun.
The country is named after a family, not a place. The Liechtensteins bought the lordship of Schellenberg in 1699 and the county of Vaduz in 1712 to win a princely seat in the Holy Roman Empire, and in January 1719 the emperor made the two a principality. It became sovereign in 1806, abolished its army in 1868 and joined a customs union with Switzerland in 1923. The princes lived in Vienna until 1938, when Franz Joseph II settled in the castle above Vaduz.
On the first Sunday of Lent villages light the Funken, tall bonfires crowned with a straw witch, to burn away winter, and fireworks burst over the castle on the national holiday in August. Käsknöpfle, small cheese dumplings with fried onions, is the dish families argue over. Factories matter as much as banks: firms in Schaan and Eschen make Hilti power tools, false teeth and car steering systems, and many workers commute each morning from Austria and Switzerland.
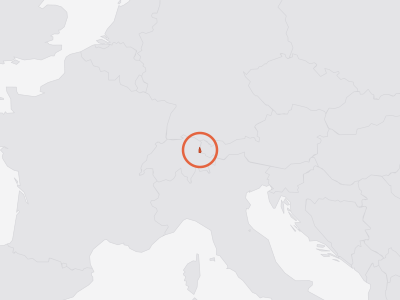
Key facts about Liechtenstein
- Capital
- Vaduz
- Official language
- German
- Currency
- Swiss franc (CHF)
- ISO code
- LIE · LI
- Domain · dialling
- .li · +423
As Wikidata records them. Official languages are the least consistent — some countries list only a national language, others every regional one. Sources and licences.
02Country Index 2026
Where it stands, topic by topic
Strongest first. Each position is Liechtenstein’s place among the countries with a standing on that topic, built from a few key statistics chosen to measure different things.
1stof 193
From 2 of 4 key statistics
3rdof 198
From 2 of 4 key statistics
16thof 198
From 2 of 4 key statistics
joint19thof 196
From 2 of 3 key statistics
27thof 186
From 2 of 4 key statistics
102ndof 198
From 2 of 4 key statistics
No standing — Liechtenstein holds too few of this subject’s key statistics to be placed on it.
No standing — Liechtenstein holds too few of this subject’s key statistics to be placed on it.
No standing — Liechtenstein holds too few of this subject’s key statistics to be placed on it.
No standing — Liechtenstein holds too few of this subject’s key statistics to be placed on it.
No standing — Liechtenstein holds too few of this subject’s key statistics to be placed on it.
No standing — Liechtenstein holds too few of this subject’s key statistics to be placed on it.
No standing — Liechtenstein holds too few of this subject’s key statistics to be placed on it.
No standing — Liechtenstein holds too few of this subject’s key statistics to be placed on it.
No standing — Liechtenstein holds too few of this subject’s key statistics to be placed on it.
No standing — Liechtenstein holds too few of this subject’s key statistics to be placed on it.
Each standing is built from a few key statistics chosen to measure different things. Select a subject for Liechtenstein’s readings on it, or see every statistic held for Liechtenstein in the table further down this page.
03Highs and lows
Where Liechtenstein stands out
The two ends of its own record: every statistic on which Liechtenstein sits within ten places of the best or worst in the world, plus its strongest and weakest readings overall. Each is turned into a percentile — its place among every country measured — which is what lets a hunger score and a press-freedom rank be compared at all.
Where Liechtenstein does best10
In the top third of all countries measured. 10 are within ten places of the best in the world, in a field of at least 50 countries — marked with that place.
- 1stDeaths in Organized Violencetop 35%
Position · derived 59th of 59 · 1 = worst · 0 · 2025
world median 0
- 1st
Position · derived 1st of 145 · 18,130 · 2024
world median 701.95 (better)
- 2nd
Position · derived 2nd of 150 · 30.44 · 2024
world median 0.725 (better)
- 2nd
Position · derived 2nd of 211 · 1.526 · 2025
world median 0.171 (better)
- 2nd
Position · derived 2nd of 84 · 6.01 · 2023
world median 0.814 (better)
- 3rdINFORM Risk Indextop 1%
Position · derived 189th of 191 · 1 = worst · 1 · 2025
world median 3.7 (better)
- 6thRule of Lawtop 2%
Position · derived 6th of 211 · 1.71 · 2025
world median -0.102 (better) · ▲ 4 pts since 2015
- 7th
- 7thWorld Risk Indextop 3%
Position · derived 187th of 193 · 1 = worst · 0.68 · 2025
world median 4.17 (better)
- 8th
Position · derived 215th of 222 · 1 = worst · 37.14 · 2023
world median 133.7 (better)
Where Liechtenstein struggles most3
Nothing falls into the world's bottom third — these are Liechtenstein's weakest areas even so.
- Municipal Solid Waste Generationbottom 6%
Position · derived 12th of 201 · 1 = worst · 2.268 · 2026
world median 0.966 (worse)
- Riverine Flood Risk (Aqueduct)bottom 21%
Rank 36th of 163 · 1 = worst · 3.817 · 2019
world median 2.403 (worse)
- GovTech Maturity Indexbottom 43%
Position · derived 112th of 196 · 0.554 · 2025
world median 0.63 (worse) · ▲ 21 pts since 2022
A band is a place among the countries each publisher scores, so Liechtenstein can move because other countries moved. See the Country Index for the full method.
04Over time
Which way it is moving
The published rank in widely quoted reports, edition by edition — each end with the size of that year’s field.
Human Development Index
UNDP Human Development Report Office
15th
of 171 · 2000
17th
of 193 · 2023
Ranked in 24 of 34 editions
Government AI Readiness Index
Oxford Insights
63rd
of 193 · 2023
98th
of 195 · 2025
Ranked in 3 of 6 editions
05In context
Liechtenstein and its neighbours
A position reads best beside the countries around it. Every position below is a place in the world ranking, not within the region.
Shares a land border with
Across Western Europe
Every country in the sub-region, by its position in the world.
- 1
 Switzerland
- =6
 Austria
- =6
 Luxembourg
- 8
 Germany
- 9
 Netherlands
- =17
 Belgium
- =19
 France
- —Liechtensteinnot placed
- —
 Monaconot placed
06The evidence
Every statistic we hold for Liechtenstein
Grouped by topic. Each row gives the newest edition’s rank or position, the published value and the year the numbers describe. Select a statistic for this country’s row beside every other country, the world median and every edition.
Governance & Institutions14
- Child and Family Benefit CoverageILO · Children or households with children receiving child or family cash benefits (%)top 8%1002024
- Civic Space RatingsCIVICUS · Civic space score (0–100)7th of 198position · derived91.582025
- Climate Readiness (ND-GAIN)Notre Dame Global Adaptation Initiative (ND-GAIN), University of Notre Dame · ND-GAIN Readiness (0–1, where 1 is the most ready)12th of 192rank0.672024
- Completeness of Birth RegistrationUNICEF · Children under 5 whose birth is registered (%)top 14%1002025
- Control of CorruptionWorld Bank Group · Control of Corruption (−2.5 to 2.5)12th of 211position · derived1.7552025
- Disability Benefit CoverageILO · People with severe disabilities receiving disability benefits (%)top 14%1002025
- Government AI Readiness IndexOxford Insights · AI readiness score (0–100)98th of 195rank40.192025
- Government EffectivenessWorld Bank Group · Governance estimate (−2.5 weak to 2.5 strong)14th of 209position · derived1.6352025
- GovTech Maturity IndexWorld Bank Group · GTMI score (0–1)112th of 196position · derived0.5542025
- Old-Age Pension CoverageILO · People above statutory pensionable age receiving an old-age pension (%)top 15%1002025
- Regulatory QualityWorld Bank Group · Regulatory Quality (−2.5 to 2.5)13th of 209position · derived1.5482025
- Rule of LawWorld Bank Group · Rule of Law estimate (−2.5 to 2.5)6th of 211position · derived1.712025
- Voice and AccountabilityWorld Bank Group · Voice and Accountability estimate (−2.5 to 2.5)18th of 206position · derived1.3382025
Economy & Innovation6
- Merchant Fleet by Country of OwnershipUNCTAD · Merchant fleet owned (thousand dead-weight tons)bottom 28%28.092026
- Research and Development SpendingUIS · Gross domestic expenditure on R&D (% of GDP)2nd of 84position · derived6.012023
- Researchers per Million InhabitantsUIS · Researchers per million inhabitants (full-time equivalent)1st of 145position · derived18,1302024
- Scholarly ArticlesOurResearch · Articles with at least one author at an institution in the country (full counting)bottom 19%1352025
- Statutory Corporate Income Tax RateOECD · Combined statutory corporate income tax rate, central and sub-central government (%)bottom 15%12.52026
- Tax Revenue (% of GDP)OECD · Total tax revenue, all levels of government (% of GDP)bottom 46%21.072024
Work & Labour2
- Employment Injury Protection CoverageILO · Labour force covered in the event of a work injury (%)top 17%87.72024
- Unemployment Benefit CoverageILO · Unemployed people receiving unemployment benefits (%)top 2%1002024
Education & Knowledge5
- Expected Years of SchoolingUNDP Human Development Report Office · Expected years of schooling61st of 195position · derived15.412023
- Female Share of ResearchersUIS · Researchers who are women (% of headcount; 50 = parity)bottom 19%25.42024
- Mean Years of SchoolingUNDP Human Development Report Office · Mean years of schooling (adults 25+)35th of 193position · derived12.412023
- Minimum Proficiency in Mathematics, End of Lower SecondaryUIS · Students at the end of lower secondary reaching minimum proficiency in mathematics (%)top 4%85.922023
- Minimum Proficiency in Reading, End of Lower SecondaryUIS · Students at the end of lower secondary reaching minimum proficiency in reading (%)top 2%87.622022
Health & Wellbeing8
- Adolescent Birth Rate (Ages 15–19)UN DESA Population Division · Live births per 1,000 women aged 15–19212th of 222position · derived · 1 = worst1.7182023
- Adult Mortality (Probability of Dying Between 15 and 60)UN DESA Population Division · Deaths before age 60 per 1,000 people alive at 15, at that year's death rates215th of 222position · derived · 1 = worst37.142023
- Days Above 35°CECMWF · Days a year with a maximum temperature above 35°C, averaged over the country’s landtop 16%02025
- Excess Mortality During the COVID-19 PandemicAriel Karlinsky and Dmitry Kobak (World Mortality Dataset) · Excess deaths per 100,000 people, March 2020 to the end of each country's data (at most December 2023)top 14%114.22026
- Human Development IndexUNDP Human Development Report Office · HDI score (0–1)17th of 193rank0.9382023
- Life Expectancy at Age 65UN DESA Population Division · Further years a 65-year-old would live at current death rates17th of 222position · derived21.172023
- Life Expectancy at BirthUN DESA Population Division · Years a newborn would live at current death rates13th of 222position · derived83.632023
- PM2.5 Air Pollution ExposureAtmospheric Composition Analysis Group, Washington University in St. Louis · Population-weighted PM2.5 concentration (µg/m³)165th of 220position · derived · 1 = worst8.52023
Development & Human Capital3
- Access to ElectricityWorld Bank Group · Population with electricity access (%)top 28%1002024
- Access to Electricity, RuralWorld Bank Group · Rural population with electricity access (%)top 29%1002024
- Gender Development IndexUNDP Human Development Report Office · Gender Development Index (1.000 = parity)96th of 184position · derived0.9642023
Environment & Sustainability17
- Agricultural EmissionsFAO · Farm-gate emissions (kt CO₂eq)193rd of 193position · derived02023
- Agricultural LandFAO · Agricultural land (% of land area)118th of 209position · derived32.312023
- Annual Forest Area Change RateFAO · Compound annual change in forest area over the interval ending that year (%)top 8%0.752025
- Arable Land per PersonFAO · Arable land (hectares per person)153rd of 206position · derived0.0432023
- Baseline Water Stress (Aqueduct)WRI · Baseline water stress score (0–5)top 32%0.8132019
- Burned AreaGWIS · Burned area (hectares)bottom 12%02025
- Children's Climate Risk IndexUNICEF · Children's Climate Risk Index (0–10, higher is more risk)153rd of 163rank · 1 = worst2.22020
- CO₂ Emissions per CapitaGlobal Carbon Project · Fossil CO₂ (tonnes per person)103rd of 210position · derived · 1 = worst3.3012024
- Fisheries and Aquaculture ProductionFAO · Fish, crustaceans, molluscs and other aquatic animals caught or farmed, tonnes (live weight)bottom 1%02024
- Forest AreaFAO · Forest area (% of land area)72nd of 210position · derived41.882023
- Forest Area within Legally Established Protected AreasFAO · Forest within legally established protected areas, as a share of the country's 2015 forest area (%)top 29%31.532025
- Municipal Solid Waste GenerationWorld Bank Group · Municipal solid waste generated (kg per person per day)12th of 201position · derived · 1 = worst2.2682026
- Organic Agricultural AreaFAO · Organic share of agricultural land (%)2nd of 150position · derived30.442024
- Population Living Below 5 m ElevationCenter for International Earth Science Information Network (CIESIN), Columbia University · Population living below 5 m elevation (% of total population)bottom 10%02015
- Temperature Change on LandFAO · Change in mean land-surface temperature against the country's own 1951–1980 average, °Ctop 11%2.2782025
- Tree Cover LossWorld Resources Institute — Global Forest Watch (data: University of Maryland) · Tree cover loss (hectares, where canopy cover exceeded 30% in 2000)bottom 19%4.5842025
- World Risk IndexInstitute for International Law of Peace and Armed Conflict (IFHV), Ruhr University Bochum · WorldRiskIndex score (0–100, where 100 is the most at risk)187th of 193position · derived · 1 = worst0.682025
Gender & Equality3
- Female-Headed HouseholdsUN DESA Population Division · Households headed by a woman (% of households)top 40%37.492026
- Mean Age at First Marriage, WomenUN DESA Population Division · Singulate mean age at marriage, women (years)top 18%29.92019
- Sex Ratio at BirthUN DESA Population Division · Male births per 100 female birthstop 1%116.32023
Peace & Security6
- Civilian Deaths in Organized ViolenceUCDP · Civilians killed in organized violence (people)top 37%02025
- Deaths in Non-State ConflictUCDP · Deaths in non-state conflict (people)top 43%02025
- Deaths in Organized ViolenceUCDP · Deaths in organized violence (people)59th of 59position · derived · 1 = worst02025
- Deaths in State-Based Armed ConflictUCDP · Deaths in state-based armed conflict (people)top 39%02025
- INFORM Risk IndexEuropean Commission Joint Research Centre, with the Inter-Agency Standing Committee · INFORM Risk score (0–10, where 10 is the highest risk)189th of 191position · derived · 1 = worst12025
- Political Stability and Absence of ViolenceWorld Bank Group · Political Stability estimate (−2.5 to 2.5)2nd of 211position · derived1.5262025
Risk & Resilience3
- Asylum-Seekers by Country of AsylumUNHCR, the UN Refugee Agency · Asylum-seekers awaiting a decision, end of year (people)bottom 19%372025
- Refugee Population by Country of AsylumUNHCR, the UN Refugee Agency · Refugees under UNHCR's mandate hosted, end of year (people)bottom 28%9872025
- Riverine Flood Risk (Aqueduct)WRI · Riverine flood risk score (0–5)36th of 163rank · 1 = worst3.8172019
Mobility & Trade4
- EmigrantsUN DESA Population Division · Migrants from the country living abroad, mid-year (people)bottom 1%3462024
- International MigrantsUN DESA Population Division · International migrants living in the country, mid-year (people)bottom 19%27,6692024
- Net Migration RateUN DESA Population Division · Net migrants per 1,000 populationtop 15%5.4042023
Energy1
- Photovoltaic Power Potential (PVOUT)World Bank Group (ESMAP), data by Solargis · Practical solar power potential (kWh per kWp per day, long-term average)bottom 8%3.2452020
Digital & Technology3
- GitHub DevelopersGitHub · Developer accounts located in the economy (as of quarter end)bottom 16%3,0562026
- GitHub Git PushesGitHub · Git pushes during the quarterbottom 5%4,6992025
- GitHub RepositoriesGitHub · Public repositories located in the economy (as of quarter end)bottom 17%4,6852026
People & Population15
- Average Household SizeUN DESA Population Division · Average number of usual residents per household (people)bottom 5%2.212026
- Crude Birth RateUN DESA Population Division · Births per 1,000 populationbottom 23%9.3672023
- Crude Death RateUN DESA Population Division · Deaths per 1,000 populationtop 46%7.582023
- Mean Age at ChildbearingUN DESA Population Division · Mean age of mothers at the birth of their children (years)top 5%32.182023
- Median Age of the PopulationUN DESA Population Division · Median age (years)top 8%44.22023
- One-Person HouseholdsUN DESA Population Division · Households with exactly one member (% of households)top 6%36.132026
- Population Aged 65 and OverUN DESA Population Division · Share of the total population aged 65 and over (%)top 13%20.162023
- Population DensityUN DESA Population Division · People per square kilometre of landtop 24%247.492023
- Population Growth RateUN DESA Population Division · Population growth (% per year)bottom 44%0.6972023
- Population Living in Cities (Degree of Urbanisation)UN DESA Population Division · Share of the population living in cities as the Degree of Urbanisation defines them (%)bottom 8%02025
- Population Under Age 15UN DESA Population Division · Share of the total population aged 0–14 (%)bottom 10%14.352023
- Sex Ratio of the Total PopulationUN DESA Population Division · Males per 100 femalestop 48%98.672023
- Total Dependency RatioUN DESA Population Division · People aged 0–14 and 65+ per 100 people aged 15–64bottom 40%52.692023
- Total Fertility RateUN DESA Population Division · Live births per womanbottom 31%1.5372023
07Method
Sources and how to read them
How to read this page
- The scores and ranks belong to their publishers. Nothing is adjusted, rescaled or re-ranked; each is reproduced from the edition named beside it. Where a row says position · derived, the publisher ranks nobody on that measure and the position is ours, made by ordering the published score.
- Each statistic shows its newest edition, which is not always the edition the Country Index uses: the index pins every source to one data year so its average compares like with like.
How a standing is built from percentiles, why Liechtenstein can move because other countries moved, and why publishers measure between 120 and 215 countries each are set out in full in how a standing is made and what a standing cannot tell you.
Sources
- Statistics: 27 publishers, each named beside its numbers, with every edition and licence on the datasets pages.
- Capital, languages, currency, codes: Wikidata, public domain (CC0).
- Map and land borders: Natural Earth, public domain. Borders are de facto — where administration actually changes — not claimed.
Photographs
The photograph of Liechtenstein on this page comes from Wikimedia Commons and is shown in greyscale. The photographer and the licence are named beside each one.
Cite this page
Nations Inquiry (2026). Liechtenstein: country statistics, rankings and trends. https://nationsinquiry.com/countries/liechtenstein