Loading…
World Bank Group · Control of Corruption
Control of corruption by country
How far is public power believed to be used for private gain?
Denmark placed first of the 211 countries compared in 2025, at 2.25937, and South Sudan last, at -2.09597. In the middle country the figure was -0.19727. Among the 185 countries measured in every edition since 1996, the middle one moved from -0.21627 to -0.27917.
Part ofGovernance & Institutions
Control of corruption · 2025
Context statistic

Highest of 211Denmark
2.25937012025 · position · derived
Who leads
The three countries at the highest end of 211 compared, the three at the other end, and the first on each continent.
 1
1Photo: User:Aconcagua · CC BY-SA 3.0, greyscale
 2
2Photo: Joonas Lyytinen · CC BY-SA 2.5, greyscale
 3
3Photo: Simon Koopmann derivative work: Jjtkk · CC BY-SA 2.0 de, greyscale

Lowest in 2025
- 211
 South Sudan-2.09597
 - 210
 Somalia-1.69186
 - 209
 Yemen-1.67914
Positions out of 211. Where a country sits says how it compares with the others measured, and nothing about why.
Highest on each continent
- Africa
 Seychelles1.22578
 - Americas
 Canada1.59490
 - Asia
 Singapore1.97252
 - EuropeDenmark2.25937
- Oceania
 New Zealand1.88650
 - Every region
02Every measured country
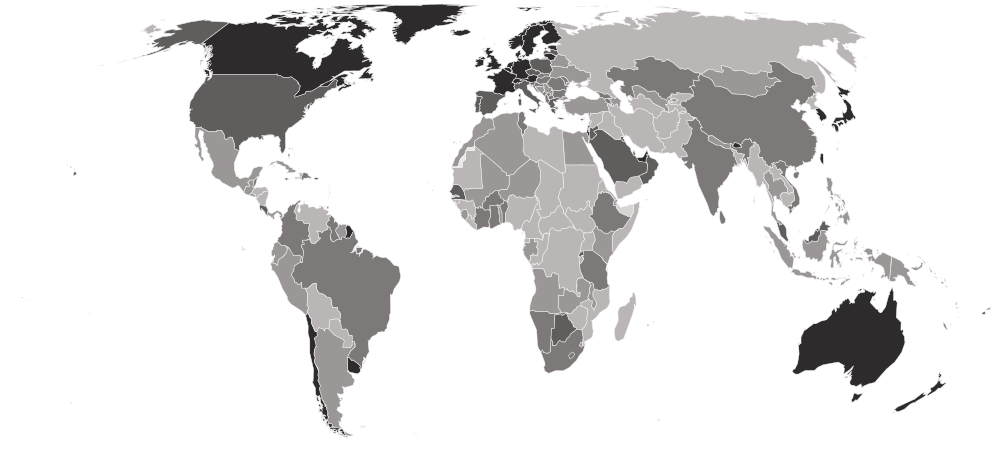
Control of corruption on a map
Each country is shaded by its value, in five groups holding the same number of countries. Hover a country for its value, or select it to open its profile. Below the map, each continent’s middle country.
Darker is a higher value — the better end.
- -2.09597–-0.94536
- -0.94245–-0.38188
- -0.38105–0.14792
- 0.15011–0.90688
- 0.92386–2.25937
- No reading in 2025
- Europe
0.77710
the middle country, of 44 measured · 49 members
Denmark2.25937 Russia-0.98302
Highest and lowest reading in Europe.
- Oceania
0.40576
the middle country, of 20 measured · 21 members
New Zealand1.88650 Papua New Guinea-0.77872
Highest and lowest reading in Oceania.
- Americas
-0.07940
the middle country, of 42 measured · 48 members
Canada1.59490 Venezuela-1.54558
Highest and lowest reading in Americas.
- Asia
-0.33385
the middle country, of 51 measured · 52 members
Singapore1.97252Yemen-1.67914Highest and lowest reading in Asia.
- Africa
-0.77983
the middle country, of 54 measured · 55 members
Seychelles1.22578South Sudan-2.09597Highest and lowest reading in Africa.
- Every region
22 sub-regions, highest middle country first
- Northern Europe
1.73026
the middle country, of 10 measured · 13 members
Denmark2.25937 Latvia0.76994
Highest and lowest reading in Northern Europe.
- Western Europe
1.67606
the middle country, of 9 measured · 9 members
 Switzerland1.98342
 Monaco1.17983
Highest and lowest reading in Western Europe.
- Eastern Asia
0.74883
the middle country, of 8 measured · 8 members
 Hong Kong1.63636
 North Korea-1.55255
Highest and lowest reading in Eastern Asia.
- Caribbean
0.52015
the middle country, of 18 measured · 24 members
 Barbados1.22759
 Haiti-1.54046
Highest and lowest reading in Caribbean.
- Micronesia
0.48507
the middle country, of 6 measured · 7 members
 Guam1.17983
 Kiribati0.29676
Highest and lowest reading in Micronesia.
- Western Asia
0.19689
the middle country, of 18 measured · 19 members
 United Arab Emirates1.15226Yemen-1.67914
Highest and lowest reading in Western Asia.
- Southern Europe
0.17729
the middle country, of 15 measured · 17 members
2 share 1.17983
 Serbia-0.60195
Highest and lowest reading in Southern Europe.
- Polynesia
0.14489
the middle country, of 7 measured · 7 members
 American Samoa1.17983
 Niue-0.45166
Highest and lowest reading in Polynesia.
- Eastern Europe
-0.12827
the middle country, of 10 measured · 10 members
 Poland0.84844Russia-0.98302
Highest and lowest reading in Eastern Europe.
- Southern Africa
-0.13344
the middle country, of 5 measured · 5 members
 Botswana0.58977
 Eswatini-0.79983
Highest and lowest reading in Southern Africa.
- Melanesia
-0.15503
the middle country, of 5 measured · 5 members
 Fiji0.53467Papua New Guinea-0.77872
Highest and lowest reading in Melanesia.
- South America
-0.38397
the middle country, of 12 measured · 12 members
 Uruguay1.55623Venezuela-1.54558
Highest and lowest reading in South America.
- South-eastern Asia
-0.49538
the middle country, of 11 measured · 11 members
Singapore1.97252 Myanmar-1.30524
Highest and lowest reading in South-eastern Asia.
- Northern Africa
-0.61582
the middle country, of 6 measured · 6 members
 Tunisia-0.20388
 Sudan-1.57134
Highest and lowest reading in Northern Africa.
- Western Africa
-0.72111
the middle country, of 16 measured · 16 members
 Cabo Verde0.90688
 Guinea-Bissau-1.39985
Highest and lowest reading in Western Africa.
- Central America
-0.74058
the middle country, of 8 measured · 8 members
 Costa Rica0.69391
 Nicaragua-1.38000
Highest and lowest reading in Central America.
- Southern Asia
-0.77300
the middle country, of 9 measured · 9 members
 Bhutan1.47343
 Afghanistan-1.30580
Highest and lowest reading in Southern Asia.
- Eastern Africa
-0.90468
the middle country, of 18 measured · 19 members
Seychelles1.22578South Sudan-2.09597Highest and lowest reading in Eastern Africa.
- Central Asia
-1.10468
the middle country, of 5 measured · 5 members
 Kazakhstan-0.26210
 Turkmenistan-1.30622
Highest and lowest reading in Central Asia.
- Middle Africa
-1.32491
the middle country, of 9 measured · 9 members
 São Tomé and Príncipe0.12839
 DR Congo-1.49038
Highest and lowest reading in Middle Africa.
- Australia and New Zealand
2 of 2 measured — too few for a middle: Australia, New Zealand.
New Zealand1.88650 Australia1.83815
Highest and lowest reading in Australia and New Zealand.
- Northern America
4 of 4 measured — too few for a middle: Bermuda, Canada, Greenland, United States.
Canada1.59490 United States0.86521
Highest and lowest reading in Northern America.
03The whole field at once
The spread
211 countries, one dot each, on one scale — further right is a higher value. Half the countries are above -0.19727; a quarter are above 0.68238, and a quarter below -0.77688. The bar in each row marks that continent’s middle country.
04All 211 ever measured
Every country
In order, highest value first. “=” marks a position shared with another country. World Bank Group ranks nobody on this measure; the position is derived here by ordering the published values. This measures the same thing as the Corruption Perceptions Index, largely from the same expert and business surveys, so the two are close to the same reading on different scales rather than independent confirmation of each other. What it adds is reach and depth: more countries, and a series going back to 1996. Like the CPI, it records perceptions, not proven cases.
Showing 25 of 211 countries






























































































































































Values for 2025. The change column compares 2025 with 2024 only; the sparkline covers the recent editions.
051996–2025 · 27 editions
Over time
Each point is one year. The scale runs from about −2.5 to 2.5 and is re-estimated across all years at each release, so the whole line can shift when the World Bank updates its sources — and because it is a z-score, the world average sits at 0 every year.
- the middle country
- the middle half of countries
- the middle of the 185 countries measured every time
- each continent’s middle country
The same, year by year
| Year | Countries | Middle country | Middle half | Measured every time |
|---|---|---|---|---|
| 2025 | 211 | -0.19727 | -0.77688 – 0.68238 | -0.27917 |
| 2024 | 211 | -0.19990 | -0.79401 – 0.69549 | -0.28703 |
| 2023 | 211 | -0.18019 | -0.71578 – 0.72371 | -0.29535 |
| 2022 | 211 | -0.17618 | -0.69024 – 0.70117 | -0.25821 |
| 2021 | 209 | -0.16083 | -0.70878 – 0.71473 | -0.22777 |
| 2020 | 207 | -0.11465 | -0.77370 – 0.71770 | -0.19271 |
| 2019 | 207 | -0.11896 | -0.79489 – 0.74180 | -0.19897 |
| 2018 | 207 | -0.16049 | -0.84383 – 0.73954 | -0.27476 |
| 2017 | 207 | -0.16058 | -0.82126 – 0.74532 | -0.29464 |
| 2016 | 207 | -0.21635 | -0.80850 – 0.76292 | -0.28683 |
| 2015 | 209 | -0.26655 | -0.81065 – 0.72250 | -0.34047 |
| 2014 | 207 | -0.28475 | -0.83598 – 0.60368 | -0.37090 |
| 2013 | 207 | -0.22703 | -0.79110 – 0.74206 | -0.31542 |
| 2012 | 207 | -0.23829 | -0.78019 – 0.77484 | -0.35007 |
| 2011 | 207 | -0.20294 | -0.67979 – 0.71906 | -0.30760 |
| 2010 | 207 | -0.22410 | -0.70575 – 0.71880 | -0.30105 |
| 2009 | 206 | -0.24309 | -0.73273 – 0.66778 | -0.28798 |
| 2008 | 204 | -0.25097 | -0.74840 – 0.62488 | -0.29148 |
| 2007 | 203 | -0.26983 | -0.75325 – 0.62483 | -0.30647 |
| 2006 | 202 | -0.22814 | -0.74539 – 0.68927 | -0.27057 |
| 2005 | 202 | -0.27908 | -0.83828 – 0.69424 | -0.35540 |
| 2004 | 200 | -0.23809 | -0.80743 – 0.56061 | -0.31438 |
| 2003 | 188 | -0.25011 | -0.85954 – 0.57495 | -0.27576 |
| 2002 | 188 | -0.23629 | -0.86053 – 0.57353 | -0.24516 |
| 2000 | 187 | -0.23302 | -0.82757 – 0.65940 | -0.24082 |
| 1998 | 186 | -0.18681 | -0.80371 – 0.70647 | -0.19785 |
| 1996 | 185 | -0.21627 | -0.73422 – 0.80842 | -0.21627 |
062024 → 2025
Who rose and fell
The biggest changes in value between the two newest editions. Places are shown second, because they also move when other countries do.
Improved most
before → after Antigua and Barbuda0.29034 → 0.58795 · 80th → 61st+0.29761
 Dominican Republic-0.26282 → 0.00940 · 112th → 94th+0.27222
 Comoros-1.14142 → -0.87820 · 181st → 164th+0.26323
 Vietnam-0.26273 → -0.10632 · 111th → 99th+0.15641
 Puerto Rico0.39674 → 0.54228 · 74th → 66th+0.14554
Declined most
before → after- Monaco1.80392 → 1.17983 · 12th → 29th−0.62410
 Georgia0.40490 → -0.14011 · 73rd → 102nd−0.54501
 Cuba-0.22737 → -0.72779 · 108th → 153rd−0.50042
- United States1.07936 → 0.86521 · 40th → 46th−0.21415
 Gambia-0.30072 → -0.51075 · 118th → 137th−0.21003
211 countries were measured in both 2024 and 2025.
07Across every edition
Control of corruption in records
The extremes of the statistic. A record reached by more than one country names none of them.
Highest reading on record
2.48530
Control of Corruption (−2.5 to 2.5)
Lowest reading on record
-2.09597
Control of Corruption (−2.5 to 2.5)
Biggest improvement between editions
+1.05006
-1.58900 → -0.53894
Biggest decline between editions
−1.41846
0.09663 → -1.32184
Most improved since first measured
+1.44016
-0.80397 → 0.63619
At the top most often
12 of 27
editions, alone at the first-listed end
08The measure
About control of corruption
Control of Corruption is one of the World Bank's six Worldwide Governance Indicators. It captures how far public power is seen to be used for private gain — from petty bribery to grand corruption — and how far the state is captured by elites and private interests, for about 210 countries every year since 1996.
What the number is: Control of Corruption (−2.5 to 2.5).
What it does not measure
It measures how corrupt a public sector is perceived to be by surveys and experts, not proven cases, and it draws on many of the same sources as the Corruption Perceptions Index, so the two are not independent readings.
09Where it fits
Connections
Its part in the Country Index, the statistics whose values line up most closely with it across countries, and others on the same subject.
In the Country Index
Context, with no vote
This statistic is published in full under Governance & Institutions, but does not help decide any Country Index standing.
Moves with
Where control of corruption is higher, these tend to be higher too.
- Corruption Perceptions IndexKeyTransparency International · 182 countries in commonρ 0.98
- Rule of LawKeyWorld Bank Group · 211 countries in commonρ 0.95
- Government EffectivenessKeyWorld Bank Group · 209 countries in commonρ 0.91
Moves against
Where control of corruption is higher, these tend to be lower.
- Political Corruption IndexV-Dem Institute, University of Gothenburg · 175 countries in commonρ −0.91
- INFORM Risk IndexKeyEuropean Commission Joint Research Centre, with the Inter-Agency Standing Committee · 191 countries in commonρ −0.82
- Learning PovertyWorld Bank Group and UNESCO Institute for Statistics · 108 countries in commonρ −0.76
Rank correlation (ρ, from −1 to 1) across countries, on each statistic’s newest edition, out of 190 statistics sharing at least 80 countries with this one. Two statistics that move together do not cause each other.
10Keep reading
Explore further
The subject
The countries at either end
More from World Bank Group
- Access to Electricity
- Account Ownership at a Financial Institution
- Adjusted Net Savings
- Agriculture, Forestry and Fishing Value Added (% of GDP)
- Average Time to Clear Exports Through Customs
- Business Ready: Operational Efficiency
- Business Ready: Public Services
- Business Ready: Regulatory Framework
- All statistics
11Questions
Control of corruption: questions and answers
Which country has the highest control of corruption?
Denmark, at 2.25937, among the 211 countries compared in 2025.
Which country has the lowest control of corruption?
South Sudan, at -2.09597, among the 211 countries compared in 2025.
How many countries does the Control of Corruption cover?
211 in 2025. The number measured varies from 185 to 211 between editions.
What is the world average control of corruption?
This site does not calculate a world average, which would depend on how countries are weighted. In the middle country of the 211 compared in 2025, the figure was -0.19727.
Is this World Bank Group’s own ranking?
No. World Bank Group publishes the values but ranks nobody; the position on this page is derived by Nations Inquiry by ordering the published values, and equal values share a position.
How often is the Control of Corruption published?
This site holds 27 editions, describing 1996 to 2025.
Where does the data come from, and can I download it?
From World Bank Group, under CC BY 4.0. From the World Bank’s Worldwide Governance Indicators, read from the Bank’s Data360 file in the same pass as government-effectiveness, voice-and-accountability, political-stability, rule-of-law and regulatory-quality. Dependent territories the Bank scores but the site does not cover as countries are left out. Every edition is on this site’s Datasets pages as a full table, and downloads as a CSV file with every value unrounded.
12Method
Sources, method and citation
Source
Control of Corruption — World Bank Group
From the World Bank’s Worldwide Governance Indicators, read from the Bank’s Data360 file in the same pass as government-effectiveness, voice-and-accountability, political-stability, rule-of-law and regulatory-quality. Dependent territories the Bank scores but the site does not cover as countries are left out.
Newest edition
Report year 2025Data year 2025
Cite the source as: World Bank. Worldwide Governance Indicators. Washington, DC: World Bank Group.
Licence: CC BY 4.0, checked 2026-09-26.
How this page reads the numbers
- World Bank Group ranks nobody on this measure. The position is derived by Nations Inquiry by ordering the published values; equal values share a position.
- Which end is better follows the publisher’s own reading of the measure.
- A country is named at an end only when it holds that value alone. Where several share it, the page says how many and names none first.
- Values are stored exactly as published and trimmed only for display. “The middle country” is the median of the countries measured, not a world average.
The file itself, column by column — where it came from, what each column holds, and every edition as a CSV — is on its dataset page.
Photographs
The countries at the top of this statistic, from their profiles: Wikimedia Commons, shown in greyscale, each used under the licence named.
- Denmark — User:Aconcagua, CC BY-SA 3.0
- Finland — Joonas Lyytinen, CC BY-SA 2.5
- Switzerland — Simon Koopmann derivative work: Jjtkk, CC BY-SA 2.0 de
Cite this page
Nations Inquiry (2026). Control of corruption by country: Control of Corruption, data from World Bank Group. https://nationsinquiry.com/statistics/control-of-corruption