
Photo: mcclave · CC BY 2.0 · via Wikimedia Commons, shown in greyscale
French Polynesia places highest on PM2.5 Air Pollution Exposure (top 1% worldwide) and lowest on Youth Unemployment Rate (bottom 6%).
Share
French Polynesia in the Nations Inquiry Country Index
French Polynesia appears in 91 of the statistics tracked here, but is not placed in the Country Index: the index needs a standing on three quarters of its topics, and French Polynesia is measured on too few of them. Every published reading below is unaffected.
At a glance
Population
281,118
people
since 1950
Land area
3,521
km²
since 1961
Life expectancy
84.07
years at birth
since 1950
Unemployment
11.66
% of the labour force
since 1991
The newest published figure for each, the year it describes and who published it, with a line showing how it has moved.
01The country
About French Polynesia
French Polynesia, an overseas collectivity of France with its own president and assembly, spreads across five archipelagos of the South Pacific. The Society Islands hold Tahiti, Moorea and Bora Bora, volcanic peaks ringed by lagoons; the Tuamotus are a long chain of atolls, Rangiroa among them. The Marquesas rise sheer from the ocean, and the Austral and Gambier groups lie further south. Off Tahiti Iti, the reef at Teahupoʻo raises a wave so heavy it hosted Olympic surfing in 2024.
Polynesian navigators, reading stars and swells, settled the islands long before Europeans, and the marae of Taputapuātea on Raiatea was sacred to voyagers across the eastern Pacific. James Cook came to Tahiti in 1769 to observe the transit of Venus. France made Tahiti a protectorate in 1842, and the last king, Pōmare V, ceded his realm in 1880. Paul Gauguin died on Hiva Oa in 1903. From 1966 to 1996 France tested nuclear weapons at Moruroa and Fangataufa.
The Heiva festival fills July with drumming, ʻori Tahiti dance, himene choirs and contests in fruit carrying and stone lifting. The English word tattoo comes from the Polynesian tatau, and Marquesan designs wrap the body in bold bands. Outrigger canoe racing, vaʻa, rules island sport. Poisson cru, raw tuna in lime juice and coconut milk, is eaten everywhere. Tourism leads the economy, followed by black pearls farmed in Tuamotu and Gambier lagoons, vanilla from Tahaʻa, copra, tuna and spending by the French state.
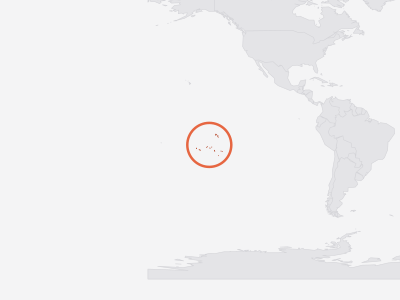
Key facts about French Polynesia
- Capital
- Papeete
- Official language
- French
- Currency
- CFP Franc (XPF)
- ISO code
- PYF · PF
- Domain · dialling
- .pf · +689
As Wikidata records them. Official languages are the least consistent — some countries list only a national language, others every regional one. Sources and licences.
02Country Index 2026
Where it stands, topic by topic
Strongest first. Each position is French Polynesia’s place among the countries with a standing on that topic, built from a few key statistics chosen to measure different things.
76thof 165
From 2 of 3 key statistics
122ndof 177
From 3 of 4 key statistics
128thof 182
From 4 of 4 key statistics
No standing — French Polynesia holds too few of this subject’s key statistics to be placed on it.
No standing — French Polynesia holds too few of this subject’s key statistics to be placed on it.
No standing — French Polynesia holds too few of this subject’s key statistics to be placed on it.
No standing — French Polynesia holds too few of this subject’s key statistics to be placed on it.
No standing — French Polynesia holds too few of this subject’s key statistics to be placed on it.
No standing — French Polynesia holds too few of this subject’s key statistics to be placed on it.
No standing — French Polynesia holds too few of this subject’s key statistics to be placed on it.
No standing — French Polynesia holds too few of this subject’s key statistics to be placed on it.
No standing — French Polynesia holds too few of this subject’s key statistics to be placed on it.
No standing — French Polynesia holds too few of this subject’s key statistics to be placed on it.
No standing — French Polynesia holds too few of this subject’s key statistics to be placed on it.
No standing — French Polynesia holds too few of this subject’s key statistics to be placed on it.
No standing — French Polynesia holds too few of this subject’s key statistics to be placed on it.
Each standing is built from a few key statistics chosen to measure different things. Select a subject for French Polynesia’s readings on it, or see every statistic held for French Polynesia in the table further down this page.
03Highs and lows
Where French Polynesia stands out
The two ends of its own record: every statistic on which French Polynesia sits within ten places of the best or worst in the world, plus its strongest and weakest readings overall. Each is turned into a percentile — its place among every country measured — which is what lets a hunger score and a press-freedom rank be compared at all.
Where French Polynesia does best5
In the top third of all countries measured. 3 are within ten places of the best in the world, in a field of at least 50 countries — marked with that place.
- 3rd
Position · derived 218th of 220 · 1 = worst · 2.6 · 2023
world median 14.45 (better)
- 6thLife Expectancy at Birthtop 2%
Position · derived 6th of 222 · 84.07 · 2023
world median 74.63 (better) · ▲ 6 pts since 2013
- 7th
Position · derived 216th of 222 · 1 = worst · 35.29 · 2023
world median 133.7 (better)
Position · derived 11th of 222 · 21.5 · 2023
world median 16.39 (better) · ▲ 6 pts since 2013
Where French Polynesia struggles most5
In the bottom third of all countries measured.
- Youth Unemployment Ratebottom 6%
Position · derived 12th of 182 · 1 = worst · 36.57 · 2025
world median 12.83 (worse) · ▼ 5 pts since 2015
- Unemployment Ratebottom 14%
Position · derived 26th of 182 · 1 = worst · 11.66 · 2025
world median 5.084 (worse) · ▼ 8 pts since 2015
- Employment-to-Population Ratiobottom 15%
Position · derived 155th of 182 · 46.26 · 2025
world median 57.72 (worse) · ▼ 9 pts since 2015
- Labour Force Participation Ratebottom 20%
Position · derived 146th of 182 · 52.37 · 2025
world median 61.66 (worse) · ▼ 8 pts since 2015
- ICT Goods Exportsbottom 24%
Position · derived 92nd of 119 · 0.13 · 2024
world median 0.975 (worse) · ▼ 29 pts since 2014
A band is a place among the countries each publisher scores, so French Polynesia can move because other countries moved. See the Country Index for the full method.
04In context
French Polynesia and its neighbours
A position reads best beside the countries around it. Every position below is a place in the world ranking, not within the region.
Shares a land border with
French Polynesia has no land border with another country.
Across Polynesia
Every country in the sub-region, by its position in the world.
- 89
 Samoa
- =97
 Tonga
- —
 American Samoanot placed
- —
 Cook Islandsnot placed
- —
 French Polynesianot placed
- —
 Niuenot placed
- —
 Tuvalunot placed
05The evidence
Every statistic we hold for French Polynesia
Grouped by topic. Each row gives the newest edition’s rank or position, the published value and the year the numbers describe. Select a statistic for this country’s row beside every other country, the world median and every edition.
Governance & Institutions3
- Control of CorruptionWorld Bank Group · Control of Corruption (−2.5 to 2.5)106th of 211position · derived-0.1972025
- Rule of LawWorld Bank Group · Rule of Law estimate (−2.5 to 2.5)59th of 211position · derived0.6492025
- Voice and AccountabilityWorld Bank Group · Voice and Accountability estimate (−2.5 to 2.5)48th of 206position · derived0.8772025
Economy & Innovation12
- Creative Goods ExportsUNCTAD · Creative goods exports (% of merchandise exports)bottom 35%0.5342024
- Crop Production IndexFAO · Crop production index (2014–2016 = 100)118th of 195position · derived102.192022
- Export Concentration IndexUNCTAD · Export concentration index (0–1, normalised Herfindahl–Hirschman)top 14%0.5712025
- Food Production IndexFAO · Food production index (2014–2016 = 100)114th of 195position · derived102.812022
- Foreign Direct Investment InflowsUNCTAD · FDI inflows (% of GDP)bottom 12%0.1662025
- ICT Goods ExportsUNCTAD · ICT goods exports (% of total goods exports)92nd of 119position · derived0.132024
- Liner Shipping Connectivity IndexUNCTAD · LSCI (index, average Q1 2023 = 100)90th of 175rank47.752026
- Livestock Production IndexFAO · Livestock production index (2014–2016 = 100)111th of 194position · derived104.412022
- Merchant Fleet by Country of OwnershipUNCTAD · Merchant fleet owned (thousand dead-weight tons)bottom 28%29.512026
- Scholarly ArticlesOurResearch · Articles with at least one author at an institution in the country (full counting)bottom 24%2102025
- Terms of Trade IndexUNCTAD · Terms of trade index (2015 = 100)bottom 5%77.072025
- Total Natural Resources Rents (% of GDP)World Bank Group · Natural resources rents (% of GDP)171st of 180position · derived0.0042021
Work & Labour13
- Average Weekly Hours WorkedILO · Average weekly hours actually worked per employed person131st of 182position · derived35.332025
- Employment in AgricultureILO · Employment in agriculture (% of total employment)156th of 182position · derived1.9182025
- Employment in IndustryILO · Employment in industry (% of total employment)143rd of 182position · derived14.332025
- Employment in ServicesILO · Employment in services (% of total employment)11th of 182position · derived83.752025
- Employment-to-Population RatioILO · Employed share of the population aged 15+ (%)155th of 182position · derived46.262025
- Female Labour Force Participation RateILO · Women aged 15+ in the labour force (%)132nd of 182position · derived46.632025
- Labour Force Participation RateILO · Population aged 15+ in the labour force (%)146th of 182position · derived52.372025
- Labour Productivity per Hour WorkedILO · Output per hour worked (constant 2021 international $ at PPP)36th of 182position · derived56.92025
- Self-Employment RateILO · Self-employed (% of total employment)126th of 182position · derived18.22025
- Unemployment RateILO · Unemployment (% of labour force)26th of 182position · derived · 1 = worst11.662025
- Vulnerable EmploymentILO · Vulnerable employment (% of total employment)126th of 182position · derived · 1 = worst14.782025
- Youth Unemployment RateILO · Unemployment, ages 15-24 (% of youth labour force)12th of 182position · derived · 1 = worst36.572025
Health & Wellbeing8
- Adolescent Birth Rate (Ages 15–19)UN DESA Population Division · Live births per 1,000 women aged 15–19124th of 222position · derived · 1 = worst24.342023
- Adult Mortality (Probability of Dying Between 15 and 60)UN DESA Population Division · Deaths before age 60 per 1,000 people alive at 15, at that year's death rates216th of 222position · derived · 1 = worst35.292023
- Days Above 35°CECMWF · Days a year with a maximum temperature above 35°C, averaged over the country’s landtop 16%02025
- Excess Mortality During the COVID-19 PandemicAriel Karlinsky and Dmitry Kobak (World Mortality Dataset) · Excess deaths per 100,000 people, March 2020 to the end of each country's data (at most December 2023)top 21%150.92026
- Life Expectancy at Age 65UN DESA Population Division · Further years a 65-year-old would live at current death rates11th of 222position · derived21.52023
- Life Expectancy at BirthUN DESA Population Division · Years a newborn would live at current death rates6th of 222position · derived84.072023
- PM2.5 Air Pollution ExposureAtmospheric Composition Analysis Group, Washington University in St. Louis · Population-weighted PM2.5 concentration (µg/m³)218th of 220position · derived · 1 = worst2.62023
- Prevalence of UndernourishmentFAO · Population undernourished (%)94th of 104position · derived · 1 = worst3.82023
Development & Human Capital2
- Access to ElectricityWorld Bank Group · Population with electricity access (%)top 28%1002024
- Access to Electricity, RuralWorld Bank Group · Rural population with electricity access (%)top 29%1002024
Environment & Sustainability18
- Agricultural LandFAO · Agricultural land (% of land area)183rd of 209position · derived8.6622023
- Arable Land per PersonFAO · Arable land (hectares per person)189th of 206position · derived0.0092023
- Burned AreaGWIS · Burned area (hectares)bottom 12%02025
- Carbon Intensity of ElectricityEmber · Carbon intensity (gCO₂e per kWh generated)82nd of 165position · derived · 1 = worst440.282024
- CO₂ Emissions per CapitaGlobal Carbon Project · Fossil CO₂ (tonnes per person)104th of 210position · derived · 1 = worst3.2752024
- Coal Share of Electricity GenerationEmber · Coal (% of electricity generated)top 32%02024
- Fertilizer Consumption per HectareFAO · Fertilizer consumption (kg per hectare of arable land)66th of 188position · derived130.42023
- Fisheries and Aquaculture ProductionFAO · Fish, crustaceans, molluscs and other aquatic animals caught or farmed, tonnes (live weight)bottom 31%13,6022024
- Forest AreaFAO · Forest area (% of land area)67th of 210position · derived43.062023
- Low-Carbon Share of Electricity GenerationEmber · Low-carbon sources (% of electricity generated)88th of 162position · derived34.722024
- Mangrove AreaGlobal Mangrove Watch (Aberystwyth University, JAXA, soloEO, Wetlands International, The Nature Conservancy) · Mangrove forest area (hectares)bottom 16%78.52025
- Methane EmissionsEDGAR · Methane emissions (gigagrams of CH₄)bottom 15%3.2542025
- Municipal Solid Waste GenerationWorld Bank Group · Municipal solid waste generated (kg per person per day)120th of 201position · derived · 1 = worst0.8192026
- Population Living Below 5 m ElevationCenter for International Earth Science Information Network (CIESIN), Columbia University · Population living below 5 m elevation (% of total population)top 13%14.552015
- Renewable Share of Electricity GenerationEmber · Renewables (% of electricity generated)79th of 162position · derived34.722024
- Solar Electricity Installed CapacityEIA · Solar generating capacity installed (gigawatts)bottom 43%0.0732024
- Solar Share of Electricity GenerationEmber · Solar (% of electricity generated)top 29%8.3332024
- Wind and Solar Share of Electricity GenerationEmber · Wind and solar (% of electricity generated)top 43%8.3332024
Gender & Equality3
- Female-Headed HouseholdsUN DESA Population Division · Households headed by a woman (% of households)top 43%36.552026
- Mean Age at First Marriage, WomenUN DESA Population Division · Singulate mean age at marriage, women (years)top 1%33.82019
- Sex Ratio at BirthUN DESA Population Division · Male births per 100 female birthstop 31%105.92023
Peace & Security2
- Political Stability and Absence of ViolenceWorld Bank Group · Political Stability estimate (−2.5 to 2.5)77th of 211position · derived0.5762025
- Refugees by Country of OriginUNHCR, the UN Refugee Agency · Refugees under UNHCR's mandate from this country, end of year (people)bottom 2%02025
Mobility & Trade5
- Container Import Dwell TimeWorld Bank Group · Median days a full import container waits in port74th of 156position · derived · 1 = worst4.62024
- EmigrantsUN DESA Population Division · Migrants from the country living abroad, mid-year (people)bottom 6%2,0082024
- International MigrantsUN DESA Population Division · International migrants living in the country, mid-year (people)bottom 20%30,0992024
- Net Migration RateUN DESA Population Division · Net migrants per 1,000 populationbottom 13%-4.7942023
Energy8
- Crude Oil ProductionEIA · Crude oil produced (thousand barrels per day)bottom 26%02025
- Gas Share of Electricity GenerationEmber · Natural gas (% of electricity generated)bottom 22%02024
- Hydro Share of Electricity GenerationEmber · Hydropower (% of electricity generated)top 37%26.392024
- Natural Gas ProductionEIA · Dry natural gas produced (billion cubic metres)bottom 27%02024
- Net Electricity Imports (share of generation)Ember · Net electricity imports (% of domestic generation)bottom 42%02024
- Nuclear Share of Electricity GenerationEmber · Nuclear (% of electricity generated)bottom 45%02024
- Photovoltaic Power Potential (PVOUT)World Bank Group (ESMAP), data by Solargis · Practical solar power potential (kWh per kWp per day, long-term average)top 41%4.3942020
- Primary Energy ProductionEIA · Primary energy produced (quadrillion Btu)bottom 20%0.0012024
Digital & Technology3
- GitHub DevelopersGitHub · Developer accounts located in the economy (as of quarter end)bottom 22%6,0572026
- GitHub Git PushesGitHub · Git pushes during the quarterbottom 8%5,7212025
- GitHub RepositoriesGitHub · Public repositories located in the economy (as of quarter end)bottom 21%7,7542026
People & Population14
- Crude Birth RateUN DESA Population Division · Births per 1,000 populationbottom 33%10.912023
- Crude Death RateUN DESA Population Division · Deaths per 1,000 populationbottom 4%3.6492023
- Mean Age at ChildbearingUN DESA Population Division · Mean age of mothers at the birth of their children (years)top 45%29.22023
- Median Age of the PopulationUN DESA Population Division · Median age (years)top 40%34.792023
- One-Person HouseholdsUN DESA Population Division · Households with exactly one member (% of households)top 42%17.552026
- Population Aged 65 and OverUN DESA Population Division · Share of the total population aged 65 and over (%)top 42%10.732023
- Population DensityUN DESA Population Division · People per square kilometre of landbottom 42%76.312023
- Population Growth RateUN DESA Population Division · Population growth (% per year)bottom 29%0.2472023
- Population Living in Cities (Degree of Urbanisation)UN DESA Population Division · Share of the population living in cities as the Degree of Urbanisation defines them (%)bottom 41%32.712025
- Population Under Age 15UN DESA Population Division · Share of the total population aged 0–14 (%)bottom 40%19.732023
- Sex Ratio of the Total PopulationUN DESA Population Division · Males per 100 femalestop 18%102.442023
- Total Dependency RatioUN DESA Population Division · People aged 0–14 and 65+ per 100 people aged 15–64bottom 15%43.82023
- Total Fertility RateUN DESA Population Division · Live births per womanbottom 28%1.5012023
06Method
Sources and how to read them
How to read this page
- The scores and ranks belong to their publishers. Nothing is adjusted, rescaled or re-ranked; each is reproduced from the edition named beside it. Where a row says position · derived, the publisher ranks nobody on that measure and the position is ours, made by ordering the published score.
- Each statistic shows its newest edition, which is not always the edition the Country Index uses: the index pins every source to one data year so its average compares like with like.
How a standing is built from percentiles, why French Polynesia can move because other countries moved, and why publishers measure between 120 and 215 countries each are set out in full in how a standing is made and what a standing cannot tell you.
Sources
- Statistics: 19 publishers, each named beside its numbers, with every edition and licence on the datasets pages.
- Capital, languages, currency, codes: Wikidata, public domain (CC0).
- Map and land borders: Natural Earth, public domain. Borders are de facto — where administration actually changes — not claimed.
Photographs
The photograph of French Polynesia on this page comes from Wikimedia Commons and is shown in greyscale. The photographer and the licence are named beside each one.
Cite this page
Nations Inquiry (2026). French Polynesia: country statistics, rankings and trends. https://nationsinquiry.com/countries/french-polynesia