FAO · Arable Land per Person
Arable land per person by country
How much cropland does a country have for each of its people?
Of the 206 countries compared in 2023, Kazakhstan had the highest reading, 1.459397, and Singapore had the lowest reading, 0.000095. In the middle country the figure was 0.108619. Among the 172 countries measured in every edition since 1961, the middle one moved from 0.243860 to 0.096340.
Share
Arable land per person · 2023
Context statistic

Highest of 206Kazakhstan
1.459397012023 · position · derived
The highest and the lowest
The three countries with the highest values of 206 compared, the three with the lowest, and the highest on each continent. This statistic has no better end, so no country is shown as leading.
- 1
- 2

- 3

Lowest in 2023
- 206
 Singapore0.000095
- 205
 Hong Kong0.000265
- 204
 Seychelles0.001252
Positions out of 206. This statistic has no better end: the two ends describe size, not success.
02Every measured country
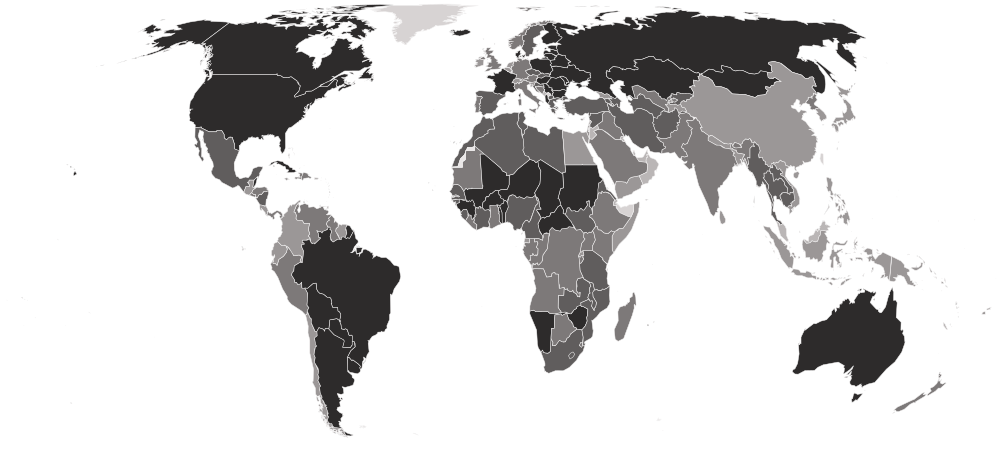
Arable land per person on a map
Each country is shaded by its value, in five groups holding the same number of countries. Hover a country for its value, or select it to open its profile. Below the map, each continent’s middle country.
Darker is a higher value. This statistic has no better end, so the shades describe size, not success.
- 0.000095–0.025651
- 0.027092–0.085739
- 0.086112–0.146531
- 0.148973–0.240844
- 0.243246–1.459397
- No reading in 2023
- Europe
0.229973
the middle country, of 44 measured · 49 members
 Ukraine0.872556
 Faroe Islands0.001287
Highest and lowest reading in Europe.
- Africa
0.162448
the middle country, of 54 measured · 55 members
 Niger0.676609Seychelles0.001252
Highest and lowest reading in Africa.
- Americas
0.085925
the middle country, of 42 measured · 48 members
Canada0.952606 Cayman Islands0.002738
Highest and lowest reading in Americas.
- Asia
0.076860
the middle country, of 49 measured · 52 members
Kazakhstan1.459397Singapore0.000095Highest and lowest reading in Asia.
- Oceania
0.021675
the middle country, of 17 measured · 21 members
Australia1.162407 Northern Mariana Islands0.001772
Highest and lowest reading in Oceania.
- Every region
22 sub-regions, highest middle country first
- Eastern Europe
0.490946
the middle country, of 10 measured · 10 members
Ukraine0.872556 Czechia0.232351
Highest and lowest reading in Eastern Europe.
- Northern Europe
0.296122
the middle country, of 12 measured · 13 members
 Lithuania0.801996Faroe Islands0.001287
Highest and lowest reading in Northern Europe.
- Northern Africa
0.207170
the middle country, of 6 measured · 6 members
 Sudan0.419541
 Egypt0.027092
Highest and lowest reading in Northern Africa.
- Western Africa
0.185453
the middle country, of 16 measured · 16 members
Niger0.676609 Mauritania0.089598
Highest and lowest reading in Western Africa.
- Central Asia
0.181187
the middle country, of 5 measured · 5 members
Kazakhstan1.459397 Tajikistan0.081272
Highest and lowest reading in Central Asia.
- Southern Africa
0.154338
the middle country, of 5 measured · 5 members
 Namibia0.269988
 Botswana0.104828
Highest and lowest reading in Southern Africa.
- Middle Africa
0.140825
the middle country, of 9 measured · 9 members
 Central African Republic0.349350
 São Tomé and Príncipe0.017326
Highest and lowest reading in Middle Africa.
- Eastern Africa
0.123641
the middle country, of 18 measured · 19 members
 Zimbabwe0.246035Seychelles0.001252
Highest and lowest reading in Eastern Africa.
- Central America
0.120493
the middle country, of 8 measured · 8 members
 Belize0.243246
 Costa Rica0.032736
Highest and lowest reading in Central America.
- Southern Europe
0.118137
the middle country, of 14 measured · 17 members
 Serbia0.393013
 Andorra0.009059
Highest and lowest reading in Southern Europe.
- South America
0.116578
the middle country, of 12 measured · 12 members
 Argentina0.886885
 Colombia0.048724
Highest and lowest reading in South America.
- Southern Asia
0.106997
the middle country, of 9 measured · 9 members
 Afghanistan0.189267
 Maldives0.007605
Highest and lowest reading in Southern Asia.
- Western Europe
0.082647
the middle country, of 8 measured · 9 members
 France0.247165
 Liechtenstein0.043417
Highest and lowest reading in Western Europe.
- South-eastern Asia
0.067049
the middle country, of 11 measured · 11 members
 Cambodia0.236465Singapore0.000095
Highest and lowest reading in South-eastern Asia.
- Eastern Asia
0.054669
the middle country, of 6 measured · 8 members
 Mongolia0.328417Hong Kong0.000265
Highest and lowest reading in Eastern Asia.
- Melanesia
0.031762
the middle country, of 5 measured · 5 members
 Fiji0.083104
 New Caledonia0.020595
Highest and lowest reading in Melanesia.
- Western Asia
0.028477
the middle country, of 18 measured · 19 members
 Türkiye0.237642
 Bahrain0.001332
Highest and lowest reading in Western Asia.
- Caribbean
0.024793
the middle country, of 19 measured · 24 members
 Cuba0.263940Cayman Islands0.002738
Highest and lowest reading in Caribbean.
- Micronesia
0.013984
the middle country, of 6 measured · 7 members
 Micronesia0.017757Northern Mariana Islands0.001772
Highest and lowest reading in Micronesia.
- Australia and New Zealand
2 of 2 measured — too few for a middle: Australia, New Zealand.
Australia1.162407 New Zealand0.100000
Highest and lowest reading in Australia and New Zealand.
- Northern America
3 of 4 measured — too few for a middle: Bermuda, Canada, United States.
Canada0.952606 Bermuda0.004637
Highest and lowest reading in Northern America.
- Polynesia
4 of 7 measured — too few for a middle: American Samoa, French Polynesia, Samoa, Tonga.
 Tonga0.191210
 French Polynesia0.008893
Highest and lowest reading in Polynesia.
03The whole field at once
The spread
206 countries, one dot each, on one scale — further right is a higher value. Half the countries are above 0.108619; a quarter are above 0.220701, and a quarter below 0.042409. The bar in each row marks that continent’s middle country.
Log scale: each gridline is ten times the one before, so countries of very different sizes can be seen on one line.
04All 206 ever measured
Every country
In order, highest value first. “=” marks a position shared with another country. Food and Agriculture Organization of the United Nations (FAO) ranks nobody on this measure; the position is derived here by ordering the published values. Neither end is better. This is land divided by people, so a thinly populated plain scores high and a dense, productive, food-importing economy scores low. The ordering is a size order rather than a league table.
Showing 25 of 206 countries





















































































































































Values for 2023. The change column compares 2023 with 2022 only; the sparkline covers the recent editions.
051961–2023 · 63 reference years
Over time
Each point is one reference year from 1961. The line usually moves because population moved, not because the land did.
- the middle country
- the middle half of countries
- the middle of the 172 countries measured every time
- each continent’s middle country
The same, year by year
| Year | Countries | Middle country | Middle half | Measured every time |
|---|---|---|---|---|
| 2023 | 206 | 0.108619 | 0.042409 – 0.220701 | 0.096340 |
| 2022 | 206 | 0.110404 | 0.042471 – 0.223163 | 0.097925 |
| 2021 | 206 | 0.113344 | 0.042545 – 0.226788 | 0.099299 |
| 2020 | 206 | 0.112870 | 0.042682 – 0.231921 | 0.102105 |
| 2019 | 206 | 0.111671 | 0.042823 – 0.232323 | 0.102363 |
| 2018 | 206 | 0.113507 | 0.043378 – 0.234753 | 0.106084 |
| 2017 | 206 | 0.114591 | 0.043017 – 0.237845 | 0.106572 |
| 2016 | 206 | 0.116238 | 0.042836 – 0.239036 | 0.110996 |
| 2015 | 206 | 0.117802 | 0.043298 – 0.240063 | 0.111204 |
| 2014 | 206 | 0.127883 | 0.039670 – 0.236850 | 0.113500 |
| 2013 | 206 | 0.123787 | 0.041506 – 0.247789 | 0.114977 |
| 2012 | 206 | 0.128091 | 0.043923 – 0.254614 | 0.116139 |
| 2011 | 204 | 0.129234 | 0.043481 – 0.257830 | 0.116712 |
| 2010 | 204 | 0.128900 | 0.046515 – 0.259139 | 0.117990 |
| 2009 | 204 | 0.128918 | 0.046859 – 0.257979 | 0.117004 |
| 2008 | 204 | 0.132796 | 0.046767 – 0.263331 | 0.115515 |
| 2007 | 204 | 0.133367 | 0.047455 – 0.258925 | 0.116035 |
| 2006 | 204 | 0.135775 | 0.048484 – 0.262060 | 0.119900 |
| 2005 | 202 | 0.135919 | 0.048605 – 0.264649 | 0.124361 |
| 2004 | 202 | 0.142095 | 0.048919 – 0.266185 | 0.132525 |
| 2003 | 202 | 0.144996 | 0.050914 – 0.266212 | 0.139611 |
| 2002 | 202 | 0.146201 | 0.051874 – 0.271826 | 0.143673 |
| 2001 | 202 | 0.147693 | 0.053172 – 0.277639 | 0.145227 |
| 2000 | 202 | 0.153411 | 0.053700 – 0.282797 | 0.145312 |
| 1999 | 200 | 0.153268 | 0.055566 – 0.291624 | 0.145079 |
| 1998 | 200 | 0.154822 | 0.056346 – 0.288339 | 0.142724 |
| 1997 | 200 | 0.161387 | 0.058285 – 0.300117 | 0.145313 |
| 1996 | 200 | 0.163280 | 0.059332 – 0.302530 | 0.146265 |
| 1995 | 200 | 0.165457 | 0.060784 – 0.303121 | 0.150265 |
| 1994 | 200 | 0.166166 | 0.060853 – 0.300254 | 0.158079 |
| 1993 | 200 | 0.169662 | 0.061219 – 0.303202 | 0.161119 |
| 1992 | 196 | 0.171897 | 0.060928 – 0.299353 | 0.159356 |
| 1991 | 177 | 0.156805 | 0.051236 – 0.293584 | 0.168097 |
| 1990 | 173 | 0.160481 | 0.060024 – 0.305261 | 0.163469 |
| 1989 | 172 | 0.169751 | 0.061860 – 0.308218 | 0.169751 |
| 1988 | 172 | 0.175486 | 0.061863 – 0.314271 | 0.175486 |
| 1987 | 172 | 0.174084 | 0.061874 – 0.317665 | 0.174084 |
| 1986 | 172 | 0.171988 | 0.062206 – 0.323105 | 0.171988 |
| 1985 | 172 | 0.173221 | 0.062535 – 0.328014 | 0.173221 |
| 1984 | 172 | 0.172840 | 0.064197 – 0.334239 | 0.172840 |
| 1983 | 172 | 0.176731 | 0.068799 – 0.335121 | 0.176731 |
| 1982 | 172 | 0.181115 | 0.070958 – 0.348161 | 0.181115 |
| 1981 | 172 | 0.184954 | 0.075313 – 0.356002 | 0.184954 |
| 1980 | 172 | 0.187801 | 0.075956 – 0.359638 | 0.187801 |
| 1979 | 172 | 0.192083 | 0.077424 – 0.371779 | 0.192083 |
| 1978 | 172 | 0.200192 | 0.079507 – 0.375033 | 0.200192 |
| 1977 | 172 | 0.199696 | 0.085670 – 0.375867 | 0.199696 |
| 1976 | 172 | 0.198937 | 0.087476 – 0.382388 | 0.198937 |
| 1975 | 172 | 0.198254 | 0.088828 – 0.387053 | 0.198254 |
| 1974 | 172 | 0.208247 | 0.088428 – 0.395288 | 0.208247 |
| 1973 | 172 | 0.209376 | 0.088654 – 0.399943 | 0.209376 |
| 1972 | 172 | 0.215836 | 0.088216 – 0.405655 | 0.215836 |
| 1971 | 172 | 0.211200 | 0.091649 – 0.411809 | 0.211200 |
| 1970 | 172 | 0.233317 | 0.091995 – 0.409025 | 0.233317 |
| 1969 | 172 | 0.226230 | 0.087216 – 0.418770 | 0.226230 |
| 1968 | 172 | 0.230357 | 0.089569 – 0.433476 | 0.230357 |
| 1967 | 172 | 0.232758 | 0.094658 – 0.449401 | 0.232758 |
| 1966 | 172 | 0.236432 | 0.095323 – 0.459776 | 0.236432 |
| 1965 | 172 | 0.239144 | 0.099655 – 0.479299 | 0.239144 |
| 1964 | 172 | 0.242063 | 0.101434 – 0.487670 | 0.242063 |
| 1963 | 172 | 0.245536 | 0.097336 – 0.491996 | 0.245536 |
| 1962 | 172 | 0.245810 | 0.101064 – 0.495749 | 0.245810 |
| 1961 | 172 | 0.243860 | 0.101784 – 0.509659 | 0.243860 |
062022 → 2023
Who rose and fell
The biggest changes in value between the two newest editions — reference years recalculated in one report, not two separate publications. Places are shown second, because they also move when other countries do.
Rose most
before → afterFell most
before → after- Argentina0.949152 → 0.886885 · 4th → 4th−0.062267
- Australia1.201635 → 1.162407 · 2nd → 2nd−0.039228
- Canada0.984490 → 0.952606 · 3rd → 3rd−0.031884
- Niger0.699274 → 0.676609 · 10th → 10th−0.022665
- Kazakhstan1.480922 → 1.459397 · 1st → 1st−0.021525
206 countries were measured in both 2022 and 2023.
07Across every edition
Arable land per person in records
The extremes of the statistic. A record reached by more than one country names none of them.
Highest reading on record
3.186941
Arable land (hectares per person)
Lowest reading on record
0.000095
Arable land (hectares per person)
Biggest rise between editions
+0.257165
1.161585 → 1.418750
Biggest fall between editions
−0.352477
0.822395 → 0.469918
Biggest change since first measured
+0.303224
0.363185 → 0.666409
Highest most often
32 of 63
editions, alone at the first-listed end
08The measure
About arable land per person
Arable land per person is how many hectares of cropland a country has for each of its people. It says what a country has to work with, not how well it works with it — cereal yield is the measure that answers that.
What the number is: Arable land (hectares per person).
09Where it fits
Connections
Its part in the Country Index, the statistics whose values line up most closely with it across countries, and others on the same subject.
In the Country Index
Context, with no vote
This statistic is published in full under Environment & Sustainability and Food & Agriculture, but does not help decide any Country Index standing.
Environment & SustainabilityFood & AgricultureWhich statistics vote, and why
Moves with
Where arable land per person is higher, these tend to be higher too.
- Land Under Cereal ProductionFAO · 180 countries in commonρ 0.59
- Land AreaFAO · 205 countries in commonρ 0.58
- Pupils per Qualified Teacher, PrimaryUIS · 86 countries in commonρ 0.56
Moves against
Where arable land per person is higher, these tend to be lower.
- Cereal Import Dependency RatioFAO · 160 countries in commonρ −0.70
- Population DensityUN DESA Population Division · 206 countries in commonρ −0.51
- Livestock DensityFAO · 185 countries in commonρ −0.51
Rank correlation (ρ, from −1 to 1) across countries, on each statistic’s newest edition, out of 384 statistics sharing at least 80 countries with this one. Two statistics that move together do not cause each other.
10Keep reading
Explore further
The countries at either end
11Questions
Arable land per person: questions and answers
Which country has the highest arable land per person?
Kazakhstan, at 1.459397, among the 206 countries compared in 2023.
Which country has the lowest arable land per person?
Singapore, at 0.000095, among the 206 countries compared in 2023.
How many countries does the Arable Land per Person cover?
206 in 2023. The number measured varies from 172 to 206 between editions.
What is the world average arable land per person?
This site does not calculate a world average, which would depend on how countries are weighted. In the middle country of the 206 compared in 2023, the figure was 0.108619.
Is this Food and Agriculture Organization of the United Nations (FAO)’s own ranking?
No. Food and Agriculture Organization of the United Nations (FAO) publishes the values but ranks nobody; the position on this page is derived by Nations Inquiry by ordering the published values, and equal values share a position.
How often is the Arable Land per Person published?
This site holds 63 reference years, 1961–2023, all recalculated in Food and Agriculture Organization of the United Nations (FAO)’s 2026 report on one method — not 63 separate publications.
Where does the data come from, and can I download it?
From Food and Agriculture Organization of the United Nations (FAO), under CC BY 4.0. From FAOSTAT via the World Bank’s indicator API (AG.LND.ARBL.HA.PC), stored to two decimals because most countries sit below one hectare a head and a single decimal would collapse half the table onto one number. Every edition is on this site’s Datasets pages as a full table, and downloads as a CSV file with every value unrounded.
12Method
Sources, method and citation
Source
Arable Land per Person — Food and Agriculture Organization of the United Nations (FAO)
From FAOSTAT via the World Bank’s indicator API (AG.LND.ARBL.HA.PC), stored to two decimals because most countries sit below one hectare a head and a single decimal would collapse half the table onto one number.
Newest edition
Report year 2023Data year 2023
Cite the source as: Food and Agriculture Organization of the United Nations. FAOSTAT. Rome: FAO.
Licence: CC BY 4.0, checked 2026-09-06.
How this page reads the numbers
- Food and Agriculture Organization of the United Nations (FAO) ranks nobody on this measure. The position is derived by Nations Inquiry by ordering the published values; equal values share a position.
- This statistic has no better end, so the page describes higher and lower values and never calls a country a leader.
- A country is named at an end only when it holds that value alone. Where several share it, the page says how many and names none first.
- Values are stored exactly as published and trimmed only for display. “The middle country” is the median of the countries measured, not a world average.
The file itself, column by column — where it came from, what each column holds, and every edition as a CSV — is on its dataset page.
Cite this page
Nations Inquiry (2026). Arable land per person by country: Arable Land per Person, data from Food and Agriculture Organization of the United Nations (FAO). https://nationsinquiry.com/statistics/arable-land-per-person