Loading…
UN DESA Population Division · Population Density
Population density by country
How many people live on each square kilometre of land?
Of the 222 countries compared in 2023, Monaco had the highest reading, 26,145.302, and Greenland had the lowest reading, 0.136. In the middle country the figure was 96.919. Among the 222 countries measured in every edition since 1950, the middle one moved from 28.842 to 96.919.
Part ofPeople & Population
Population density · 2023
Context statistic

Highest of 222Monaco
26,145.302012023 · values only
The highest and the lowest
The three countries with the highest values of 222 compared, the three with the lowest, and the highest on each continent. This statistic has no better end, so no country is shown as leading.
- 1
- 2

- 3

02Every measured country
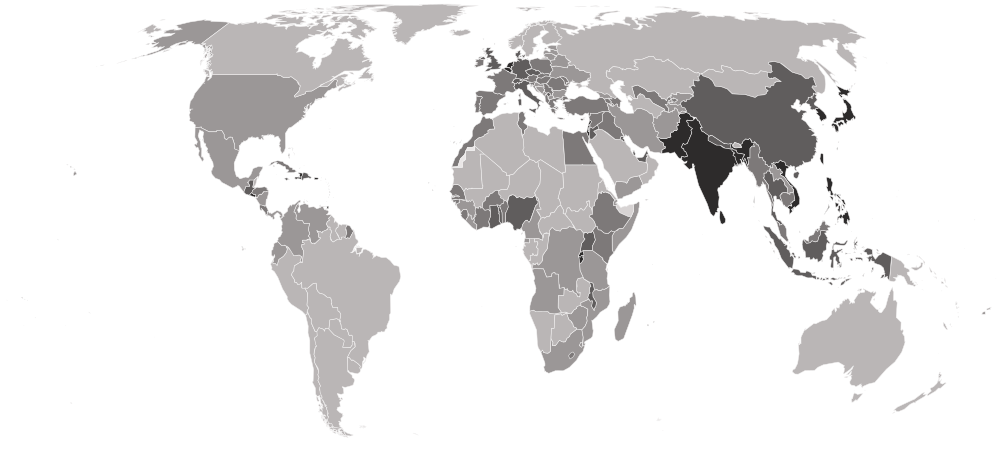
Population density on a map
Each country is shaded by its value, in five groups holding the same number of countries. Hover a country for its value, or select it to open its profile. Below the map, each continent’s middle country.
Darker is a higher value. This statistic has no better end, so the shades describe size, not success.
- 0.136–28.647
- 29.264–75.206
- 76.011–128.692
- 128.829–282.948
- 291.046–26,145.302
- No reading in 2023
- Asia
140.348
the middle country, of 51 measured · 52 members
Macau22,309.734 Mongolia2.204
Highest and lowest reading in Asia.
- Europe
106.096
the middle country, of 48 measured · 49 members
Monaco26,145.302 Iceland3.866
Highest and lowest reading in Europe.
- Americas
98.792
the middle country, of 48 measured · 48 members
 Sint Maarten1,257.324
 Greenland0.136
Highest and lowest reading in Americas.
- Oceania
76.308
the middle country, of 21 measured · 21 members
 Nauru593.750
 Australia3.443
Highest and lowest reading in Oceania.
- Africa
68.368
the middle country, of 54 measured · 55 members
 Mauritius627.383
 Namibia3.599
Highest and lowest reading in Africa.
- Every region
22 sub-regions, highest middle country first
- Eastern Asia
426.533
the middle country, of 8 measured · 8 members
Macau22,309.734Mongolia2.204Highest and lowest reading in Eastern Asia.
- Southern Asia
321.068
the middle country, of 9 measured · 9 members
 Maldives1,753.313
 Bhutan20.482
Highest and lowest reading in Southern Asia.
- Caribbean
261.008
the middle country, of 24 measured · 24 members
Sint Maarten1,257.324 Montserrat42.918
Highest and lowest reading in Caribbean.
- Western Europe
247.488
the middle country, of 9 measured · 9 members
Monaco26,145.302 Austria110.646
Highest and lowest reading in Western Europe.
- Micronesia
182.549
the middle country, of 7 measured · 7 members
Nauru593.750 Palau38.538
Highest and lowest reading in Micronesia.
- Western Asia
128.631
the middle country, of 18 measured · 19 members
 Bahrain2,004.681
 Saudi Arabia15.474
Highest and lowest reading in Western Asia.
- South-eastern Asia
106.913
the middle country, of 11 measured · 11 members
Singapore8,475.973 Laos33.211
Highest and lowest reading in South-eastern Asia.
- Southern Europe
105.194
the middle country, of 17 measured · 17 members
 Gibraltar3,847.050
 Montenegro45.870
Highest and lowest reading in Southern Europe.
- Western Africa
95.950
the middle country, of 16 measured · 16 members
 Gambia266.586
 Mauritania4.873
Highest and lowest reading in Western Africa.
- Eastern Europe
88.186
the middle country, of 10 measured · 10 members
 Czechia140.017
 Russia8.882
Highest and lowest reading in Eastern Europe.
- Eastern Africa
85.249
the middle country, of 18 measured · 19 members
Mauritius627.383 South Sudan20.355
Highest and lowest reading in Eastern Africa.
- Central America
81.906
the middle country, of 8 measured · 8 members
 El Salvador304.519
 Belize18.023
Highest and lowest reading in Central America.
- Polynesia
76.559
the middle country, of 7 measured · 7 members
 Tuvalu327.183
 Niue6.990
Highest and lowest reading in Polynesia.
- Northern Africa
53.423
the middle country, of 6 measured · 6 members
 Egypt115.059
 Libya4.359
Highest and lowest reading in Northern Africa.
- Southern Africa
51.779
the middle country, of 5 measured · 5 members
 Lesotho76.135Namibia3.599
Highest and lowest reading in Southern Africa.
- Central Asia
36.880
the middle country, of 5 measured · 5 members
 Uzbekistan83.809
 Kazakhstan7.531
Highest and lowest reading in Central Asia.
- Northern Europe
35.479
the middle country, of 12 measured · 13 members
 United Kingdom282.948Iceland3.866
Highest and lowest reading in Northern Europe.
- Middle Africa
29.478
the middle country, of 9 measured · 9 members
 São Tomé and Príncipe240.491
 Central African Republic8.271
Highest and lowest reading in Middle Africa.
- Melanesia
26.285
the middle country, of 5 measured · 5 members
 Fiji50.583
 New Caledonia15.857
Highest and lowest reading in Melanesia.
- South America
22.412
the middle country, of 12 measured · 12 members
 Ecuador72.395
 Suriname4.031
Highest and lowest reading in South America.
- Australia and New Zealand
2 of 2 measured — too few for a middle: Australia, New Zealand.
 New Zealand19.527Australia3.443
Highest and lowest reading in Australia and New Zealand.
- Northern America
4 of 4 measured — too few for a middle: Bermuda, Canada, Greenland, United States.
 Bermuda1,198.111Greenland0.136
Highest and lowest reading in Northern America.
03The whole field at once
The spread
222 countries, one dot each, on one scale — further right is a higher value. Half the countries are above 96.919; a quarter are above 244.525, and a quarter below 42.374. The bar in each row marks that continent’s middle country.
Log scale: each gridline is ten times the one before, so countries of very different sizes can be seen on one line.
04All 222 ever measured
Every country
In order, highest value first. No rank or position is shown: too many countries share the same value for an order to mean anything. Neither end is better, and the top of this table is dominated by city-states and small territories, where the whole country is one city. A national average also hides where people live: a country that is mostly desert or ice can have crowded cities and still read as nearly empty.
Showing 25 of 222 countries














































































































































































Values for 2023. The change column compares 2023 with 2022 only; the sparkline covers the recent editions.
051950–2023 · 74 reference years
Over time
Each point is one year's estimate, 1950 to 2023, as restated by the 2024 revision. Because the land area barely changes, the line has the same shape as the population's: it rises with births and immigration and falls with emigration.
- the middle country
- the middle half of countries
- the middle of the 222 countries measured every time
- each continent’s middle country
The same, year by year
| Year | Countries | Middle country | Middle half | Measured every time |
|---|---|---|---|---|
| 2023 | 222 | 96.919 | 42.374 – 244.525 | 96.919 |
| 2022 | 222 | 95.395 | 41.530 – 244.187 | 95.395 |
| 2021 | 222 | 94.051 | 40.450 – 242.254 | 94.051 |
| 2020 | 222 | 93.058 | 39.394 – 240.831 | 93.058 |
| 2019 | 222 | 92.795 | 38.888 – 239.656 | 92.795 |
| 2018 | 222 | 92.117 | 38.761 – 236.535 | 92.117 |
| 2017 | 222 | 91.754 | 38.321 – 231.158 | 91.754 |
| 2016 | 222 | 92.837 | 37.210 – 224.625 | 92.837 |
| 2015 | 222 | 93.231 | 36.114 – 218.860 | 93.231 |
| 2014 | 222 | 93.183 | 35.673 – 213.796 | 93.183 |
| 2013 | 222 | 90.922 | 35.102 – 209.314 | 90.922 |
| 2012 | 222 | 88.950 | 34.681 – 204.878 | 88.950 |
| 2011 | 222 | 88.457 | 34.405 – 203.028 | 88.457 |
| 2010 | 222 | 86.814 | 34.135 – 201.430 | 86.814 |
| 2009 | 222 | 84.661 | 34.086 – 198.883 | 84.661 |
| 2008 | 222 | 83.518 | 33.873 – 196.388 | 83.518 |
| 2007 | 222 | 81.706 | 33.555 – 193.962 | 81.706 |
| 2006 | 222 | 80.556 | 32.977 – 191.766 | 80.556 |
| 2005 | 222 | 78.502 | 32.479 – 189.671 | 78.502 |
| 2004 | 222 | 76.991 | 31.988 – 187.296 | 76.991 |
| 2003 | 222 | 76.082 | 31.559 – 183.105 | 76.082 |
| 2002 | 222 | 74.974 | 31.281 – 180.754 | 74.974 |
| 2001 | 222 | 74.068 | 30.980 – 179.378 | 74.068 |
| 2000 | 222 | 73.613 | 30.485 – 176.772 | 73.613 |
| 1999 | 222 | 73.137 | 29.586 – 174.028 | 73.137 |
| 1998 | 222 | 72.624 | 28.168 – 175.481 | 72.624 |
| 1997 | 222 | 72.961 | 26.430 – 173.017 | 72.961 |
| 1996 | 222 | 74.109 | 25.545 – 171.025 | 74.109 |
| 1995 | 222 | 73.331 | 25.003 – 169.034 | 73.331 |
| 1994 | 222 | 72.692 | 24.437 – 166.967 | 72.692 |
| 1993 | 222 | 73.103 | 23.425 – 163.235 | 73.103 |
| 1992 | 222 | 72.548 | 23.003 – 159.349 | 72.548 |
| 1991 | 222 | 70.471 | 22.525 – 155.614 | 70.471 |
| 1990 | 222 | 68.379 | 23.127 – 154.977 | 68.379 |
| 1989 | 222 | 66.306 | 22.645 – 155.803 | 66.306 |
| 1988 | 222 | 64.352 | 21.292 – 156.512 | 64.352 |
| 1987 | 222 | 62.633 | 20.986 – 154.911 | 62.633 |
| 1986 | 222 | 60.990 | 20.575 – 153.502 | 60.990 |
| 1985 | 222 | 59.498 | 19.675 – 152.274 | 59.498 |
| 1984 | 222 | 58.850 | 19.002 – 151.063 | 58.850 |
| 1983 | 222 | 56.621 | 18.498 – 150.471 | 56.621 |
| 1982 | 222 | 55.551 | 18.037 – 150.061 | 55.551 |
| 1981 | 222 | 54.553 | 18.468 – 149.713 | 54.553 |
| 1980 | 222 | 53.615 | 18.107 – 147.027 | 53.615 |
| 1979 | 222 | 52.669 | 17.256 – 145.446 | 52.669 |
| 1978 | 222 | 51.706 | 16.909 – 144.707 | 51.706 |
| 1977 | 222 | 50.773 | 16.686 – 142.183 | 50.773 |
| 1976 | 222 | 50.156 | 16.265 – 137.702 | 50.156 |
| 1975 | 222 | 49.573 | 15.971 – 135.906 | 49.573 |
| 1974 | 222 | 48.988 | 15.454 – 134.444 | 48.988 |
| 1973 | 222 | 48.236 | 15.117 – 132.814 | 48.236 |
| 1972 | 222 | 46.939 | 14.790 – 130.444 | 46.939 |
| 1971 | 222 | 45.184 | 14.474 – 128.105 | 45.184 |
| 1970 | 222 | 43.478 | 14.186 – 125.347 | 43.478 |
| 1969 | 222 | 42.121 | 13.791 – 121.242 | 42.121 |
| 1968 | 222 | 40.578 | 13.415 – 117.784 | 40.578 |
| 1967 | 222 | 39.713 | 13.062 – 115.067 | 39.713 |
| 1966 | 222 | 38.844 | 12.711 – 112.428 | 38.844 |
| 1965 | 222 | 38.005 | 12.276 – 111.461 | 38.005 |
| 1964 | 222 | 37.185 | 12.013 – 110.298 | 37.185 |
| 1963 | 222 | 36.377 | 11.794 – 105.151 | 36.377 |
| 1962 | 222 | 35.755 | 11.551 – 101.152 | 35.755 |
| 1961 | 222 | 35.179 | 11.307 – 99.165 | 35.179 |
| 1960 | 222 | 34.609 | 11.097 – 96.560 | 34.609 |
| 1959 | 222 | 34.005 | 10.873 – 95.137 | 34.005 |
| 1958 | 222 | 33.476 | 10.599 – 93.339 | 33.476 |
| 1957 | 222 | 32.968 | 10.335 – 91.308 | 32.968 |
| 1956 | 222 | 32.494 | 10.054 – 90.673 | 32.494 |
| 1955 | 222 | 31.912 | 9.785 – 88.312 | 31.912 |
| 1954 | 222 | 31.397 | 9.549 – 86.838 | 31.397 |
| 1953 | 222 | 30.844 | 9.329 – 85.364 | 30.844 |
| 1952 | 222 | 30.221 | 9.094 – 84.854 | 30.221 |
| 1951 | 222 | 29.592 | 8.874 – 84.481 | 29.592 |
| 1950 | 222 | 28.842 | 8.616 – 83.987 | 28.842 |
062022 → 2023
Who rose and fell
The biggest changes in value between the two newest editions — reference years recalculated in one report, not two separate publications. Places are shown second, because they also move when other countries do.
Rose most
before → after- Macau22,011.141 → 22,309.734+298.594
- Singapore8,272.159 → 8,475.973+203.814
- Gibraltar3,760.950 → 3,847.050+86.100
- Bahrain1,958.441 → 2,004.681+46.241
- Sint Maarten1,239.368 → 1,257.324+17.956
Fell most
before → after Saint Martin544.726 → 519.142−25.585
 Vatican City1,151.136 → 1,126.136−25.000
 Hong Kong6,793.371 → 6,772.279−21.092
 Marshall Islands222.650 → 215.706−6.944
- Tuvalu333.067 → 327.183−5.883
222 countries were measured in both 2022 and 2023.
07Across every edition
Population density in records
The extremes of the statistic. A record reached by more than one country names none of them.
Highest reading on record
26,145.302
People per square kilometre of land
Lowest reading on record
0.057
People per square kilometre of land
Biggest rise between editions
+1,360.000
5,691.719 → 7,051.719
Biggest fall between editions
−904.281
7,822.625 → 6,918.344
Biggest change since first measured
+16,164.313
6,145.422 → 22,309.734
Highest most often
74 of 74
editions, alone at the first-listed end
08The measure
About population density
Population density is the number of people living on each square kilometre of a country's land, as estimated by the United Nations. It says how crowded a country is on average — not how crowded any particular place in it is.
What the number is: People per square kilometre of land.
What it does not measure
It is a national average: it says nothing about how people are spread across the country, so crowded cities and empty land can produce the same figure.
09Where it fits
Connections
Its part in the Country Index, the statistics whose values line up most closely with it across countries, and others on the same subject.
In the Country Index
Context, with no vote
This statistic is published in full under People & Population, but does not help decide any Country Index standing.
Moves with
Where population density is higher, these tend to be higher too.
- Livestock DensityFAO · 188 countries in commonρ 0.63
Moves against
Where population density is higher, these tend to be lower.
- Land AreaFAO · 220 countries in commonρ −0.58
- Total Natural Resources Rents (% of GDP)World Bank Group · 197 countries in commonρ −0.54
- Arable Land per PersonFAO · 206 countries in commonρ −0.51
Rank correlation (ρ, from −1 to 1) across countries, on each statistic’s newest edition, out of 190 statistics sharing at least 80 countries with this one. Two statistics that move together do not cause each other.
10Keep reading
Explore further
The subject
11Questions
Population density: questions and answers
Which country has the highest population density?
Monaco, at 26,145.302, among the 222 countries compared in 2023.
Which country has the lowest population density?
Greenland, at 0.136, among the 222 countries compared in 2023.
How many countries does the Population Density cover?
222 in 2023.
What is the world average population density?
This site does not calculate a world average, which would depend on how countries are weighted. In the middle country of the 222 compared in 2023, the figure was 96.919.
Is this UN DESA Population Division’s own ranking?
No ranking is shown. UN DESA Population Division publishes values only, and too many countries share the same value for an ordering to mean anything, so none is derived.
How often is the Population Density published?
This site holds 74 reference years, 1950–2023, all recalculated in UN DESA Population Division’s 2024 report on one method — not 74 separate publications.
Where does the data come from, and can I download it?
From UN DESA Population Division, under CC BY 3.0 IGO. From World Population Prospects 2024, read from the Population Division's own CSV download. The figure is the UN's own; it is not recomputed here from population and land area. Projections are excluded. Every edition is on this site’s Datasets pages as a full table, and downloads as a CSV file with every value unrounded.
12Method
Sources, method and citation
Source
Population Density — UN DESA Population Division
From World Population Prospects 2024, read from the Population Division's own CSV download. The figure is the UN's own; it is not recomputed here from population and land area. Projections are excluded.
Newest edition
Report year 2023Data year 2023
Cite the source as: United Nations, Department of Economic and Social Affairs, Population Division. World Population Prospects 2024. New York: United Nations.
Licence: CC BY 3.0 IGO, checked 2026-09-26.
How this page reads the numbers
- No rank or position is shown: UN DESA Population Division publishes values only, and too many countries share the same value for an ordering to mean anything.
- This statistic has no better end, so the page describes higher and lower values and never calls a country a leader.
- A country is named at an end only when it holds that value alone. Where several share it, the page says how many and names none first.
- Values are stored exactly as published and trimmed only for display. “The middle country” is the median of the countries measured, not a world average.
The file itself, column by column — where it came from, what each column holds, and every edition as a CSV — is on its dataset page.
Cite this page
Nations Inquiry (2026). Population density by country: Population Density, data from UN DESA Population Division. https://nationsinquiry.com/statistics/population-density