
Photo: Mtmelendez · CC BY-SA 3.0 · via Wikimedia Commons, shown in greyscale
Curaçao places highest on Old-Age Pension Coverage (top 15% worldwide) and lowest on Municipal Solid Waste Generation (bottom 4%).
Share
Curaçao in the Nations Inquiry Country Index
Curaçao appears in 71 of the statistics tracked here, but is not placed in the Country Index: the index needs a standing on three quarters of its topics, and Curaçao is measured on too few of them. Every published reading below is unaffected.
At a glance
Population
185,427
people
since 1950
Land area
444
km²
since 2011
GDP per person
28,762
international $, PPP
since 2000
Life expectancy
76.8
years at birth
since 1950
The newest published figure for each, the year it describes and who published it, with a line showing how it has moved.
01The country
About Curaçao
Curaçao, a self-governing country within the Dutch kingdom since 2010, lies off the coast of Venezuela, south of the usual hurricane track. Flamingos feed in its salt pans, and Christoffelberg rises in the north-west. Waves boom into the limestone inlets of Shete Boka in the north, while the south is cut by sheltered bays. The harbour channel of Sint Annabaai, lined with gabled merchant houses, is crossed by a pontoon bridge that swings aside for ships.
Arawak-speaking Caquetío lived here when Alonso de Ojeda arrived in 1499; Spain later deported most of them to Hispaniola. The Dutch West India Company seized the island in 1634 and made it a depot of its slave trade. Sephardic Jews from Amsterdam and Brazil settled from the 1650s, and their synagogue, consecrated in 1732, keeps a floor of sand. Tula led a revolt of the enslaved in August 1795; slavery ended in 1863. From 1918 Shell refined Venezuelan crude beside the Schottegat.
Tambú, African-rooted drum music and dance once restricted by colonial rulers, and the harvest procession of Seú keep the traditions of the enslaved alive. Keshi yena, a hollowed Edam cheese baked with spiced meat, recalls the trading era, and the island’s namesake liqueur is made from the dried peel of the bitter laraha orange. A local team won the Little League World Series in 2004. The deep harbour, with its dry dock and oil terminals, financial services and tourism keep the economy afloat.
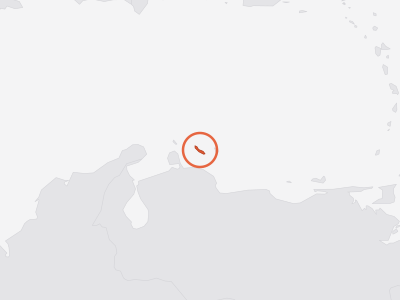
Key facts about Curaçao
- Capital
- Willemstad
- Official languages
- Dutch, English, Papiamento
- Currency
- Caribbean guilder (XCG)
- ISO code
- CUW · CW
- Domain · dialling
- .cw · +5999
As Wikidata records them. Official languages are the least consistent — some countries list only a national language, others every regional one. Sources and licences.
02Country Index 2026
Where it stands, topic by topic
Strongest first. Each position is Curaçao’s place among the countries with a standing on that topic, built from a few key statistics chosen to measure different things.
128thof 198
From 3 of 4 key statistics
166thof 177
From 2 of 4 key statistics
No standing — Curaçao holds too few of this subject’s key statistics to be placed on it.
No standing — Curaçao holds too few of this subject’s key statistics to be placed on it.
No standing — Curaçao holds too few of this subject’s key statistics to be placed on it.
No standing — Curaçao holds too few of this subject’s key statistics to be placed on it.
No standing — Curaçao holds too few of this subject’s key statistics to be placed on it.
No standing — Curaçao holds too few of this subject’s key statistics to be placed on it.
No standing — Curaçao holds too few of this subject’s key statistics to be placed on it.
No standing — Curaçao holds too few of this subject’s key statistics to be placed on it.
No standing — Curaçao holds too few of this subject’s key statistics to be placed on it.
No standing — Curaçao holds too few of this subject’s key statistics to be placed on it.
No standing — Curaçao holds too few of this subject’s key statistics to be placed on it.
No standing — Curaçao holds too few of this subject’s key statistics to be placed on it.
No standing — Curaçao holds too few of this subject’s key statistics to be placed on it.
No standing — Curaçao holds too few of this subject’s key statistics to be placed on it.
Each standing is built from a few key statistics chosen to measure different things. Select a subject for Curaçao’s readings on it, or see every statistic held for Curaçao in the table further down this page.
03Highs and lows
Where Curaçao stands out
The two ends of its own record: every statistic on which Curaçao sits within ten places of the best or worst in the world, plus its strongest and weakest readings overall. Each is turned into a percentile — its place among every country measured — which is what lets a hunger score and a press-freedom rank be compared at all.
Where Curaçao does best5
In the top third of all countries measured.
- Productive Capacities Indextop 18%
Position · derived 35th of 195 · 59.23 · 2022
world median 46.67 (better) · ▲ 3 pts since 2012
Position · derived 24th of 123 · 5.301 · 2023
world median 3.709 (better) · ▲ 11 pts since 2013
- Access to Electricitytop 28%
Not ranked by the publisher · 100 · 2024
world median 100 · ▼ 8 pts since 2014
Where Curaçao struggles most5
In the bottom third of all countries measured. 2 are within ten places of the worst in the world, in a field of at least 50 countries — marked with that place.
- 6thOut-of-School Rate, Primarybottom 4%
Position · derived 6th of 121 · 1 = worst · 27.89 · 2024
world median 3.691 (worse) · ▼ 82 pts since 2020
- 8thMunicipal Solid Waste Generationbottom 4%
Position · derived 8th of 201 · 1 = worst · 3.148 · 2026
world median 0.966 (worse)
- Container Import Dwell Timebottom 8%
Position · derived 13th of 156 · 1 = worst · 10.1 · 2024
world median 4.4 (worse) · ▼ 21 pts since 2023
- CO₂ Emissions per Capitabottom 8%
Position · derived 18th of 210 · 1 = worst · 12.34 · 2024
world median 3.21 (worse) · ▲ 8 pts since 2014
- Out-of-School Rate, Lower Secondary Agebottom 19%
Position · derived 23rd of 116 · 1 = worst · 23.14 · 2024
world median 6.343 (worse) · ▼ 64 pts since 2020
A band is a place among the countries each publisher scores, so Curaçao can move because other countries moved. See the Country Index for the full method.
04In context
Curaçao and its neighbours
A position reads best beside the countries around it. Every position below is a place in the world ranking, not within the region.
Shares a land border with
Curaçao has no land border with another country.
Across Caribbean
Every country in the sub-region, by its position in the world.
- 67
 Barbados
- 68
 Saint Lucia
- =71
 Dominican Republic
- =71
 Saint Vincent and the Grenadines
- =76
 Jamaica
- 81
 Antigua and Barbuda
- 85
 Grenada
- 90
 Trinidad and Tobago
- =104
 Bahamas
- 119
 Cuba
- 173
 Haiti
- —
 Anguillanot placed
- —
 Arubanot placed
- —
 British Virgin Islandsnot placed
- —
 Cayman Islandsnot placed
- —
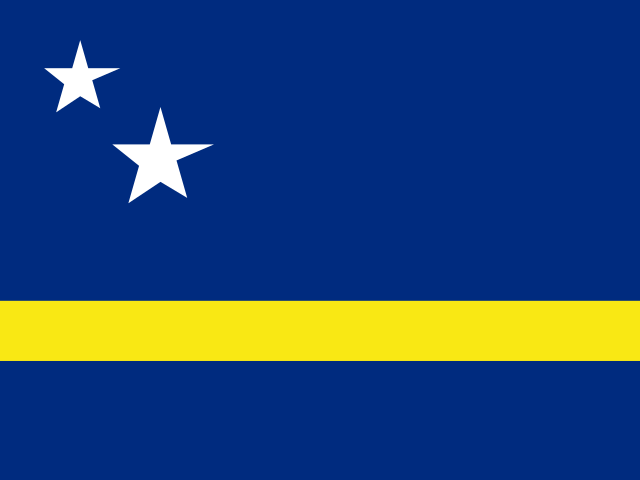 Curaçaonot placed
- —
 Dominicanot placed
- —
 Montserratnot placed
- —
 Puerto Riconot placed
- —
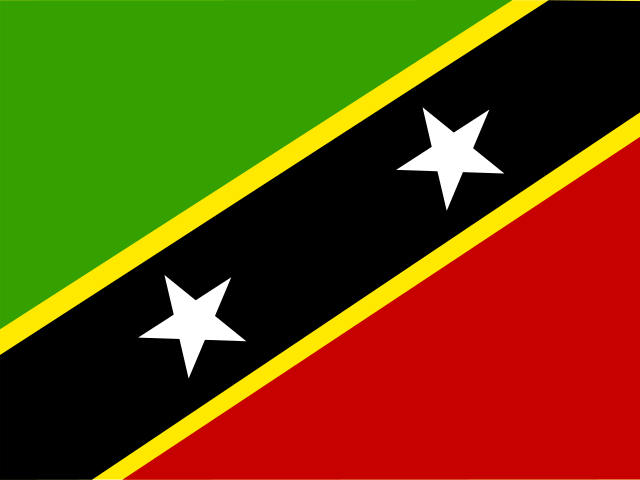 Saint Kitts and Nevisnot placed
- —
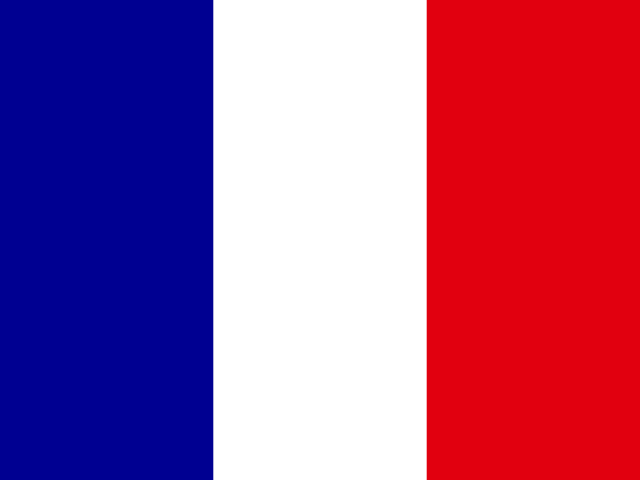 Saint Martinnot placed
- —
 Sint Maartennot placed
- —
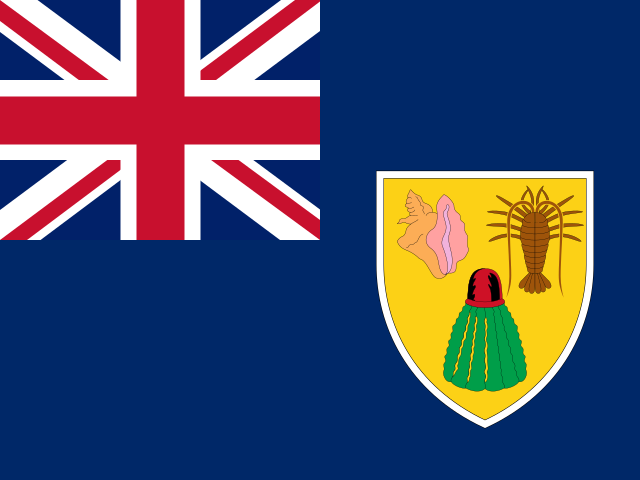 Turks and Caicos Islandsnot placed
- —
 United States Virgin Islandsnot placed
05The evidence
Every statistic we hold for Curaçao
Grouped by topic. Each row gives the newest edition’s rank or position, the published value and the year the numbers describe. Select a statistic for this country’s row beside every other country, the world median and every edition.
Governance & Institutions4
- Government Spending on EducationUIS · Government expenditure on education (% of GDP)24th of 123position · derived5.3012023
- Old-Age Pension CoverageILO · People above statutory pensionable age receiving an old-age pension (%)top 15%1002025
- Trade Union DensityILO · Employees who are trade union members (%)46th of 139position · derived23.492020
Economy & Innovation15
- Actual Individual Consumption per Capita (PPP)World Bank Group · Actual individual consumption per capita (PPP, current international $)77th of 173position · derived15,5162021
- Container Port TrafficUNCTAD · Container port traffic (TEU, twenty-foot equivalent units)96th of 103position · derived98,1002024
- Digitally-Deliverable Services ExportsUNCTAD · Digitally-deliverable services exports (% of services exports)101st of 170position · derived19.42024
- Export Concentration IndexUNCTAD · Export concentration index (0–1, normalised Herfindahl–Hirschman)bottom 27%0.1932025
- Foreign Direct Investment InflowsUNCTAD · FDI inflows (% of GDP)top 20%4.8052025
- ICT Services ExportsUNCTAD · ICT services exports (% of services exports)83rd of 118position · derived3.4072024
- Liner Shipping Connectivity IndexUNCTAD · LSCI (index, average Q1 2023 = 100)133rd of 175rank23.612026
- Merchant Fleet by Country of OwnershipUNCTAD · Merchant fleet owned (thousand dead-weight tons)bottom 14%3.3982026
- Price Level of Household ConsumptionGGDC · Price level of household consumption (US output price level in 2021 = 1)top 17%0.8642023
- Productive Capacities IndexUNCTAD · Productive Capacities Index (1–100)35th of 195position · derived59.232022
- Scholarly ArticlesOurResearch · Articles with at least one author at an institution in the country (full counting)bottom 20%1402025
- Services ExportsUNCTAD · Services exports (% of GDP)top 6%55.432025
- Statutory Corporate Income Tax RateOECD · Combined statutory corporate income tax rate, central and sub-central government (%)bottom 19%152026
- Terms of Trade IndexUNCTAD · Terms of trade index (2015 = 100)top 14%137.992025
- Total Natural Resources Rents (% of GDP)World Bank Group · Natural resources rents (% of GDP)180th of 180position · derived02021
Work & Labour2
- Employment Injury Protection CoverageILO · Labour force covered in the event of a work injury (%)top 43%60.42024
- Unemployment Benefit CoverageILO · Unemployed people receiving unemployment benefits (%)bottom 26%02024
Education & Knowledge5
- Out-of-School Rate, Lower Secondary AgeUIS · Out-of-school rate, lower secondary age (%)23rd of 116position · derived · 1 = worst23.142024
- Out-of-School Rate, PrimaryUIS · Out-of-school rate, primary age (%)6th of 121position · derived · 1 = worst27.892024
- Participation in Organised Learning One Year Before PrimaryUIS · Children one year before primary entry age in organised learning (%)74th of 112position · derived77.652024
- Pre-Primary Net Enrolment RateUIS · Net enrolment rate, pre-primary (%)63rd of 120position · derived65.032024
- Secondary School EnrolmentUIS · Gross secondary enrolment ratio (%)71st of 109position · derived89.912024
Health & Wellbeing9
- Adolescent Birth Rate (Ages 15–19)UN DESA Population Division · Live births per 1,000 women aged 15–19151st of 222position · derived · 1 = worst12.952023
- Adult Mortality (Probability of Dying Between 15 and 60)UN DESA Population Division · Deaths before age 60 per 1,000 people alive at 15, at that year's death rates149th of 222position · derived · 1 = worst92.712023
- Contraceptive Prevalence (Any Method)UN DESA Population Division · Share of all women aged 15–49 using any contraceptive method (%)bottom 43%38.12023
- Days Above 35°CECMWF · Days a year with a maximum temperature above 35°C, averaged over the country’s landtop 16%02025
- Demand for Family Planning Satisfied by Modern MethodsUN DESA Population Division · Share of women aged 15–49 wanting to avoid pregnancy who use a modern method (%)110th of 196position · derived66.72023
- Life Expectancy at Age 65UN DESA Population Division · Further years a 65-year-old would live at current death rates99th of 222position · derived16.862023
- Life Expectancy at BirthUN DESA Population Division · Years a newborn would live at current death rates86th of 222position · derived76.82023
- Modern Contraceptive PrevalenceUN DESA Population Division · Share of all women aged 15–49 using a modern contraceptive method (%)top 50%35.42023
- PM2.5 Air Pollution ExposureAtmospheric Composition Analysis Group, Washington University in St. Louis · Population-weighted PM2.5 concentration (µg/m³)120th of 220position · derived · 1 = worst13.32023
Development & Human Capital2
- Access to ElectricityWorld Bank Group · Population with electricity access (%)top 28%1002024
- Access to Electricity, RuralWorld Bank Group · Rural population with electricity access (%)top 29%1002024
Environment & Sustainability8
- CO₂ Emissions per CapitaGlobal Carbon Project · Fossil CO₂ (tonnes per person)18th of 210position · derived · 1 = worst12.342024
- Fisheries and Aquaculture ProductionFAO · Fish, crustaceans, molluscs and other aquatic animals caught or farmed, tonnes (live weight)bottom 17%2,4512024
- Forest AreaFAO · Forest area (% of land area)204th of 210position · derived0.1582023
- Mangrove AreaGlobal Mangrove Watch (Aberystwyth University, JAXA, soloEO, Wetlands International, The Nature Conservancy) · Mangrove forest area (hectares)bottom 17%110.592025
- Municipal Solid Waste GenerationWorld Bank Group · Municipal solid waste generated (kg per person per day)8th of 201position · derived · 1 = worst3.1482026
- Operating Wind Power CapacityGlobal Energy Monitor · Wind farm capacity in operation (megawatts)bottom 46%69.52026
- Population Living Below 5 m ElevationCenter for International Earth Science Information Network (CIESIN), Columbia University · Population living below 5 m elevation (% of total population)bottom 36%1.682015
- Tree Cover LossWorld Resources Institute — Global Forest Watch (data: University of Maryland) · Tree cover loss (hectares, where canopy cover exceeded 30% in 2000)bottom 21%6.9982025
Gender & Equality1
- Sex Ratio at BirthUN DESA Population Division · Male births per 100 female birthsbottom 40%104.72023
Peace & Security1
- Refugees by Country of OriginUNHCR, the UN Refugee Agency · Refugees under UNHCR's mandate from this country, end of year (people)bottom 9%82025
Risk & Resilience2
- Asylum-Seekers by Country of AsylumUNHCR, the UN Refugee Agency · Asylum-seekers awaiting a decision, end of year (people)bottom 5%02025
- Refugee Population by Country of AsylumUNHCR, the UN Refugee Agency · Refugees under UNHCR's mandate hosted, end of year (people)bottom 3%02025
Mobility & Trade5
- Container Import Dwell TimeWorld Bank Group · Median days a full import container waits in port13th of 156position · derived · 1 = worst10.12024
- EmigrantsUN DESA Population Division · Migrants from the country living abroad, mid-year (people)bottom 14%10,1032024
- International MigrantsUN DESA Population Division · International migrants living in the country, mid-year (people)bottom 35%80,0202024
- Net Migration RateUN DESA Population Division · Net migrants per 1,000 populationtop 24%2.7942023
Energy1
- Photovoltaic Power Potential (PVOUT)World Bank Group (ESMAP), data by Solargis · Practical solar power potential (kWh per kWp per day, long-term average)top 15%4.8332020
Digital & Technology3
- GitHub DevelopersGitHub · Developer accounts located in the economy (as of quarter end)bottom 19%5,0442026
- GitHub Git PushesGitHub · Git pushes during the quarterbottom 7%5,5512025
- GitHub RepositoriesGitHub · Public repositories located in the economy (as of quarter end)bottom 19%6,8872026
People & Population13
- Crude Birth RateUN DESA Population Division · Births per 1,000 populationbottom 7%7.5192023
- Crude Death RateUN DESA Population Division · Deaths per 1,000 populationtop 19%9.9422023
- Mean Age at ChildbearingUN DESA Population Division · Mean age of mothers at the birth of their children (years)top 31%29.972023
- Median Age of the PopulationUN DESA Population Division · Median age (years)top 28%38.232023
- Population Aged 65 and OverUN DESA Population Division · Share of the total population aged 65 and over (%)top 25%16.282023
- Population DensityUN DESA Population Division · People per square kilometre of landtop 12%437.332023
- Population Growth RateUN DESA Population Division · Population growth (% per year)bottom 25%0.0362023
- Population Living in Cities (Degree of Urbanisation)UN DESA Population Division · Share of the population living in cities as the Degree of Urbanisation defines them (%)top 16%59.592025
- Population Under Age 15UN DESA Population Division · Share of the total population aged 0–14 (%)bottom 17%15.242023
- Sex Ratio of the Total PopulationUN DESA Population Division · Males per 100 femalesbottom 9%90.712023
- Total Dependency RatioUN DESA Population Division · People aged 0–14 and 65+ per 100 people aged 15–64bottom 20%46.042023
- Total Fertility RateUN DESA Population Division · Live births per womanbottom 5%1.0732023
06Method
Sources and how to read them
How to read this page
- The scores and ranks belong to their publishers. Nothing is adjusted, rescaled or re-ranked; each is reproduced from the edition named beside it. Where a row says position · derived, the publisher ranks nobody on that measure and the position is ours, made by ordering the published score.
- Each statistic shows its newest edition, which is not always the edition the Country Index uses: the index pins every source to one data year so its average compares like with like.
How a standing is built from percentiles, why Curaçao can move because other countries moved, and why publishers measure between 120 and 215 countries each are set out in full in how a standing is made and what a standing cannot tell you.
Sources
- Statistics: 19 publishers, each named beside its numbers, with every edition and licence on the datasets pages.
- Capital, languages, currency, codes: Wikidata, public domain (CC0).
- Map and land borders: Natural Earth, public domain. Borders are de facto — where administration actually changes — not claimed.
Photographs
The photograph of Curaçao on this page comes from Wikimedia Commons and is shown in greyscale. The photographer and the licence are named beside each one.
Cite this page
Nations Inquiry (2026). Curaçao: country statistics, rankings and trends. https://nationsinquiry.com/countries/curacao