Global Energy Monitor · Operating Wind Power Capacity
Wind power capacity by country
How much wind farm capacity does a country operate, and how much more is being built or planned?
Of the 157 countries compared in 2026, China had the highest reading, 542,758.4, and 53 countries shared the lowest reading, 0.0. In the middle country the figure was 100.0.
Share
Wind power capacity · 2026
Context statistic

Highest of 157China
542,758.4012026 · values only
The highest and the lowest
The three countries with the highest values of 157 compared, the three with the lowest, and the highest on each continent. This statistic has no better end, so no country is shown as leading.
- 1
- 2

- 3




Highest on each continent
- Africa
 South Africa4,263.0
 - AmericasUnited States157,593.9
- AsiaChina542,758.4
- EuropeGermany50,536.2
- Oceania
 Australia14,252.0
 - Every region
02Every measured country
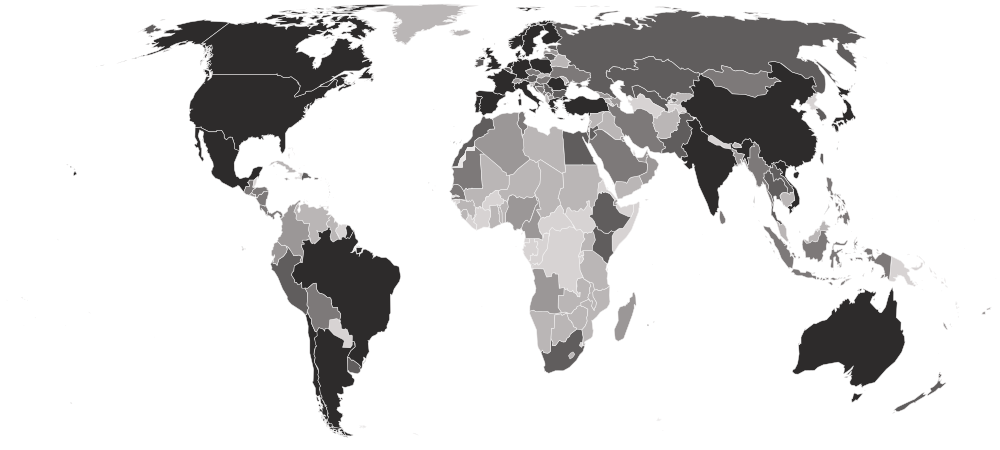
Wind power capacity on a map
Each country is shaded by its value, in five groups holding the same number of countries. Hover a country for its value, or select it to open its profile. Below the map, each continent’s middle country.
Darker is a higher value. This statistic has no better end, so the shades describe size, not success.
- 0.0
- 10.0–100.0
- 106.0–592.0
- 603.2–4,396.2
- 4,705.6–542,758.4
- No reading in 2026
- Europe
648.0
the middle country, of 42 measured · 49 members
Germany50,536.28 share 0.0
Highest and lowest reading in Europe.
- Asia
155.0
the middle country, of 43 measured · 52 members
China542,758.415 share 0.0
Highest and lowest reading in Asia.
- Americas
116.5
the middle country, of 30 measured · 48 members
United States157,593.98 share 0.0
Highest and lowest reading in Americas.
- Oceania
20.8
the middle country, of 6 measured · 21 members
Australia14,252.02 share 0.0
Highest and lowest reading in Oceania.
- Africa
0.0
the middle country, of 36 measured · 55 members
South Africa4,263.020 share 0.0
Highest and lowest reading in Africa.
- Every region
22 sub-regions, highest middle country first
- Western Europe
3,966.0
the middle country, of 7 measured · 9 members
Germany50,536.2 Switzerland55.0
Highest and lowest reading in Western Europe.
- Eastern Asia
3,022.7
the middle country, of 6 measured · 8 members
China542,758.4 Hong Kong0.0
Highest and lowest reading in Eastern Asia.
- Northern Europe
2,844.6
the middle country, of 12 measured · 13 members
 United Kingdom28,965.2
2 share 0.0
Highest and lowest reading in Northern Europe.
- South America
790.0
the middle country, of 10 measured · 12 members
 Brazil35,717.8
2 share 0.0
Highest and lowest reading in South America.
- Eastern Europe
439.7
the middle country, of 10 measured · 10 members
 Poland8,962.5
3 share 0.0
Highest and lowest reading in Eastern Europe.
- Southern Europe
244.0
the middle country, of 13 measured · 17 members
 Spain31,007.1
3 share 0.0
Highest and lowest reading in Southern Europe.
- Central America
235.0
the middle country, of 7 measured · 8 members
 Mexico8,424.6
 El Salvador54.0
Highest and lowest reading in Central America.
- South-eastern Asia
183.5
the middle country, of 10 measured · 11 members
 Vietnam7,081.1
4 share 0.0
Highest and lowest reading in South-eastern Asia.
- Southern Asia
142.5
the middle country, of 8 measured · 9 members
 India38,937.0
3 share 0.0
Highest and lowest reading in Southern Asia.
- Northern Africa
131.5
the middle country, of 6 measured · 6 members
 Egypt3,045.0
2 share 0.0
Highest and lowest reading in Northern Africa.
- Western Asia
35.4
the middle country, of 16 measured · 19 members
 Türkiye13,784.3
6 share 0.0
Highest and lowest reading in Western Asia.
- Caribbean
30.0
the middle country, of 9 measured · 24 members
 Dominican Republic603.2
4 share 0.0
Highest and lowest reading in Caribbean.
- Eastern Africa
0.0
the middle country, of 11 measured · 19 members
 Ethiopia664.0
6 share 0.0
Highest and lowest reading in Eastern Africa.
- Western Africa
0.0
the middle country, of 12 measured · 16 members
 Senegal208.0
8 share 0.0
Highest and lowest reading in Western Africa.
- Australia and New Zealand
2 of 2 measured — too few for a middle: Australia, New Zealand.
Australia14,252.0 New Zealand1,233.0
Highest and lowest reading in Australia and New Zealand.
- Central Asia
3 of 5 measured — too few for a middle: Kazakhstan, Kyrgyzstan, Uzbekistan.
 Uzbekistan1,600.0
 Kyrgyzstan0.0
Highest and lowest reading in Central Asia.
- Melanesia
2 of 5 measured — too few for a middle: Fiji, New Caledonia.
 New Caledonia31.5
 Fiji10.0
Highest and lowest reading in Melanesia.
- Micronesia
1 of 7 measured — too few for a middle: Guam.
 Guam0.0
Highest and lowest reading in Micronesia.
- Middle Africa
3 of 9 measured — too few for a middle: Angola, Cameroon, Chad.
 Cameroon100.0
 Chad0.0
Highest and lowest reading in Middle Africa.
- Northern America
4 of 4 measured — too few for a middle: Bermuda, Canada, Greenland, United States.
United States157,593.92 share 0.0
Highest and lowest reading in Northern America.
- Polynesia
1 of 7 measured — too few for a middle: American Samoa.
 American Samoa0.0
Highest and lowest reading in Polynesia.
- Southern Africa
4 of 5 measured — too few for a middle: Botswana, Lesotho, Namibia, South Africa.
South Africa4,263.03 share 0.0
Highest and lowest reading in Southern Africa.
03The whole field at once
The spread
157 countries, one dot each, on one scale — further right is a higher value. Half the countries are above 100.0; a quarter are above 1,447.9, and a quarter below 0.0. The bar in each row marks that continent’s middle country.
04All 157 ever measured
Every country
In order, highest value first. No rank or position is shown: too many countries share the same value for an order to mean anything. Neither end is better: this is the size of a wind fleet, so the largest economies lead. Only wind farms of 10 megawatts or more are counted, so a country missing from the table, or reading low, may still have smaller turbines. The prospective column shows where wind power is set to grow.
Showing 25 of 157 countries





























































































































Values for 2026.
05In this edition
Wind power capacity in records
The extremes of the statistic. A record reached by more than one country names none of them.
Highest reading
542,758.4
Wind farm capacity in operation (megawatts)
Lowest reading
Reached 53 times by 53 countries — shared, so no holder is named
0.0
Wind farm capacity in operation (megawatts)
06The measure
About wind power capacity
This is how much wind farm capacity a country has in operation, in megawatts, from Global Energy Monitor’s project-by-project register of the world’s utility-scale wind farms. Beside it are the farms being built, planned, shelved and retired.
What the number is: Wind farm capacity in operation (megawatts).
07Where it fits
Connections
Its part in the Country Index, the statistics whose values line up most closely with it across countries, and others on the same subject.
In the Country Index
Context, with no vote
This statistic is published in full under Environment & Sustainability and Energy, but does not help decide any Country Index standing.
Environment & SustainabilityEnergyWhich statistics vote, and why
Moves with
Where wind power capacity is higher, these tend to be higher too.
- Solar Electricity Installed CapacityEIA · 155 countries in commonρ 0.76
- GitHub Git PushesGitHub · 153 countries in commonρ 0.73
- GitHub RepositoriesGitHub · 157 countries in commonρ 0.72
Moves against
Where wind power capacity is higher, these tend to be lower.
- Export Concentration IndexUNCTAD · 154 countries in commonρ −0.59
- Net Official Development Assistance ReceivedOECD Development Assistance Committee · 94 countries in commonρ −0.54
- Climate Vulnerability (ND-GAIN)KeyNotre Dame Global Adaptation Initiative (ND-GAIN), University of Notre Dame · 144 countries in commonρ −0.54
Rank correlation (ρ, from −1 to 1) across countries, on each statistic’s newest edition, out of 360 statistics sharing at least 80 countries with this one. Two statistics that move together do not cause each other.
08Keep reading
Explore further
The subject
The data, edition by edition
More from Global Energy Monitor
09Questions
Wind power capacity: questions and answers
Which country has the highest wind power capacity?
China, at 542,758.4, among the 157 countries compared in 2026.
Which country has the lowest wind power capacity?
53 countries share the lowest reading, 0.0, among the 157 compared in 2026, so no single country is named.
How many countries does the Operating Wind Power Capacity cover?
157 in 2026.
What is the world average wind power capacity?
This site does not calculate a world average, which would depend on how countries are weighted. In the middle country of the 157 compared in 2026, the figure was 100.0.
Is this Global Energy Monitor’s own ranking?
No ranking is shown. Global Energy Monitor publishes values only, and too many countries share the same value for an ordering to mean anything, so none is derived.
How often is the Operating Wind Power Capacity published?
This site holds one edition, describing 2026.
Where does the data come from, and can I download it?
From Global Energy Monitor, under CC BY 4.0. From Global Energy Monitor’s Global Wind Power Tracker, read from its own country summary table. Figures are the table’s stored values, to a tenth of a megawatt, which is more precise than the whole numbers it displays. Territories the tracker lists separately are left out rather than added to another country. Every edition is on this site’s Datasets pages as a full table, and downloads as a CSV file with every value unrounded.
10Method
Sources, method and citation
Source
Operating Wind Power Capacity — Global Energy Monitor
From Global Energy Monitor’s Global Wind Power Tracker, read from its own country summary table. Figures are the table’s stored values, to a tenth of a megawatt, which is more precise than the whole numbers it displays. Territories the tracker lists separately are left out rather than added to another country.
Newest edition
Report year 2026Data year 2026
Cite the source as: Global Wind Power Tracker, Global Energy Monitor, February 2026 release.
Licence: CC BY 4.0, checked 2026-10-03.
How this page reads the numbers
- No rank or position is shown: Global Energy Monitor publishes values only, and too many countries share the same value for an ordering to mean anything.
- This statistic has no better end, so the page describes higher and lower values and never calls a country a leader.
- A country is named at an end only when it holds that value alone. Where several share it, the page says how many and names none first.
- Values are stored exactly as published and trimmed only for display. “The middle country” is the median of the countries measured, not a world average.
The file itself, column by column — where it came from, what each column holds, and every edition as a CSV — is on its dataset page.
Cite this page
Nations Inquiry (2026). Wind power capacity by country: Operating Wind Power Capacity, data from Global Energy Monitor. https://nationsinquiry.com/statistics/wind-power-capacity