
Photo: Lillestrøm SK derivative work: Jjtkk · CC BY-SA 3.0 · via Wikimedia Commons, shown in greyscale
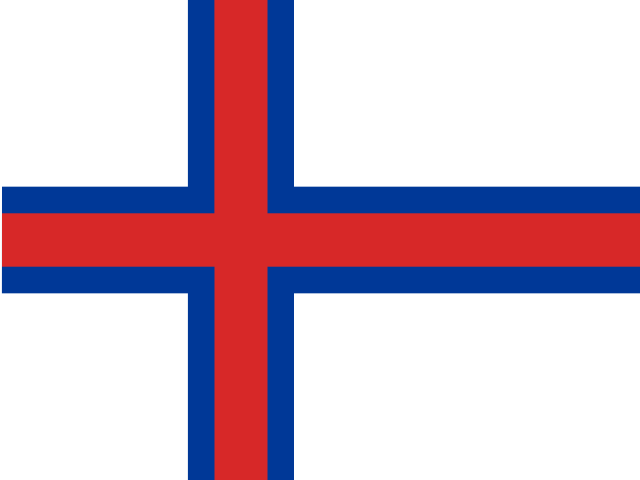
Faroe Islands
Faroe Islands places highest on Excess Mortality During the COVID-19 Pandemic (top 2% worldwide) and lowest on Municipal Solid Waste Generation (bottom 3%).
Share
Faroe Islands in the Nations Inquiry Country Index
Faroe Islands appears in 60 of the statistics tracked here, but is not placed in the Country Index: the index needs a standing on three quarters of its topics, and Faroe Islands is measured on too few of them. Every published reading below is unaffected.
At a glance
Population
54,714
people
since 1950
Land area
1,370
km²
since 1961
GDP per person
72,114
international $, PPP
since 2008
Life expectancy
80.18
years at birth
since 1950
The newest published figure for each, the year it describes and who published it, with a line showing how it has moved.
01The country
About Faroe Islands
The Faroe Islands rise sheer from the North Atlantic north-west of Shetland, steep basalt islands whose name means ‘sheep islands’. They govern themselves as a nation within the Danish realm. Layers of ancient lava form cliffs that drop straight into the sea and treeless green slopes climbing to Slættaratindur. Undersea road tunnels tie the larger islands together, gannets nest on outlying Mykines, and on Vágar the lake Sørvágsvatn ends at a sea cliff, seeming to hang above the ocean.
Irish hermits may have come first, but Norse settlers arrived in the ninth century, and the Færeyinga saga tells how Sigmundur Brestisson brought Christianity around 1000. Their assembly met on Tinganes, a rocky point by the harbour where the government sits, and the Løgting, their parliament, grew from it. The islands passed with Norway to the Danish crown and stayed Danish when Norway went to Sweden in 1814. Britain occupied them after Germany overran Denmark in April 1940, and home rule followed in 1948.
Pastor V. U. Hammershaimb gave Faroese its written standard in 1846, but the medieval ballads had kept the language alive, and islanders sing them while linking arms in a slow chain dance at Ólavsøka, the national festival in late July. Mutton hung in slatted sheds dries into skerpikjøt. William Heinesen’s novels carried island life abroad. Cod and haddock from the banks, with salmon farmed in the fjords, make up most exports, and the islands’ wool goes into heavy patterned sweaters.
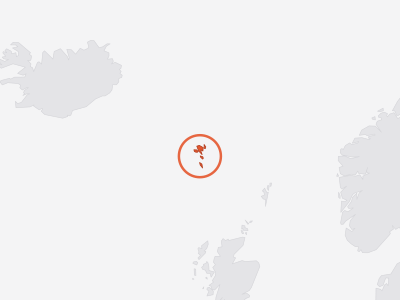
Key facts about Faroe Islands
- Capital
- Tórshavn
- Official languages
- Danish, Faroese
- Currency
- Faroese króna
- ISO code
- FRO · FO
- Domain · dialling
- .fo · +298
As Wikidata records them. Official languages are the least consistent — some countries list only a national language, others every regional one. Sources and licences.
02Country Index 2026
Where it stands, topic by topic
Strongest first. Each position is Faroe Islands’s place among the countries with a standing on that topic, built from a few key statistics chosen to measure different things.
03Highs and lows
Where Faroe Islands stands out
The two ends of its own record: every statistic on which Faroe Islands sits within ten places of the best or worst in the world, plus its strongest and weakest readings overall. Each is turned into a percentile — its place among every country measured — which is what lets a hunger score and a press-freedom rank be compared at all.
Where Faroe Islands does best5
In the top third of all countries measured.
Not ranked by the publisher · -66.1 · 2026
world median 272.35 (better)
Position · derived 206th of 220 · 1 = worst · 4.2 · 2023
world median 14.45 (better)
Position · derived 202nd of 222 · 1 = worst · 50.25 · 2023
world median 133.7 (better) · ▲ 3 pts since 2013
Position · derived 194th of 222 · 1 = worst · 4.672 · 2023
world median 27.46 (better) · ▲ 4 pts since 2013
Where Faroe Islands struggles most3
In the bottom third of all countries measured. 1 is within ten places of the worst in the world, in a field of at least 50 countries — marked with that place.
- 7thMunicipal Solid Waste Generationbottom 3%
Position · derived 7th of 201 · 1 = worst · 3.171 · 2026
world median 0.966 (worse)
- CO₂ Emissions per Capitabottom 7%
Position · derived 15th of 210 · 1 = worst · 13.09 · 2024
world median 3.21 (worse) · ▼ 2 pts since 2014
- Liner Shipping Connectivity Indexbottom 17%
Rank 141st of 175 · 20.58 · 2026
world median 56.21 (worse) · ▲ 9 pts since 2016
A band is a place among the countries each publisher scores, so Faroe Islands can move because other countries moved. See the Country Index for the full method.
04In context
Faroe Islands and its neighbours
A position reads best beside the countries around it. Every position below is a place in the world ranking, not within the region.
Shares a land border with
Faroe Islands has no land border with another country.
Across Northern Europe
Every country in the sub-region, by its position in the world.
- 2
 Denmark
- 3
 Norway
- 4
 Finland
- 5
 Sweden
- 11
 Ireland
- 12
 Iceland
- 16
 United Kingdom
- 21
 Estonia
- 23
 Lithuania
- 26
 Latvia
- —Channel Islandsnot placed
- —Faroe Islandsnot placed
- —
 Isle of Mannot placed
05The evidence
Every statistic we hold for Faroe Islands
Grouped by topic. Each row gives the newest edition’s rank or position, the published value and the year the numbers describe. Select a statistic for this country’s row beside every other country, the world median and every edition.
Economy & Innovation11
- Crop Production IndexFAO · Crop production index (2014–2016 = 100)133rd of 195position · derived99.42022
- Export Concentration IndexUNCTAD · Export concentration index (0–1, normalised Herfindahl–Hirschman)top 2%0.8372025
- Food Production IndexFAO · Food production index (2014–2016 = 100)95th of 195position · derived106.622022
- Liner Shipping Connectivity IndexUNCTAD · LSCI (index, average Q1 2023 = 100)141st of 175rank20.582026
- Livestock Production IndexFAO · Livestock production index (2014–2016 = 100)97th of 194position · derived107.12022
- Merchant Fleet by Country of OwnershipUNCTAD · Merchant fleet owned (thousand dead-weight tons)bottom 41%101.892026
- Researchers per Million InhabitantsUIS · Researchers per million inhabitants (full-time equivalent)48th of 145position · derived1,8252024
- Scholarly ArticlesOurResearch · Articles with at least one author at an institution in the country (full counting)bottom 18%1112025
- Statutory Corporate Income Tax RateOECD · Combined statutory corporate income tax rate, central and sub-central government (%)bottom 28%182026
- Terms of Trade IndexUNCTAD · Terms of trade index (2015 = 100)bottom 48%102.312025
- Total Natural Resources Rents (% of GDP)World Bank Group · Natural resources rents (% of GDP)180th of 180position · derived02021
Education & Knowledge2
- Female Share of ResearchersUIS · Researchers who are women (% of headcount; 50 = parity)bottom 14%23.082024
- Nobel Prize Laureates by Country of BirthNobel Prize Outreach · Laureates born in the country, 1901 to date (people)bottom 20%12025
Health & Wellbeing7
- Adolescent Birth Rate (Ages 15–19)UN DESA Population Division · Live births per 1,000 women aged 15–19194th of 222position · derived · 1 = worst4.6722023
- Adult Mortality (Probability of Dying Between 15 and 60)UN DESA Population Division · Deaths before age 60 per 1,000 people alive at 15, at that year's death rates202nd of 222position · derived · 1 = worst50.252023
- Days Above 35°CECMWF · Days a year with a maximum temperature above 35°C, averaged over the country’s landtop 16%02025
- Excess Mortality During the COVID-19 PandemicAriel Karlinsky and Dmitry Kobak (World Mortality Dataset) · Excess deaths per 100,000 people, March 2020 to the end of each country's data (at most December 2023)top 2%-66.12026
- Life Expectancy at Age 65UN DESA Population Division · Further years a 65-year-old would live at current death rates67th of 222position · derived18.262023
- Life Expectancy at BirthUN DESA Population Division · Years a newborn would live at current death rates51st of 222position · derived80.182023
- PM2.5 Air Pollution ExposureAtmospheric Composition Analysis Group, Washington University in St. Louis · Population-weighted PM2.5 concentration (µg/m³)206th of 220position · derived · 1 = worst4.22023
Development & Human Capital2
- Access to ElectricityWorld Bank Group · Population with electricity access (%)top 28%1002024
- Access to Electricity, RuralWorld Bank Group · Rural population with electricity access (%)top 29%1002024
Environment & Sustainability13
- Agricultural LandFAO · Agricultural land (% of land area)23rd of 209position · derived70.122023
- Arable Land per PersonFAO · Arable land (hectares per person)203rd of 206position · derived0.0012023
- Burned AreaGWIS · Burned area (hectares)bottom 12%02025
- CO₂ Emissions per CapitaGlobal Carbon Project · Fossil CO₂ (tonnes per person)15th of 210position · derived · 1 = worst13.092024
- Fertilizer Consumption per HectareFAO · Fertilizer consumption (kg per hectare of arable land)6th of 188position · derived614.292023
- Fisheries and Aquaculture ProductionFAO · Fish, crustaceans, molluscs and other aquatic animals caught or farmed, tonnes (live weight)top 14%786,1052024
- Forest AreaFAO · Forest area (% of land area)206th of 210position · derived0.0582023
- Methane EmissionsEDGAR · Methane emissions (gigagrams of CH₄)bottom 10%1.6592025
- Municipal Solid Waste GenerationWorld Bank Group · Municipal solid waste generated (kg per person per day)7th of 201position · derived · 1 = worst3.1712026
- Operating Wind Power CapacityGlobal Energy Monitor · Wind farm capacity in operation (megawatts)bottom 40%372026
- Population Living Below 5 m ElevationCenter for International Earth Science Information Network (CIESIN), Columbia University · Population living below 5 m elevation (% of total population)bottom 48%2.6742015
- Solar Electricity Installed CapacityEIA · Solar generating capacity installed (gigawatts)bottom 3%02024
- Tree Cover LossWorld Resources Institute — Global Forest Watch (data: University of Maryland) · Tree cover loss (hectares, where canopy cover exceeded 30% in 2000)bottom 6%02025
Gender & Equality2
- Mean Age at First Marriage, WomenUN DESA Population Division · Singulate mean age at marriage, women (years)top 11%312019
- Sex Ratio at BirthUN DESA Population Division · Male births per 100 female birthstop 16%106.72023
Mobility & Trade4
- EmigrantsUN DESA Population Division · Migrants from the country living abroad, mid-year (people)bottom 15%12,2822024
- International MigrantsUN DESA Population Division · International migrants living in the country, mid-year (people)bottom 10%8,1012024
- Net Migration RateUN DESA Population Division · Net migrants per 1,000 populationtop 10%10.952023
Energy3
- Crude Oil ProductionEIA · Crude oil produced (thousand barrels per day)bottom 26%02025
- Natural Gas ProductionEIA · Dry natural gas produced (billion cubic metres)bottom 27%02024
- Primary Energy ProductionEIA · Primary energy produced (quadrillion Btu)bottom 19%0.0012024
Digital & Technology3
- GitHub DevelopersGitHub · Developer accounts located in the economy (as of quarter end)bottom 14%2,5082026
- GitHub Git PushesGitHub · Git pushes during the quarterbottom 3%3,7932025
- GitHub RepositoriesGitHub · Public repositories located in the economy (as of quarter end)bottom 14%4,0812026
People & Population13
- Crude Birth RateUN DESA Population Division · Births per 1,000 populationbottom 46%12.612023
- Crude Death RateUN DESA Population Division · Deaths per 1,000 populationtop 17%10.312023
- Mean Age at ChildbearingUN DESA Population Division · Mean age of mothers at the birth of their children (years)top 26%30.332023
- Median Age of the PopulationUN DESA Population Division · Median age (years)top 32%37.262023
- Population Aged 65 and OverUN DESA Population Division · Share of the total population aged 65 and over (%)top 20%17.732023
- Population DensityUN DESA Population Division · People per square kilometre of landbottom 24%39.52023
- Population Growth RateUN DESA Population Division · Population growth (% per year)top 38%1.3292023
- Population Living in Cities (Degree of Urbanisation)UN DESA Population Division · Share of the population living in cities as the Degree of Urbanisation defines them (%)bottom 8%02025
- Population Under Age 15UN DESA Population Division · Share of the total population aged 0–14 (%)bottom 43%20.162023
- Sex Ratio of the Total PopulationUN DESA Population Division · Males per 100 femalestop 7%107.122023
- Total Dependency RatioUN DESA Population Division · People aged 0–14 and 65+ per 100 people aged 15–64top 31%60.992023
- Total Fertility RateUN DESA Population Division · Live births per womantop 41%2.242023
06Method
Sources and how to read them
How to read this page
- The scores and ranks belong to their publishers. Nothing is adjusted, rescaled or re-ranked; each is reproduced from the edition named beside it. Where a row says position · derived, the publisher ranks nobody on that measure and the position is ours, made by ordering the published score.
- Each statistic shows its newest edition, which is not always the edition the Country Index uses: the index pins every source to one data year so its average compares like with like.
How a standing is built from percentiles, why Faroe Islands can move because other countries moved, and why publishers measure between 120 and 215 countries each are set out in full in how a standing is made and what a standing cannot tell you.
Sources
- Statistics: 19 publishers, each named beside its numbers, with every edition and licence on the datasets pages.
- Capital, languages, currency, codes: Wikidata, public domain (CC0).
- Map and land borders: Natural Earth, public domain. Borders are de facto — where administration actually changes — not claimed.
Photographs
The photograph of Faroe Islands on this page comes from Wikimedia Commons and is shown in greyscale. The photographer and the licence are named beside each one.
Cite this page
Nations Inquiry (2026). Faroe Islands: country statistics, rankings and trends. https://nationsinquiry.com/countries/faroe-islands