OurResearch · Scholarly Articles
Scholarly articles by country
How many scholarly articles have an author from each country?
Of the 218 countries compared in 2025, China had the highest reading, 1,094,890, and Kiribati had the lowest reading, 1. In the middle country the figure was 2,240. Among the 215 countries measured in every edition since 2022, the middle one moved from 1,668 to 2,276.
Scholarly articles · 2025
Context statistic

Highest of 218China
1,094,890012025 · values only
The highest and the lowest
The three countries with the highest values of 218 compared, the three with the lowest, and the highest on each continent. This statistic has no better end, so no country is shown as leading.
- 1
- 2

- 3


Highest on each continent
- Africa
 Egypt65,359
 - AmericasUnited States700,214
- AsiaChina1,094,890
- Europe
 United Kingdom226,646
 - Oceania
 Australia110,226
 - Every region
02Every measured country
Scholarly articles on a map
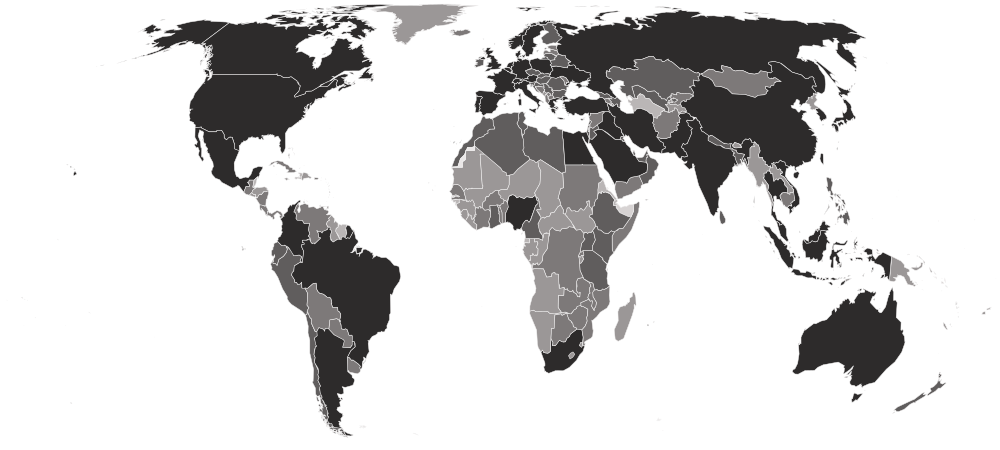
Each country is shaded by its value, in five groups holding the same number of countries. Hover a country for its value, or select it to open its profile. Below the map, each continent’s middle country.
Darker is a higher value. This statistic has no better end, so the shades describe size, not success.
- 1–140
- 151–870
- 889–4,190
- 4,388–25,665
- 25,930–1,094,890
- No reading in 2025 (1 measured in an earlier edition)
- Europe
10,214
the middle country, of 48 measured · 49 members
United Kingdom226,646 Vatican City8
Highest and lowest reading in Europe.
- Asia
9,428
the middle country, of 51 measured · 52 members
China1,094,890 Turkmenistan49
Highest and lowest reading in Asia.
- Africa
867
the middle country, of 54 measured · 55 members
Egypt65,359 Equatorial Guinea21
Highest and lowest reading in Africa.
- Americas
480
the middle country, of 47 measured · 48 members
United States700,214 Anguilla3
Highest and lowest reading in Americas.
- Oceania
21
the middle country, of 18 measured · 21 members
Australia110,226 Kiribati1
Highest and lowest reading in Oceania.
- Every region
22 sub-regions, highest middle country first
- Eastern Asia
41,785
the middle country, of 8 measured · 8 members
China1,094,890 North Korea431
Highest and lowest reading in Eastern Asia.
- Western Europe
40,525
the middle country, of 9 measured · 9 members
 Germany180,671
 Liechtenstein135
Highest and lowest reading in Western Europe.
- Eastern Europe
22,838
the middle country, of 10 measured · 10 members
 Russia143,004
 Moldova1,815
Highest and lowest reading in Eastern Europe.
- South-eastern Asia
22,771
the middle country, of 11 measured · 11 members
Indonesia439,247 Timor-Leste434
Highest and lowest reading in South-eastern Asia.
- Northern Europe
13,499
the middle country, of 12 measured · 13 members
United Kingdom226,646 Isle of Man12
Highest and lowest reading in Northern Europe.
- Northern Africa
13,044
the middle country, of 6 measured · 6 members
Egypt65,359 Sudan3,252
Highest and lowest reading in Northern Africa.
- South America
9,650
the middle country, of 12 measured · 12 members
 Brazil191,727
 Suriname59
Highest and lowest reading in South America.
- Southern Asia
9,428
the middle country, of 9 measured · 9 members
 India317,534
 Bhutan223
Highest and lowest reading in Southern Asia.
- Western Asia
6,130
the middle country, of 18 measured · 19 members
 Türkiye138,731
 Bahrain1,700
Highest and lowest reading in Western Asia.
- Central Asia
3,535
the middle country, of 5 measured · 5 members
 Uzbekistan23,769Turkmenistan49
Highest and lowest reading in Central Asia.
- Southern Europe
2,274
the middle country, of 17 measured · 17 members
 Italy141,711Vatican City8
Highest and lowest reading in Southern Europe.
- Eastern Africa
1,012
the middle country, of 18 measured · 19 members
 Ethiopia14,016
 Eritrea39
Highest and lowest reading in Eastern Africa.
- Central America
1,000
the middle country, of 8 measured · 8 members
 Mexico53,437
 Belize31
Highest and lowest reading in Central America.
- Southern Africa
785
the middle country, of 5 measured · 5 members
 South Africa37,989
 Lesotho186
Highest and lowest reading in Southern Africa.
- Western Africa
693
the middle country, of 16 measured · 16 members
 Nigeria52,123
 Guinea-Bissau45
Highest and lowest reading in Western Africa.
- Middle Africa
414
the middle country, of 9 measured · 9 members
 Cameroon5,354Equatorial Guinea21
Highest and lowest reading in Middle Africa.
- Caribbean
128
the middle country, of 23 measured · 24 members
 Cuba2,477Anguilla3
Highest and lowest reading in Caribbean.
- Polynesia
18
the middle country, of 7 measured · 7 members
 French Polynesia210
 Tuvalu8
Highest and lowest reading in Polynesia.
- Micronesia
15
the middle country, of 5 measured · 7 members
 Guam105Kiribati1
Highest and lowest reading in Micronesia.
- Australia and New Zealand
2 of 2 measured — too few for a middle: Australia, New Zealand.
Australia110,226 New Zealand15,777
Highest and lowest reading in Australia and New Zealand.
- Melanesia
4 of 5 measured — too few for a middle: Fiji, New Caledonia, Papua New Guinea, Vanuatu.
 Fiji472
 Vanuatu5
Highest and lowest reading in Melanesia.
- Northern America
4 of 4 measured — too few for a middle: Bermuda, Canada, Greenland, United States.
United States700,214 Bermuda34
Highest and lowest reading in Northern America.
03The whole field at once
The spread
218 countries, one dot each, on one scale — further right is a higher value. Half the countries are above 2,240; a quarter are above 19,395, and a quarter below 220. The bar in each row marks that continent’s middle country.
Log scale: each gridline is ten times the one before, so countries of very different sizes can be seen on one line.
04All 219 ever measured
Every country
In order, highest value first. No rank or position is shown: too many countries share the same value for an order to mean anything. Neither end is better, and this counts what OpenAlex catalogues rather than research done: Indonesia sits near the top largely because OpenAlex indexes its many open-access journals unusually thoroughly. An article with authors in several countries counts once for each of them, so the countries add up to more than the world total. Conference papers, books and preprints are not counted.
Showing 25 of 219 countries














































































































































































Values for 2025. The change column compares 2025 with 2024 only; the sparkline covers the recent editions.
052022–2025 · 4 editions
Over time
Each point is one publication year from 2022, when OpenAlex's records of authors' institutions became complete enough to compare years. The newest year is still filling in as articles are catalogued, so its point is likely to rise.
- the middle country
- the middle half of countries
- the middle of the 215 countries measured every time
- each continent’s middle country
The same, year by year
| Year | Countries | Middle country | Middle half | Measured every time |
|---|---|---|---|---|
| 2025 | 218 | 2,240 | 220 – 19,395 | 2,276 |
| 2024 | 217 | 1,814 | 197 – 15,401 | 1,857 |
| 2023 | 217 | 1,666 | 203 – 15,047 | 1,673 |
| 2022 | 217 | 1,580 | 180 – 13,502 | 1,668 |
062024 → 2025
Who rose and fell
The biggest changes in value between the two newest editions. Places are shown second, because they also move when other countries do.
Rose most
before → after- China947,146 → 1,094,890+147,744
- United States663,627 → 700,214+36,587
- India290,994 → 317,534+26,540
- Türkiye122,293 → 138,731+16,438
- United Kingdom210,330 → 226,646+16,316
216 countries were measured in both 2024 and 2025. The field changed from 217 to 218 countries, so a place can move for reasons that have nothing to do with the country itself.
07Across every edition
Scholarly articles in records
The extremes of the statistic. A record reached by more than one country names none of them.
Highest reading on record
1,094,890
Articles with at least one author at an institution in the country (full counting)
Lowest reading on record
Reached 3 times by 2 countries — shared, so no holder is named
1
Articles with at least one author at an institution in the country (full counting)
Biggest rise between editions
+147,744
947,146 → 1,094,890
Biggest fall between editions
−14,830
665,588 → 650,758
Biggest change since first measured
+292,970
801,920 → 1,094,890
Highest most often
4 of 4
editions, alone at the first-listed end
08The measure
About scholarly articles
How many scholarly articles published in a year have at least one author at a university, institute or other institution in each country, as counted by OpenAlex, the open catalogue of the world's research. It is a broad, openly licensed picture of where published research comes from.
What the number is: Articles with at least one author at an institution in the country (full counting).
09Where it fits
Connections
Its part in the Country Index, the statistics whose values line up most closely with it across countries, and others on the same subject.
In the Country Index
Context, with no vote
This statistic is published in full under Economy & Innovation and Education & Knowledge, but does not help decide any Country Index standing.
Economy & InnovationEducation & KnowledgeWhich statistics vote, and why
Moves with
Where scholarly articles is higher, these tend to be higher too.
- GitHub DevelopersGitHub · 215 countries in commonρ 0.96
- GitHub RepositoriesGitHub · 215 countries in commonρ 0.95
- GitHub Git PushesGitHub · 186 countries in commonρ 0.93
Moves against
Where scholarly articles is higher, these tend to be lower.
- Outbound Mobility Ratio, TertiaryUIS · 117 countries in commonρ −0.62
- Climate Vulnerability (ND-GAIN)KeyNotre Dame Global Adaptation Initiative (ND-GAIN), University of Notre Dame · 187 countries in commonρ −0.56
- Net Official Development Assistance ReceivedOECD Development Assistance Committee · 127 countries in commonρ −0.55
Rank correlation (ρ, from −1 to 1) across countries, on each statistic’s newest edition, out of 314 statistics sharing at least 80 countries with this one. Two statistics that move together do not cause each other.
10Keep reading
Explore further
The subject
The data, edition by edition
11Questions
Scholarly articles: questions and answers
Which country has the highest scholarly articles?
China, at 1,094,890, among the 218 countries compared in 2025.
Which country has the lowest scholarly articles?
Kiribati, at 1, among the 218 countries compared in 2025.
How many countries does the Scholarly Articles cover?
218 in 2025, and 219 at least once across all editions. The number measured varies from 217 to 218 between editions.
What is the world average scholarly articles?
This site does not calculate a world average, which would depend on how countries are weighted. In the middle country of the 218 compared in 2025, the figure was 2,240.
Is this OpenAlex (OurResearch)’s own ranking?
No ranking is shown. OpenAlex (OurResearch) publishes values only, and too many countries share the same value for an ordering to mean anything, so none is derived.
How often is the Scholarly Articles published?
This site holds 4 editions, describing 2022 to 2025.
Where does the data come from, and can I download it?
From OpenAlex (OurResearch), under CC0 1.0. Read from the OpenAlex API: articles grouped by the country of their authors' institutions, one publication year at a time. The figures are OpenAlex's own counts on the day they were read; OpenAlex adds and merges records daily. Every edition is on this site’s Datasets pages as a full table, and downloads as a CSV file with every value unrounded.
12Method
Sources, method and citation
Source
Scholarly Articles — OpenAlex (OurResearch)
Read from the OpenAlex API: articles grouped by the country of their authors' institutions, one publication year at a time. The figures are OpenAlex's own counts on the day they were read; OpenAlex adds and merges records daily.
Newest edition
Report year 2025Data year 2025
Cite the source as: Priem, J., Piwowar, H., & Orr, R. (2022). OpenAlex: A fully-open index of scholarly works, authors, venues, institutions, and concepts. arXiv:2205.01833.
Licence: CC0 1.0, checked 2026-09-29.
How this page reads the numbers
- No rank or position is shown: OpenAlex (OurResearch) publishes values only, and too many countries share the same value for an ordering to mean anything.
- This statistic has no better end, so the page describes higher and lower values and never calls a country a leader.
- A country is named at an end only when it holds that value alone. Where several share it, the page says how many and names none first.
- Values are stored exactly as published and trimmed only for display. “The middle country” is the median of the countries measured, not a world average.
The file itself, column by column — where it came from, what each column holds, and every edition as a CSV — is on its dataset page.
Cite this page
Nations Inquiry (2026). Scholarly articles by country: Scholarly Articles, data from OpenAlex (OurResearch). https://nationsinquiry.com/statistics/scholarly-articles