
Photo: Martin Weber derivative work: Jjtkk · CC BY-SA 3.0 · via Wikimedia Commons, shown in greyscale
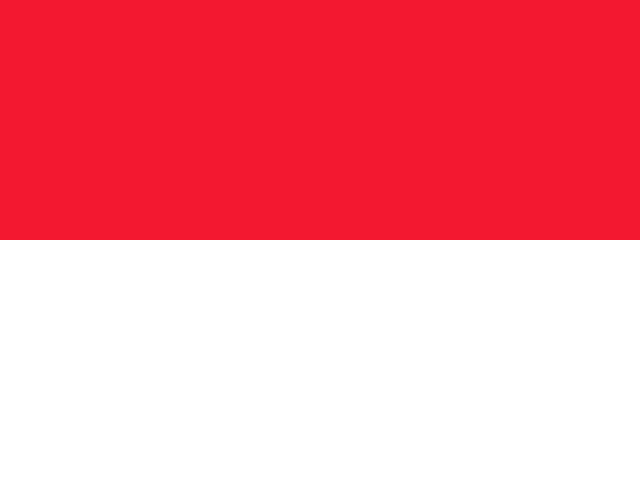
Monaco
Monaco places highest on Adult Mortality (Probability of Dying Between 15 and 60) (top 1% worldwide) and lowest on Government Funding per Primary Student (bottom 1%).
Share
Monaco in the Nations Inquiry Country Index
Monaco appears in 99 of the statistics tracked here, but is not placed in the Country Index: the index needs a standing on three quarters of its topics, and Monaco is measured on too few of them. Every published reading below is unaffected.
At a glance
Population
38,956
people
since 1950
Land area
2.084
km²
since 1961
Life expectancy
86.37
years at birth
since 1950
The newest published figure for each, the year it describes and who published it, with a line showing how it has moved.
01The country
About Monaco
Monaco packs a principality into a strip of Mediterranean shore beneath the limestone wall of the Maritime Alps, so steep that public lifts carry people between streets. A hereditary monarchy under the Grimaldi family, it has an elected National Council. The old town crowns the Rock, a headland topped by the palace; yachts crowd Port Hercule below; the casino quarter climbs the slopes to the east; and Fontvieille, to the west, stands on land won from the sea in the 1970s.
Greek sailors called the headland Monoikos, after a temple of Heracles, hence Port Hercule. Genoa fortified the Rock in 1215, and in 1297 François Grimaldi, disguised as a Franciscan friar, seized it; two sword-carrying monks support the family’s arms in memory. Revolutionary France ousted the Grimaldis from 1793 to 1814. After Menton and Roquebrune broke away in 1848, Charles III sold his rights to them to France in 1861 and licensed a casino; the quarter around it was named Monte Carlo after him in 1866.
Monégasques, a minority of residents, keep a Ligurian dialect taught in schools, and each January a boat is burned by the harbour church of Sainte Dévote, the patron saint said to have drifted ashore here. Barbagiuan, a fried pastry of chard and ricotta, is the local snack. The Grand Prix, first run in 1929, threads Formula One cars through the streets. Residents have paid no income tax since 1869, and banking, property, tourism and the casino pay its way.

Key facts about Monaco
- Capital
- Monaco
- Official language
- French
- Currency
- euro (EUR)
- ISO code
- MCO · MC
- Domain · dialling
- .mc · +377
As Wikidata records them. Official languages are the least consistent — some countries list only a national language, others every regional one. Sources and licences.
02Country Index 2026
Where it stands, topic by topic
Strongest first. Each position is Monaco’s place among the countries with a standing on that topic, built from a few key statistics chosen to measure different things.
2ndof 200
From 2 of 4 key statistics
10thof 198
From 2 of 4 key statistics
14thof 193
From 2 of 4 key statistics
joint55thof 196
From 2 of 3 key statistics
joint123rdof 198
From 2 of 4 key statistics
149thof 198
From 2 of 4 key statistics
No standing — Monaco holds too few of this subject’s key statistics to be placed on it.
No standing — Monaco holds too few of this subject’s key statistics to be placed on it.
No standing — Monaco holds too few of this subject’s key statistics to be placed on it.
No standing — Monaco holds too few of this subject’s key statistics to be placed on it.
No standing — Monaco holds too few of this subject’s key statistics to be placed on it.
No standing — Monaco holds too few of this subject’s key statistics to be placed on it.
No standing — Monaco holds too few of this subject’s key statistics to be placed on it.
No standing — Monaco holds too few of this subject’s key statistics to be placed on it.
No standing — Monaco holds too few of this subject’s key statistics to be placed on it.
No standing — Monaco holds too few of this subject’s key statistics to be placed on it.
Each standing is built from a few key statistics chosen to measure different things. Select a subject for Monaco’s readings on it, or see every statistic held for Monaco in the table further down this page.
03Highs and lows
Where Monaco stands out
The two ends of its own record: every statistic on which Monaco sits within ten places of the best or worst in the world, plus its strongest and weakest readings overall. Each is turned into a percentile — its place among every country measured — which is what lets a hunger score and a press-freedom rank be compared at all.
Where Monaco does best10 of 11
In the top third of all countries measured. 11 are within ten places of the best in the world, in a field of at least 50 countries — marked with that place.
- 1st
Position · derived 222nd of 222 · 1 = worst · 25.15 · 2023
world median 133.7 (better)
- 1st
Position · derived 1st of 195 · 21.69 · 2023
world median 13.34 (better)
- 1stLife Expectancy at Birthtop 1%
Position · derived 1st of 222 · 86.37 · 2023
world median 74.63 (better)
- 1st
Position · derived 1st of 222 · 23.21 · 2023
world median 16.39 (better)
- 1stDeaths in Organized Violencetop 35%
Position · derived 59th of 59 · 1 = worst · 0 · 2025
world median 0
- 1st
- 1st
Position · derived 1st of 109 · 158.55 · 2024
world median 93.19 (better)
- 1stStillbirth Ratetop 1%
Position · derived 200th of 200 · 1 = worst · 1.18 · 2023
world median 8.163 (better)
- 1stWorld Risk Indextop 1%
Position · derived 193rd of 193 · 1 = worst · 0.18 · 2025
world median 4.17 (better)
- 2nd
Position · derived 2nd of 75 · 86.73 · 2024
world median 5.494 (better) · ▲ 89 pts since 2017
1 more in every statistic for Monaco.
Where Monaco struggles most5
In the bottom third of all countries measured. 2 are within ten places of the worst in the world, in a field of at least 50 countries — marked with that place.
- 1st
Position · derived 68th of 68 · 3.771 · 2022
world median 17.81 (worse)
- 5thMunicipal Solid Waste Generationbottom 2%
Position · derived 5th of 201 · 1 = worst · 3.25 · 2026
world median 0.966 (worse)
- Government Spending on Educationbottom 8%
Position · derived 113th of 123 · 1.732 · 2023
world median 3.709 (worse) · ▲ 7 pts since 2013
Not ranked by the publisher · 616.8 · 2026
world median 272.35 (worse)
- HPV Vaccination Coverage, Girlsbottom 12%
Not ranked by the publisher · 16 · 2025
world median 65.5 (worse)
A band is a place among the countries each publisher scores, so Monaco can move because other countries moved. See the Country Index for the full method.
04In context
Monaco and its neighbours
A position reads best beside the countries around it. Every position below is a place in the world ranking, not within the region.
Shares a land border with
Across Western Europe
Every country in the sub-region, by its position in the world.
- 1
 Switzerland
- =6
 Austria
- =6
 Luxembourg
- 8
 Germany
- 9
 Netherlands
- =17
 Belgium
- =19
 France
- —
 Liechtensteinnot placed
- —Monaconot placed
05The evidence
Every statistic we hold for Monaco
Grouped by topic. Each row gives the newest edition’s rank or position, the published value and the year the numbers describe. Select a statistic for this country’s row beside every other country, the world median and every edition.
Governance & Institutions16
- Child and Family Benefit CoverageILO · Children or households with children receiving child or family cash benefits (%)top 28%62.92024
- Civic Space RatingsCIVICUS · Civic space score (0–100)22nd of 198position · derived87.622025
- Climate Readiness (ND-GAIN)Notre Dame Global Adaptation Initiative (ND-GAIN), University of Notre Dame · ND-GAIN Readiness (0–1, where 1 is the most ready)4th of 192rank0.7152024
- Completeness of Birth RegistrationUNICEF · Children under 5 whose birth is registered (%)top 14%1002025
- Control of CorruptionWorld Bank Group · Control of Corruption (−2.5 to 2.5)29th of 211position · derived1.182025
- Disability Benefit CoverageILO · People with severe disabilities receiving disability benefits (%)top 45%51.22025
- Government AI Readiness IndexOxford Insights · AI readiness score (0–100)105th of 195rank38.622025
- Government EffectivenessWorld Bank Group · Governance estimate (−2.5 weak to 2.5 strong)13th of 209position · derived1.7242025
- Government Funding per Primary StudentUIS · Government funding per primary student (% of GDP per capita)68th of 68position · derived3.7712022
- Government Spending on EducationUIS · Government expenditure on education (% of GDP)113th of 123position · derived1.7322023
- GovTech Maturity IndexWorld Bank Group · GTMI score (0–1)145th of 196position · derived0.3662025
- Old-Age Pension CoverageILO · People above statutory pensionable age receiving an old-age pension (%)bottom 26%24.22025
- Regulatory QualityWorld Bank Group · Regulatory Quality (−2.5 to 2.5)12th of 209position · derived1.5632025
- Rule of LawWorld Bank Group · Rule of Law estimate (−2.5 to 2.5)11th of 211position · derived1.6492025
- Voice and AccountabilityWorld Bank Group · Voice and Accountability estimate (−2.5 to 2.5)41st of 206position · derived0.9382025
Economy & Innovation5
- Merchant Fleet by Country of OwnershipUNCTAD · Merchant fleet owned (thousand dead-weight tons)top 10%30,6042026
- Researchers per Million InhabitantsUIS · Researchers per million inhabitants (full-time equivalent)94th of 145position · derived309.92024
- Scholarly ArticlesOurResearch · Articles with at least one author at an institution in the country (full counting)bottom 23%1902025
- Statutory Corporate Income Tax RateOECD · Combined statutory corporate income tax rate, central and sub-central government (%)top 40%252026
- Total Natural Resources Rents (% of GDP)World Bank Group · Natural resources rents (% of GDP)180th of 180position · derived02021
Work & Labour1
- Employment Injury Protection CoverageILO · Labour force covered in the event of a work injury (%)top 34%70.52024
Education & Knowledge15
- Expected Years of SchoolingUNDP Human Development Report Office · Expected years of schooling1st of 195position · derived21.692023
- Female Share of ResearchersUIS · Researchers who are women (% of headcount; 50 = parity)top 16%502024
- Gender Parity Index, Tertiary EnrolmentUIS · Adjusted gender parity index, tertiary gross enrolment (1 = parity)81st of 95position · derived1.432024
- Inbound Mobility Rate, TertiaryUIS · Inbound mobility rate, tertiary (%)2nd of 75position · derived86.732024
- Outbound Mobility Ratio, TertiaryUIS · Outbound mobility ratio, tertiary (% of tertiary enrolment at home)top 9%40.772023
- Participation in Organised Learning One Year Before PrimaryUIS · Children one year before primary entry age in organised learning (%)41st of 112position · derived92.392024
- Pre-Primary Net Enrolment RateUIS · Net enrolment rate, pre-primary (%)36th of 120position · derived85.292024
- Primary Schools with ElectricityUIS · Primary schools with access to electricity (%)top 30%1002024
- Primary Schools with Internet for TeachingUIS · Primary schools with internet access for teaching (%)top 22%1002024
- Pupils per Qualified Teacher, PrimaryUIS · Primary pupils per qualified teacher (headcount basis)80th of 92position · derived · 1 = worst12.242024
- Qualified Teachers in Primary EducationUIS · Primary teachers with the minimum qualifications their country requires (%)bottom 23%802024
- School Life ExpectancyUIS · School life expectancy, primary to tertiary (years)1st of 77position · derived21.012024
- Secondary School EnrolmentUIS · Gross secondary enrolment ratio (%)1st of 109position · derived158.552024
- Share of Graduates from ICT ProgrammesUIS · Tertiary graduates from ICT programmes (% of all graduates)bottom 1%02023
- Tertiary Enrolment RatioUIS · Gross enrolment ratio, tertiary (%)18th of 95position · derived77.482024
Health & Wellbeing17
- Adolescent Birth Rate (Ages 15–19)UN DESA Population Division · Live births per 1,000 women aged 15–19162nd of 222position · derived · 1 = worst9.692023
- Adult Mortality (Probability of Dying Between 15 and 60)UN DESA Population Division · Deaths before age 60 per 1,000 people alive at 15, at that year's death rates222nd of 222position · derived · 1 = worst25.152023
- Days Above 35°CECMWF · Days a year with a maximum temperature above 35°C, averaged over the country’s landtop 16%02025
- Excess Mortality During the COVID-19 PandemicAriel Karlinsky and Dmitry Kobak (World Mortality Dataset) · Excess deaths per 100,000 people, March 2020 to the end of each country's data (at most December 2023)bottom 8%616.82026
- HPV Vaccination Coverage, GirlsWUENIC · Girls in the target group given the final dose of HPV vaccine (%)bottom 12%162025
- Immunisation Coverage, DTP3WUENIC · Infants given a third dose of DTP vaccine (%)top 5%992025
- Immunisation Coverage, Measles First Dose (MCV1)WUENIC · Infants given a first dose of measles vaccine (%)bottom 44%882025
- Infant Mortality RateUN IGME · Deaths before age one (per 1,000 live births)186th of 200position · derived · 1 = worst2.2092024
- Life Expectancy at Age 65UN DESA Population Division · Further years a 65-year-old would live at current death rates1st of 222position · derived23.212023
- Life Expectancy at BirthUN DESA Population Division · Years a newborn would live at current death rates1st of 222position · derived86.372023
- Low Birthweight PrevalenceUNICEF and WHO (Joint Low Birthweight Estimates) · Live births weighing under 2,500 g (%)123rd of 158position · derived · 1 = worst6.8252020
- Maternal Mortality RatioMMEIG · Maternal deaths per 100,000 live births169th of 195position · derived · 1 = worst5.222023
- Mortality Rate, Ages 5–14UN IGME · Deaths between ages 5 and 14 (per 1,000 children aged 5)189th of 200position · derived · 1 = worst0.732024
- Neonatal Mortality RateUN IGME · Deaths in the first 28 days (per 1,000 live births)188th of 200position · derived · 1 = worst1.3992024
- PM2.5 Air Pollution ExposureAtmospheric Composition Analysis Group, Washington University in St. Louis · Population-weighted PM2.5 concentration (µg/m³)169th of 220position · derived · 1 = worst8.32023
- Stillbirth RateUN IGME · Stillbirths (per 1,000 total births)200th of 200position · derived · 1 = worst1.182023
- Under-Five Mortality RateUN IGME · Deaths before age five (per 1,000 live births)187th of 200position · derived · 1 = worst2.6612024
Development & Human Capital2
- Access to ElectricityWorld Bank Group · Population with electricity access (%)top 28%1002024
- Access to Electricity, RuralWorld Bank Group · Rural population with electricity access (%)top 29%1002024
Environment & Sustainability11
- Agricultural EmissionsFAO · Farm-gate emissions (kt CO₂eq)193rd of 193position · derived02023
- Climate Vulnerability (ND-GAIN)Notre Dame Global Adaptation Initiative (ND-GAIN), University of Notre Dame · ND-GAIN Vulnerability (0–1, where 1 is the most vulnerable)54th of 190rank0.392024
- Fisheries and Aquaculture ProductionFAO · Fish, crustaceans, molluscs and other aquatic animals caught or farmed, tonnes (live weight)bottom 1%12024
- Forest AreaFAO · Forest area (% of land area)210th of 210position · derived02023
- Municipal Solid Waste GenerationWorld Bank Group · Municipal solid waste generated (kg per person per day)5th of 201position · derived · 1 = worst3.252026
- ND-GAIN Country IndexNotre Dame Global Adaptation Initiative (ND-GAIN), University of Notre Dame · ND-GAIN Index (0–100, where 100 is best placed to adapt)13th of 190rank66.232024
- Population Living Below 5 m ElevationCenter for International Earth Science Information Network (CIESIN), Columbia University · Population living below 5 m elevation (% of total population)top 25%7.8992015
- Temperature Change on LandFAO · Change in mean land-surface temperature against the country's own 1951–1980 average, °Ctop 6%2.412025
- Tree Cover LossWorld Resources Institute — Global Forest Watch (data: University of Maryland) · Tree cover loss (hectares, where canopy cover exceeded 30% in 2000)bottom 6%02025
- Water Withdrawal by SectorFAO · Freshwater withdrawn for agriculture (% of total)171st of 171position · derived02022
- World Risk IndexInstitute for International Law of Peace and Armed Conflict (IFHV), Ruhr University Bochum · WorldRiskIndex score (0–100, where 100 is the most at risk)193rd of 193position · derived · 1 = worst0.182025
Gender & Equality3
- Female-Headed HouseholdsUN DESA Population Division · Households headed by a woman (% of households)top 28%40.582026
- Mean Age at First Marriage, WomenUN DESA Population Division · Singulate mean age at marriage, women (years)top 15%30.42019
- Sex Ratio at BirthUN DESA Population Division · Male births per 100 female birthsbottom 43%104.92023
Peace & Security5
- Civilian Deaths in Organized ViolenceUCDP · Civilians killed in organized violence (people)top 37%02025
- Deaths in Non-State ConflictUCDP · Deaths in non-state conflict (people)top 43%02025
- Deaths in Organized ViolenceUCDP · Deaths in organized violence (people)59th of 59position · derived · 1 = worst02025
- Deaths in State-Based Armed ConflictUCDP · Deaths in state-based armed conflict (people)top 39%02025
- Political Stability and Absence of ViolenceWorld Bank Group · Political Stability estimate (−2.5 to 2.5)22nd of 211position · derived1.2532025
Risk & Resilience2
- Asylum-Seekers by Country of AsylumUNHCR, the UN Refugee Agency · Asylum-seekers awaiting a decision, end of year (people)bottom 5%02025
- Refugee Population by Country of AsylumUNHCR, the UN Refugee Agency · Refugees under UNHCR's mandate hosted, end of year (people)bottom 13%172025
Mobility & Trade4
- EmigrantsUN DESA Population Division · Migrants from the country living abroad, mid-year (people)bottom 24%36,6822024
- International MigrantsUN DESA Population Division · International migrants living in the country, mid-year (people)bottom 19%27,1062024
- Net Migration RateUN DESA Population Division · Net migrants per 1,000 populationtop 28%2.2592023
Digital & Technology3
- GitHub DevelopersGitHub · Developer accounts located in the economy (as of quarter end)bottom 17%3,2562026
- GitHub Git PushesGitHub · Git pushes during the quarterbottom 10%6,9252025
- GitHub RepositoriesGitHub · Public repositories located in the economy (as of quarter end)bottom 18%4,9772026
People & Population15
- Average Household SizeUN DESA Population Division · Average number of usual residents per household (people)bottom 1%2.132026
- Crude Birth RateUN DESA Population Division · Births per 1,000 populationbottom 24%9.4412023
- Crude Death RateUN DESA Population Division · Deaths per 1,000 populationtop 1%20.972023
- Mean Age at ChildbearingUN DESA Population Division · Mean age of mothers at the birth of their children (years)top 19%30.852023
- Median Age of the PopulationUN DESA Population Division · Median age (years)top 1%54.362023
- One-Person HouseholdsUN DESA Population Division · Households with exactly one member (% of households)top 5%37.692026
- Population Aged 65 and OverUN DESA Population Division · Share of the total population aged 65 and over (%)top 1%36.362023
- Population DensityUN DESA Population Division · People per square kilometre of landtop 1%26,1452023
- Population Growth RateUN DESA Population Division · Population growth (% per year)bottom 5%-0.9222023
- Population Living in Cities (Degree of Urbanisation)UN DESA Population Division · Share of the population living in cities as the Degree of Urbanisation defines them (%)top 1%1002025
- Population Under Age 15UN DESA Population Division · Share of the total population aged 0–14 (%)bottom 5%13.182023
- Sex Ratio of the Total PopulationUN DESA Population Division · Males per 100 femalesbottom 27%95.882023
- Total Dependency RatioUN DESA Population Division · People aged 0–14 and 65+ per 100 people aged 15–64top 1%98.162023
- Total Fertility RateUN DESA Population Division · Live births per womantop 46%2.112023
06Method
Sources and how to read them
How to read this page
- The scores and ranks belong to their publishers. Nothing is adjusted, rescaled or re-ranked; each is reproduced from the edition named beside it. Where a row says position · derived, the publisher ranks nobody on that measure and the position is ours, made by ordering the published score.
- Each statistic shows its newest edition, which is not always the edition the Country Index uses: the index pins every source to one data year so its average compares like with like.
How a standing is built from percentiles, why Monaco can move because other countries moved, and why publishers measure between 120 and 215 countries each are set out in full in how a standing is made and what a standing cannot tell you.
Sources
- Statistics: 26 publishers, each named beside its numbers, with every edition and licence on the datasets pages.
- Capital, languages, currency, codes: Wikidata, public domain (CC0).
- Map and land borders: Natural Earth, public domain. Borders are de facto — where administration actually changes — not claimed.
Photographs
The photograph of Monaco on this page comes from Wikimedia Commons and is shown in greyscale. The photographer and the licence are named beside each one.
Cite this page
Nations Inquiry (2026). Monaco: country statistics, rankings and trends. https://nationsinquiry.com/countries/monaco