UN IGME · Neonatal Mortality Rate
Neonatal mortality rate by country
How many newborn babies die in their first four weeks of life?
Of the 200 countries compared in 2024, San Marino had the lowest reading, 0.54429, and South Sudan had the highest reading, 39.46577. In the middle country the figure was 8.13406. Among the 92 countries measured in every edition since 1969, the middle one moved from 33.94080 to 8.79083.
Neonatal mortality rate · 2024
Context statistic

Lowest of 200San Marino
0.54429012024 · position · derived
Who leads
The three countries at the lowest end of 200 compared, the three at the other end, and the first on each continent.
 1
1Photo: Matl derivative work: Jjtkk · CC BY-SA 3.0, greyscale
 2
2Photo: zedlik , cropped by Jjtkk · CC BY-SA 3.0, greyscale
 3
3Photo: Dirk.heldmaier Derivative work by Globe-trotter · CC BY-SA 3.0, greyscale

Highest in 2024
 South Sudan39.46577
 Nigeria39.04572
 Pakistan36.09850
Where a country sits says how it compares with the others measured, and nothing about why.
Lowest on each continent
- Africa
 Libya5.20452
 - Americas
 Turks and Caicos Islands2.41937
 - Asia
 Japan0.86775
 - EuropeSan Marino0.54429
- Oceania
 Australia2.27641
 - Every region
02Every measured country
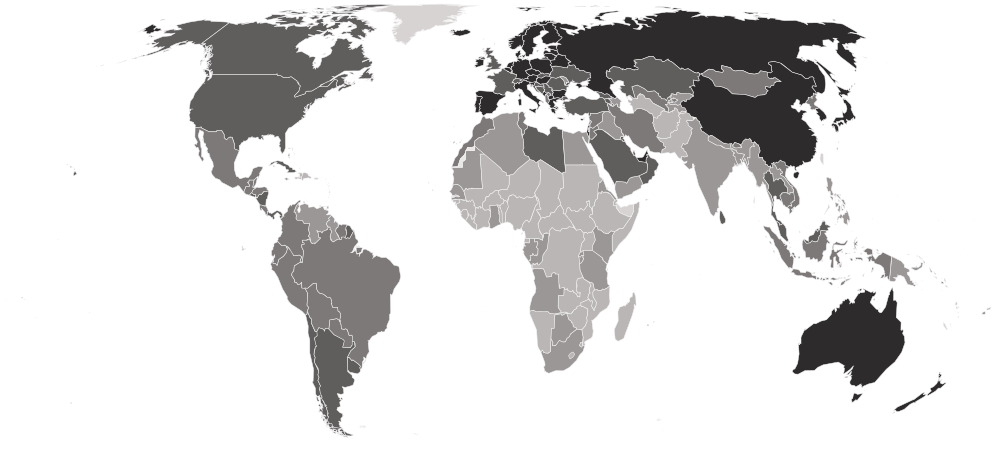
Neonatal mortality rate on a map
Each country is shaded by its value, in five groups holding the same number of countries. Hover a country for its value, or select it to open its profile. Below the map, each continent’s middle country.
Darker is a lower value — the better end.
- 21.24212–39.46577
- 10.46108–20.94180
- 6.26354–9.99649
- 2.75067–5.83860
- 0.54429–2.70973
- No reading in 2024
- Europe
2.17531
the middle country, of 43 measured · 49 members
San Marino0.54429 Moldova12.32640
Lowest and highest reading in Europe.
- Americas
7.30255
the middle country, of 39 measured · 48 members
Turks and Caicos Islands2.41937 Dominica31.06531
Lowest and highest reading in Americas.
- Asia
7.36128
the middle country, of 48 measured · 52 members
Japan0.86775Pakistan36.09850Lowest and highest reading in Asia.
- Oceania
8.83744
the middle country, of 16 measured · 21 members
Australia2.27641 Kiribati21.71298
Lowest and highest reading in Oceania.
- Africa
22.77072
the middle country, of 54 measured · 55 members
Libya5.20452South Sudan39.46577Lowest and highest reading in Africa.
- Every region
22 sub-regions, lowest middle country first
- Northern Europe
1.42104
the middle country, of 10 measured · 13 members
 Estonia0.94624
 United Kingdom3.04190
Lowest and highest reading in Northern Europe.
- Southern Europe
1.80318
the middle country, of 15 measured · 17 members
San Marino0.54429 Albania6.73519
Lowest and highest reading in Southern Europe.
- Western Europe
2.25813
the middle country, of 8 measured · 9 members
 Monaco1.39921
 France2.83730
Lowest and highest reading in Western Europe.
- Eastern Europe
2.52495
the middle country, of 10 measured · 10 members
 Belarus0.74102Moldova12.32640
Lowest and highest reading in Eastern Europe.
- Eastern Asia
2.59426
the middle country, of 5 measured · 8 members
Japan0.86775 North Korea8.94465
Lowest and highest reading in Eastern Asia.
- Western Asia
5.00861
the middle country, of 18 measured · 19 members
 Israel1.71477
 Yemen20.88917
Lowest and highest reading in Western Asia.
- Polynesia
7.03270
the middle country, of 5 measured · 7 members
 Tonga4.14642
 Niue12.43356
Lowest and highest reading in Polynesia.
- South America
7.05969
the middle country, of 12 measured · 12 members
 Uruguay4.04886
 Guyana15.27914
Lowest and highest reading in South America.
- Central America
7.76754
the middle country, of 8 measured · 8 members
 El Salvador4.33506
 Guatemala9.45334
Lowest and highest reading in Central America.
- Caribbean
8.99239
the middle country, of 17 measured · 24 members
Turks and Caicos Islands2.41937Dominica31.06531Lowest and highest reading in Caribbean.
- South-eastern Asia
9.15697
the middle country, of 11 measured · 11 members
 Singapore1.08205
 Timor-Leste21.60673
Lowest and highest reading in South-eastern Asia.
- Central Asia
10.79440
the middle country, of 5 measured · 5 members
 Kazakhstan3.94253
 Turkmenistan22.33632
Lowest and highest reading in Central Asia.
- Micronesia
11.62426
the middle country, of 5 measured · 7 members
 Nauru4.47141Kiribati21.71298
Lowest and highest reading in Micronesia.
- Northern Africa
11.75064
the middle country, of 6 measured · 6 members
Libya5.20452 Sudan23.71119
Lowest and highest reading in Northern Africa.
- Southern Asia
15.26957
the middle country, of 9 measured · 9 members
 Maldives3.67024Pakistan36.09850
Lowest and highest reading in Southern Asia.
- Southern Africa
21.37811
the middle country, of 5 measured · 5 members
 South Africa12.44044
 Lesotho28.49093
Lowest and highest reading in Southern Africa.
- Eastern Africa
21.79125
the middle country, of 18 measured · 19 members
 Seychelles8.34158South Sudan39.46577
Lowest and highest reading in Eastern Africa.
- Middle Africa
23.61863
the middle country, of 9 measured · 9 members
 São Tomé and Príncipe6.40399
 Chad30.38784
Lowest and highest reading in Middle Africa.
- Western Africa
27.29157
the middle country, of 16 measured · 16 members
 Cabo Verde8.03560Nigeria39.04572
Lowest and highest reading in Western Africa.
- Australia and New Zealand
2 of 2 measured — too few for a middle: Australia, New Zealand.
Australia2.27641 New Zealand2.67237
Lowest and highest reading in Australia and New Zealand.
- Melanesia
4 of 5 measured — too few for a middle: Fiji, Papua New Guinea, Solomon Islands, Vanuatu.
 Solomon Islands8.00271
 Papua New Guinea20.06767
Lowest and highest reading in Melanesia.
- Northern America
2 of 4 measured — too few for a middle: Canada, United States.
 Canada3.38895
 United States3.65238
Lowest and highest reading in Northern America.
03The whole field at once
The spread
200 countries, one dot each, on one scale — further right is a higher value. Half the countries are above 8.13406; a quarter are above 17.95154, and a quarter below 3.52427. The bar in each row marks that continent’s middle country.
04All 200 ever measured
Every country
In order, highest value first — position 1 is the highest value, the way UN IGME’s own tables read. “=” marks a position shared with another country. UN Inter-agency Group for Child Mortality Estimation (UN IGME) ranks nobody on this measure; the position is derived here by ordering the published values. Nothing ties: the estimates carry full precision. Where a country has little registration data its bounds are wide, so two countries a few positions apart may not differ in any way the evidence can show. For India, the Democratic People's Republic of Korea and Nicaragua, IGME notes that its figures are not the countries' official statistics.
Showing 25 of 200 countries


















































































































































Values for 2024. The change column compares 2024 with 2023 only; the sparkline covers the recent editions.
051969–2024 · 56 reference years
Over time
Each point is one year, from 1969 — the first year IGME's estimates cover enough countries to compare. These are modelled estimates, re-estimated in full at every IGME release, and each carries published uncertainty bounds.
- the middle country
- the middle half of countries
- the middle of the 92 countries measured every time
- each continent’s middle country
The same, year by year
| Year | Countries | Middle country | Middle half | Measured every time |
|---|---|---|---|---|
| 2024 | 200 | 8.13406 | 3.52427 – 17.95154 | 8.79083 |
| 2023 | 200 | 8.41202 | 3.41949 – 18.17115 | 9.06315 |
| 2022 | 200 | 8.73607 | 3.47019 – 18.55087 | 9.30131 |
| 2021 | 200 | 8.99197 | 3.50714 – 19.12232 | 9.53164 |
| 2020 | 200 | 9.23873 | 3.49013 – 19.59130 | 9.72160 |
| 2019 | 200 | 9.55617 | 3.75697 – 20.13222 | 9.80676 |
| 2018 | 200 | 9.59589 | 3.76575 – 20.65745 | 10.09902 |
| 2017 | 200 | 9.73321 | 3.83526 – 21.46034 | 10.32059 |
| 2016 | 200 | 10.07048 | 4.04669 – 22.51660 | 10.39353 |
| 2015 | 200 | 10.50508 | 4.21654 – 23.25434 | 10.52697 |
| 2014 | 200 | 10.74982 | 4.42045 – 23.32606 | 10.61026 |
| 2013 | 200 | 10.81237 | 4.50962 – 23.18775 | 10.67714 |
| 2012 | 200 | 10.81308 | 4.69296 – 23.31775 | 10.81308 |
| 2011 | 200 | 10.85333 | 4.66944 – 23.19408 | 10.87074 |
| 2010 | 200 | 11.35936 | 4.70560 – 23.67229 | 11.19848 |
| 2009 | 200 | 11.65805 | 4.87450 – 24.30165 | 11.61304 |
| 2008 | 200 | 12.05901 | 4.93278 – 25.04638 | 12.07147 |
| 2007 | 200 | 12.51509 | 5.11502 – 24.99111 | 12.51509 |
| 2006 | 200 | 12.91077 | 5.32571 – 25.96497 | 12.91077 |
| 2005 | 200 | 13.11600 | 5.52062 – 26.98014 | 13.35069 |
| 2004 | 200 | 13.61700 | 5.70073 – 27.26208 | 13.83093 |
| 2003 | 200 | 14.01747 | 5.89717 – 27.96567 | 14.18238 |
| 2002 | 200 | 14.41452 | 6.14957 – 28.91557 | 14.50758 |
| 2001 | 200 | 15.11693 | 6.36078 – 29.33331 | 15.12869 |
| 2000 | 200 | 15.66180 | 6.56775 – 29.77661 | 15.66666 |
| 1999 | 200 | 16.19333 | 7.00320 – 30.30655 | 15.96818 |
| 1998 | 200 | 16.58152 | 7.51568 – 30.89614 | 16.26265 |
| 1997 | 200 | 16.98678 | 7.87605 – 31.55569 | 16.76245 |
| 1996 | 200 | 17.67848 | 8.35051 – 32.36789 | 17.28207 |
| 1995 | 200 | 18.29563 | 8.59035 – 33.35072 | 17.86720 |
| 1994 | 200 | 18.71630 | 9.26301 – 34.29277 | 18.10768 |
| 1993 | 200 | 18.96418 | 9.67888 – 34.45127 | 17.85578 |
| 1992 | 200 | 19.65912 | 9.91931 – 35.35555 | 18.48022 |
| 1991 | 200 | 19.84439 | 10.21994 – 36.33374 | 19.57796 |
| 1990 | 200 | 20.60183 | 10.63721 – 37.28905 | 21.13190 |
| 1989 | 200 | 21.14478 | 10.96503 – 38.03986 | 22.26081 |
| 1988 | 155 | 22.71482 | 9.53557 – 39.56628 | 22.69596 |
| 1987 | 153 | 23.42214 | 10.02360 – 40.05397 | 23.32972 |
| 1986 | 150 | 23.83050 | 10.71990 – 40.55012 | 23.96292 |
| 1985 | 146 | 24.01843 | 10.95874 – 41.03843 | 24.60722 |
| 1984 | 142 | 24.40044 | 11.05943 – 42.89944 | 25.30688 |
| 1983 | 140 | 24.85318 | 11.18979 – 44.03302 | 26.05995 |
| 1982 | 136 | 25.25778 | 11.91217 – 44.16422 | 26.73920 |
| 1981 | 128 | 26.27680 | 13.27936 – 45.21445 | 27.65467 |
| 1980 | 127 | 27.21032 | 14.29002 – 47.10161 | 28.61708 |
| 1979 | 125 | 28.09571 | 15.49734 – 47.34334 | 29.38981 |
| 1978 | 122 | 28.19405 | 15.31264 – 48.06877 | 30.00782 |
| 1977 | 121 | 29.67920 | 15.78178 – 49.76310 | 30.57828 |
| 1976 | 115 | 28.27759 | 15.66728 – 51.13623 | 31.14090 |
| 1975 | 113 | 28.77439 | 16.00555 – 51.83708 | 31.71533 |
| 1974 | 110 | 32.30489 | 17.10426 – 52.99011 | 32.30489 |
| 1973 | 107 | 32.30101 | 17.99626 – 54.35129 | 32.34722 |
| 1972 | 104 | 30.25782 | 18.18469 – 53.47362 | 32.42302 |
| 1971 | 100 | 31.10216 | 18.01564 – 54.85566 | 32.50875 |
| 1970 | 96 | 31.97785 | 18.79566 – 55.12755 | 33.18627 |
| 1969 | 92 | 33.94080 | 18.81545 – 56.06549 | 33.94080 |
062023 → 2024
Who rose and fell
The biggest changes in value between the two newest editions — reference years recalculated in one report, not two separate publications. Places are shown second, because they also move when other countries do.
Improved most
before → after Nicaragua7.09631 → 5.30994 · 112th → 124th−1.78637
- Pakistan37.03377 → 36.09850 · 3rd → 3rd−0.93527
 India17.53567 → 16.65925 · 54th → 54th−0.87642
 Panama6.13338 → 5.29536 · 122nd → 125th−0.83802
 Afghanistan33.90410 → 33.13673 · 5th → 6th−0.76736
Worsened most
before → after Lebanon10.15943 → 10.46108 · 81st → 80th+0.30165
 Costa Rica7.05065 → 7.30255 · 114th → 108th+0.25190
 Romania3.38159 → 3.62318 · 152nd → 149th+0.24159
- South Africa12.20636 → 12.44044 · 73rd → 70th+0.23408
 Cyprus2.49405 → 2.70973 · 169th → 161st+0.21568
200 countries were measured in both 2023 and 2024.
07Across every edition
Neonatal mortality rate in records
The extremes of the statistic. A record reached by more than one country names none of them.
Highest reading on record
99.52710
Deaths in the first 28 days (per 1,000 live births)
Lowest reading on record
0.54429
Deaths in the first 28 days (per 1,000 live births)
Biggest improvement between editions
−7.81999
63.43335 → 55.61336
Biggest decline between editions
+5.27078
37.30060 → 42.57139
Most improved since first measured
−74.81262
92.72500 → 17.91238
At the top most often
25 of 56
editions, alone at the first-listed end
08The measure
About neonatal mortality rate
The neonatal mortality rate is how many babies out of every thousand born alive die in their first 28 days. Most deaths in the first year of life happen in this first month, which makes it the measure most directly tied to care at birth — a skilled attendant, a clean delivery, warmth, and help with breathing and infection.
What the number is: Deaths in the first 28 days (per 1,000 live births).
09Where it fits
Connections
Its part in the Country Index, the statistics whose values line up most closely with it across countries, and others on the same subject.
In the Country Index
Context, with no vote
This statistic is published in full under Health & Wellbeing and Development & Human Capital, but does not help decide any Country Index standing.
Health & WellbeingDevelopment & Human CapitalWhich statistics vote, and why
Moves with
Where neonatal mortality rate is higher, these tend to be higher too.
- Infant Mortality RateUN IGME · 200 countries in commonρ 0.99
- Under-Five Mortality RateKeyUN IGME · 200 countries in commonρ 0.98
- Stillbirth RateUN IGME · 200 countries in commonρ 0.93
Moves against
Where neonatal mortality rate is higher, these tend to be lower.
- Inequality-adjusted Human Development IndexUNDP Human Development Report Office · 168 countries in commonρ −0.92
- Human Capital IndexWorld Bank Group · 170 countries in commonρ −0.90
- Human Development IndexKeyUNDP Human Development Report Office · 191 countries in commonρ −0.88
Rank correlation (ρ, from −1 to 1) across countries, on each statistic’s newest edition, out of 312 statistics sharing at least 80 countries with this one. Two statistics that move together do not cause each other.
10Keep reading
Explore further
The countries at either end
11Questions
Neonatal mortality rate: questions and answers
Which country has the lowest neonatal mortality rate?
San Marino, at 0.54429, among the 200 countries compared in 2024.
Which country has the highest neonatal mortality rate?
South Sudan, at 39.46577, among the 200 countries compared in 2024.
How many countries does the Neonatal Mortality Rate cover?
200 in 2024. The number measured varies from 92 to 200 between editions.
What is the world average neonatal mortality rate?
This site does not calculate a world average, which would depend on how countries are weighted. In the middle country of the 200 compared in 2024, the figure was 8.13406.
Is this UN Inter-agency Group for Child Mortality Estimation (UN IGME)’s own ranking?
No. UN Inter-agency Group for Child Mortality Estimation (UN IGME) publishes the values but ranks nobody; the position on this page is derived by Nations Inquiry by ordering the published values, and equal values share a position.
How often is the Neonatal Mortality Rate published?
This site holds 56 reference years, 1969–2024, all recalculated in UN Inter-agency Group for Child Mortality Estimation (UN IGME)’s 2025 report on one method — not 56 separate publications.
Where does the data come from, and can I download it?
From UN Inter-agency Group for Child Mortality Estimation (UN IGME), under CC BY 3.0 IGO. From the UN Inter-agency Group for Child Mortality Estimation, read out of UNICEF’s own SDMX warehouse (CME_MRM0) — the same route as under-five and infant mortality — rather than the World Bank’s copy, which rounds to one decimal. Every edition is on this site’s Datasets pages as a full table, and downloads as a CSV file with every value unrounded.
12Method
Sources, method and citation
Source
Neonatal Mortality Rate — UN Inter-agency Group for Child Mortality Estimation (UN IGME)
From the UN Inter-agency Group for Child Mortality Estimation, read out of UNICEF’s own SDMX warehouse (CME_MRM0) — the same route as under-five and infant mortality — rather than the World Bank’s copy, which rounds to one decimal.
Newest edition
Report year 2024Data year 2024
Cite the source as: UN Inter-agency Group for Child Mortality Estimation. Levels and Trends in Child Mortality. New York: UNICEF.
Licence: CC BY 3.0 IGO, checked 2026-09-29.
How this page reads the numbers
- UN Inter-agency Group for Child Mortality Estimation (UN IGME) ranks nobody on this measure. The position is derived by Nations Inquiry by ordering the published values; equal values share a position.
- Which end is better follows the publisher’s own reading of the measure.
- A country is named at an end only when it holds that value alone. Where several share it, the page says how many and names none first.
- Values are stored exactly as published and trimmed only for display. “The middle country” is the median of the countries measured, not a world average.
The file itself, column by column — where it came from, what each column holds, and every edition as a CSV — is on its dataset page.
Photographs
The countries at the top of this statistic, from their profiles: Wikimedia Commons, shown in greyscale, each used under the licence named.
- San Marino — Matl derivative work: Jjtkk, CC BY-SA 3.0
- Belarus — zedlik , cropped by Jjtkk, CC BY-SA 3.0
- Montenegro — Dirk.heldmaier Derivative work by Globe-trotter, CC BY-SA 3.0
Cite this page
Nations Inquiry (2026). Neonatal mortality rate by country: Neonatal Mortality Rate, data from UN Inter-agency Group for Child Mortality Estimation (UN IGME). https://nationsinquiry.com/statistics/neonatal-mortality