Loading…
UNDP Human Development Report Office · Human Development Index
Human Development Index by country
How long, how educated and how prosperous are people's lives?
Iceland placed first of the 193 countries compared in 2023, at 0.972, and South Sudan last, at 0.388. In the middle country the figure was 0.762. Among the 140 countries measured in every edition since 1990, the middle one moved from 0.640 to 0.777.
Human Development Index · 2023
Key statistic · Development & Human Capital

Highest of 193Iceland
0.972012023 · UNDP Human Development Report Office’s rank
Who leads
The three countries at the highest end of 193 compared, the three at the other end, and the first on each continent.
 1
1Photo: Hansueli Krapf · CC BY-SA 3.0, greyscale
 2
2Photo: Simon Koopmann derivative work: Jjtkk · CC BY-SA 2.0 de, greyscale
 3
3Photo: Ximonic , Simo Räsänen · CC BY-SA 3.0, greyscale

Lowest in 2023
- 193
 South Sudan0.388
 - 192
 Somalia0.404
 - 191
 Central African Republic0.414
Ranks out of 193. Where a country sits says how it compares with the others measured, and nothing about why.
02Every measured country
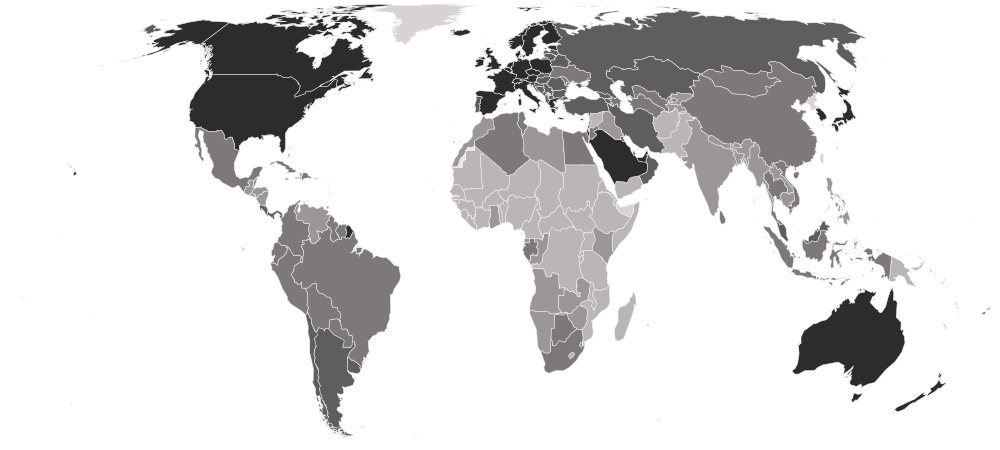
Human Development Index on a map
Each country is shaded by its value, in five groups holding the same number of countries. Hover a country for its value, or select it to open its profile. Below the map, each continent’s middle country.
Darker is a higher value — the better end.
- 0.388–0.588
- 0.595–0.721
- 0.722–0.798
- 0.799–0.899
- 0.900–0.972
- No reading in 2023
- Europe
0.914
the middle country, of 42 measured · 49 members
Iceland0.972 Ukraine0.779
Highest and lowest reading in Europe.
- Americas
0.786
the middle country, of 35 measured · 48 members
 Canada0.939
 Haiti0.554
Highest and lowest reading in Americas.
- Asia
0.766
the middle country, of 48 measured · 52 members
 Hong Kong0.955
 Yemen0.470
Highest and lowest reading in Asia.
- Oceania
0.706
the middle country, of 14 measured · 21 members
 Australia0.958
 Papua New Guinea0.576
Highest and lowest reading in Oceania.
- Africa
0.567
the middle country, of 54 measured · 55 members
 Seychelles0.848South Sudan0.388
Highest and lowest reading in Africa.
- Every region
22 sub-regions, highest middle country first
- Northern Europe
0.948
the middle country, of 10 measured · 13 members
Iceland0.972 Latvia0.889
Highest and lowest reading in Northern Europe.
- Western Europe
0.944
the middle country, of 8 measured · 9 members
 Switzerland0.970
 France0.920
Highest and lowest reading in Western Europe.
- Eastern Asia
0.925
the middle country, of 5 measured · 8 members
Hong Kong0.955 Mongolia0.747
Highest and lowest reading in Eastern Asia.
- Southern Europe
0.899
the middle country, of 14 measured · 17 members
 Slovenia0.931
 Bosnia and Herzegovina0.804
Highest and lowest reading in Southern Europe.
- Western Asia
0.848
the middle country, of 18 measured · 19 members
 United Arab Emirates0.940Yemen0.470
Highest and lowest reading in Western Asia.
- Eastern Europe
0.845
the middle country, of 10 measured · 10 members
 Czechia0.915Ukraine0.779
Highest and lowest reading in Eastern Europe.
- Caribbean
0.791
the middle country, of 13 measured · 24 members
 Antigua and Barbuda0.851Haiti0.554
Highest and lowest reading in Caribbean.
- South America
0.782
the middle country, of 12 measured · 12 members
 Chile0.878
 Venezuela0.709
Highest and lowest reading in South America.
- Central Asia
0.740
the middle country, of 5 measured · 5 members
 Kazakhstan0.837
 Tajikistan0.691
Highest and lowest reading in Central Asia.
- Northern Africa
0.734
the middle country, of 6 measured · 6 members
 Algeria0.763
 Sudan0.511
Highest and lowest reading in Northern Africa.
- South-eastern Asia
0.728
the middle country, of 11 measured · 11 members
 Singapore0.946
 Cambodia0.606
Highest and lowest reading in South-eastern Asia.
- Central America
0.714
the middle country, of 8 measured · 8 members
 Panama0.839
 Honduras0.645
Highest and lowest reading in Central America.
- Micronesia
0.703
the middle country, of 5 measured · 7 members
 Palau0.786
 Micronesia0.615
Highest and lowest reading in Micronesia.
- Southern Africa
0.695
the middle country, of 5 measured · 5 members
 South Africa0.741
 Lesotho0.550
Highest and lowest reading in Southern Africa.
- Southern Asia
0.685
the middle country, of 9 measured · 9 members
 Iran0.799
 Afghanistan0.496
Highest and lowest reading in Southern Asia.
- Middle Africa
0.616
the middle country, of 9 measured · 9 members
 Gabon0.733Central African Republic0.414
Highest and lowest reading in Middle Africa.
- Eastern Africa
0.536
the middle country, of 18 measured · 19 members
Seychelles0.848South Sudan0.388Highest and lowest reading in Eastern Africa.
- Western Africa
0.520
the middle country, of 16 measured · 16 members
 Cabo Verde0.668
2 share 0.419
Highest and lowest reading in Western Africa.
- Australia and New Zealand
2 of 2 measured — too few for a middle: Australia, New Zealand.
Australia0.958 New Zealand0.938
Highest and lowest reading in Australia and New Zealand.
- Melanesia
4 of 5 measured — too few for a middle: Fiji, Papua New Guinea, Solomon Islands, Vanuatu.
 Fiji0.731Papua New Guinea0.576
Highest and lowest reading in Melanesia.
- Northern America
2 of 4 measured — too few for a middle: Canada, United States.
Canada0.939 United States0.938
Highest and lowest reading in Northern America.
- Polynesia
3 of 7 measured — too few for a middle: Samoa, Tonga, Tuvalu.
 Tonga0.769
 Tuvalu0.689
Highest and lowest reading in Polynesia.
03The whole field at once
The spread
193 countries, one dot each, on one scale — further right is a higher value. Half the countries are above 0.762; a quarter are above 0.862, and a quarter below 0.622. The bar in each row marks that continent’s middle country.
04All 193 ever measured
Every country
In order, highest value first. “=” marks a rank shared with another country. Only 2023 carries UNDP’s official rank. The earlier years are ordered here by score — a derivation checked against UNDP’s own 2023 ranking, row for row, before it was trusted.
Showing 25 of 193 countries











































































































































Values for 2023. The change column compares 2023 with 2022 only; the sparkline covers the recent editions.
051990–2023 · 34 reference years
Over time
Each point is one reference year, 1990 to 2023. The line is genuinely comparable end to end: UNDP recalculated every year on today’s method, so a rise is real progress rather than a change of formula.
- the middle country
- the middle half of countries
- the middle of the 140 countries measured every time
- each continent’s middle country
The same, year by year
| Year | Countries | Middle country | Middle half | Measured every time |
|---|---|---|---|---|
| 2023 | 193 | 0.762 | 0.622 – 0.862 | 0.777 |
| 2022 | 192 | 0.761 | 0.624 – 0.853 | 0.775 |
| 2021 | 192 | 0.745 | 0.615 – 0.841 | 0.762 |
| 2020 | 192 | 0.742 | 0.615 – 0.845 | 0.764 |
| 2019 | 192 | 0.752 | 0.614 – 0.853 | 0.774 |
| 2018 | 192 | 0.752 | 0.612 – 0.851 | 0.774 |
| 2017 | 192 | 0.748 | 0.609 – 0.846 | 0.769 |
| 2016 | 192 | 0.750 | 0.608 – 0.843 | 0.766 |
| 2015 | 192 | 0.743 | 0.604 – 0.839 | 0.766 |
| 2014 | 192 | 0.741 | 0.595 – 0.838 | 0.763 |
| 2013 | 192 | 0.739 | 0.584 – 0.831 | 0.756 |
| 2012 | 192 | 0.735 | 0.577 – 0.827 | 0.750 |
| 2011 | 192 | 0.725 | 0.569 – 0.822 | 0.747 |
| 2010 | 191 | 0.725 | 0.563 – 0.819 | 0.744 |
| 2009 | 187 | 0.722 | 0.559 – 0.823 | 0.733 |
| 2008 | 188 | 0.718 | 0.555 – 0.816 | 0.730 |
| 2007 | 187 | 0.710 | 0.552 – 0.807 | 0.724 |
| 2006 | 186 | 0.704 | 0.548 – 0.800 | 0.718 |
| 2005 | 186 | 0.696 | 0.538 – 0.798 | 0.712 |
| 2004 | 175 | 0.696 | 0.543 – 0.807 | 0.704 |
| 2003 | 173 | 0.691 | 0.529 – 0.798 | 0.698 |
| 2002 | 172 | 0.685 | 0.513 – 0.792 | 0.692 |
| 2001 | 171 | 0.677 | 0.508 – 0.786 | 0.690 |
| 2000 | 171 | 0.672 | 0.501 – 0.778 | 0.682 |
| 1999 | 153 | 0.668 | 0.496 – 0.773 | 0.674 |
| 1998 | 149 | 0.666 | 0.507 – 0.770 | 0.667 |
| 1997 | 149 | 0.661 | 0.500 – 0.761 | 0.662 |
| 1996 | 149 | 0.657 | 0.495 – 0.753 | 0.658 |
| 1995 | 149 | 0.654 | 0.488 – 0.747 | 0.654 |
| 1994 | 142 | 0.648 | 0.492 – 0.746 | 0.649 |
| 1993 | 142 | 0.644 | 0.490 – 0.737 | 0.646 |
| 1992 | 141 | 0.639 | 0.487 – 0.735 | 0.641 |
| 1991 | 141 | 0.642 | 0.491 – 0.738 | 0.643 |
| 1990 | 141 | 0.638 | 0.491 – 0.736 | 0.640 |
062022 → 2023
Who rose and fell
The biggest changes in value between the two newest editions — reference years recalculated in one report, not two separate publications. Places are shown second, because they also move when other countries do.
Improved most
before → after Andorra0.893 → 0.913 · 37th → 32nd+0.020
- Somalia0.385 → 0.404 · 192nd → 192nd+0.019
- United Arab Emirates0.921 → 0.940 · 23rd → 15th+0.019
 Côte d’Ivoire0.565 → 0.582 · 162nd → 157th+0.017
 Nepal0.605 → 0.622 · 150th → 145th+0.017
192 countries were measured in both 2022 and 2023. The field changed from 192 to 193 countries, so a place can move for reasons that have nothing to do with the country itself.
07Across every edition
Human Development Index in records
The extremes of the statistic. A record reached by more than one country names none of them.
Highest reading on record
0.972
HDI score (0–1)
Lowest reading on record
0.215
HDI score (0–1)
Biggest improvement between editions
+0.107
0.279 → 0.386
Biggest decline between editions
−0.112
0.391 → 0.279
Most improved since first measured
+0.306
0.491 → 0.797
At the top most often
25 of 34
editions, alone at the first-listed end
08The parts of the index
Inside the number
UNDP Human Development Report Office publishes the parts the headline is built from. Each part’s highest and lowest country, and its middle value.
| Part | Highest | Lowest | Middle country |
|---|---|---|---|
| Life Expectancy at Birth (years)193 countries |  San Marino85.706 San Marino85.706 |  Nigeria54.462 Nigeria54.462 | 73.490 |
| Expected Years of Schooling193 countries |  Greece20.846 Greece20.846 | South Sudan5.635 | 13.336 |
| Mean Years of Schooling193 countries |  Germany14.29637 Germany14.29637 |  Niger1.41229 Niger1.41229 | 9.93302 |
| GNI per Capita (2021 PPP $)193 countries |  Liechtenstein166,812 Liechtenstein166,812 | South Sudan688 | 15,867 |
09The measure
About Human Development Index
The Human Development Index rates a country on more than its income — life expectancy, years of schooling and income per person, folded into a single score from 0 to 1. UNDP has published it since 1990, and it is still the most widely cited development measure in the world.
What the number is: HDI score (0–1).
What it does not measure
It says nothing about how evenly health, schooling and income are shared, and nothing about political freedom or the environmental cost of development. The inequality-adjusted and planetary-pressures versions on this site cover the first and last.
10Where it fits
Connections
Its part in the Country Index, the statistics whose values line up most closely with it across countries, and others on the same subject.
In the Country Index
A key statistic for Development & Human Capital
“The standard composite of health, schooling and income, carrying UNDP's own published rank.”
- Edition used
- 2023 (data 2023)
- Countries
- 193
- Licence
- CC BY 3.0 IGO
Moves with
Where Human Development Index is higher, these tend to be higher too.
- Inequality-adjusted Human Development IndexUNDP Human Development Report Office · 169 countries in commonρ 0.98
- GNI per Capita (PPP)World Bank Group · 101 countries in commonρ 0.97
- GDP per Capita (PPP)KeyWorld Bank Group · 181 countries in commonρ 0.96
Moves against
Where Human Development Index is higher, these tend to be lower.
- Gender Inequality IndexKeyUNDP Human Development Report Office · 172 countries in commonρ −0.93
- Global Multidimensional Poverty IndexOPHI · 103 countries in commonρ −0.93
- Informal Employment RateILO · 96 countries in commonρ −0.91
Rank correlation (ρ, from −1 to 1) across countries, on each statistic’s newest edition, out of 127 statistics sharing at least 80 countries with this one. Two statistics that move together do not cause each other.
11Analysis
Charts and analysis on Human Development Index


_banner_Panorama.jpg)
12Keep reading
Explore further
The countries at either end
13Questions
Human Development Index: questions and answers
Which country has the highest Human Development Index?
Iceland, at 0.972, among the 193 countries compared in 2023.
Which country has the lowest Human Development Index?
South Sudan, at 0.388, among the 193 countries compared in 2023.
How many countries does the Human Development Index cover?
193 in 2023. The number measured varies from 141 to 193 between editions.
What is the world average Human Development Index?
This site does not calculate a world average, which would depend on how countries are weighted. In the middle country of the 193 compared in 2023, the figure was 0.762.
Is this UNDP Human Development Report Office’s own ranking?
Yes. The rank shown is the one UNDP Human Development Report Office publishes.
How often is the Human Development Index published?
This site holds 34 reference years, 1990–2023, all recalculated in UNDP Human Development Report Office’s 2025 report on one method — not 34 separate publications.
Where does the data come from, and can I download it?
From UNDP Human Development Report Office, under CC BY 3.0 IGO. Imported from the 2025 Human Development Report’s composite-indices time series, one file covering every year at once. These are that report’s restatement of history, not what earlier reports printed at the time. Every edition is available on this site’s Datasets pages as a full table, unrounded.
14Method
Sources, method and citation
Source
Human Development Index — UNDP Human Development Report Office
Imported from the 2025 Human Development Report’s composite-indices time series, one file covering every year at once. These are that report’s restatement of history, not what earlier reports printed at the time.
Newest edition
Report year 2023Data year 2023
Cite the source as: UNDP (United Nations Development Programme). Human Development Report. New York: UNDP.
Licence: CC BY 3.0 IGO, checked 2026-08-29.
How this page reads the numbers
- The rank is UNDP Human Development Report Office’s own, as published.
- Which end is better follows the publisher’s own reading of the measure.
- A country is named at an end only when it holds that value alone. Where several share it, the page says how many and names none first.
- Values are stored exactly as published and trimmed only for display. “The middle country” is the median of the countries measured, not a world average.
The full note on this data
34 data years (1990–2023), imported from the 2025 Human Development Report's own composite-indices time series — one file covering every year at once, like World Happiness and Rule of Law. ⚠ This is ONE report's self-consistent recalculation of 1990–2023, not 34 separate originally-published editions: UNDP restates prior years on its current methodology each time it publishes, so these numbers are not what an earlier report actually printed for, say, 2005. UNDP states an official rank only for the latest year (2023); every other year's rank is derived by ordering the score, and that derivation was verified to reproduce UNDP's own 2023 ranking exactly before being trusted for the rest.
Photographs
The countries at the top of this statistic, from their profiles: Wikimedia Commons, shown in greyscale, each used under the licence named.
- Iceland — Hansueli Krapf, CC BY-SA 3.0
- Switzerland — Simon Koopmann derivative work: Jjtkk, CC BY-SA 2.0 de
- Norway — Ximonic , Simo Räsänen, CC BY-SA 3.0
Cite this page
Nations Inquiry (2026). Human Development Index by country: Human Development Index, data from UNDP Human Development Report Office. https://nationsinquiry.com/statistics/human-development-index