
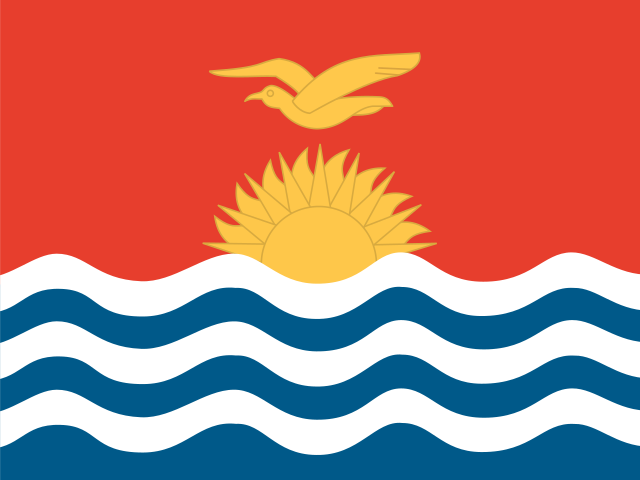
Photo: Photo taken by Government of Kiribati employee in the course of their work · CC BY 3.0 · via Wikimedia Commons, shown in greyscale
Kiribati
Kiribati places highest on Civic Space Ratings (top 1% worldwide) and lowest on Inbound Mobility Rate, Tertiary (bottom 1%).
Share
Kiribati in the Nations Inquiry Country Index
At a glance
Population
132,530
people
since 1950
Land area
811
km²
since 1961
GDP per person
3,364
international $, PPP
since 1990
Life expectancy
66.47
years at birth
since 1950
Human development
0.644
HDI, 0–1
since 2005
The newest published figure for each, the year it describes and who published it, with a line showing how it has moved.
01The country
About Kiribati
No other country reaches into all four hemispheres: Kiribati’s islands straddle the equator, from the Gilberts in the west through the Phoenix group to the Line Islands far to the east. Kiritimati is the coral atoll with the largest land area on earth. Most land barely clears the high tide, and fresh water comes from a thin lens beneath the sand. In 1995 the country moved the date line east, so all its islands share one calendar day.
Voyagers settled the Gilberts in the deep past. The name Kiribati renders ‘Gilberts’, after Thomas Gilbert, a British captain who sailed through in 1788. Britain ruled the islands from 1892, and phosphate mining from 1900 stripped Banaba, a raised island to the west; in 1945 most Banabans were moved to Rabi Island in Fiji. In November 1943 American marines took Betio, on Tarawa, from its Japanese garrison in one of the Pacific war’s bloodiest battles. Independence came in July 1979.
The maneaba, a great open meeting house, is where a village debates, feasts and dances, each family seated at its ancestral place. Dancers stretch their arms like the frigatebird on the national flag. Babai, a giant swamp taro, grows in pits dug down to the fresh water, and toddy is tapped from coconut flower stalks. Copra and seaweed are exported, licences for foreign tuna fleets fill much of the budget, and seafarers trained on Tarawa crew merchant ships and send wages home.
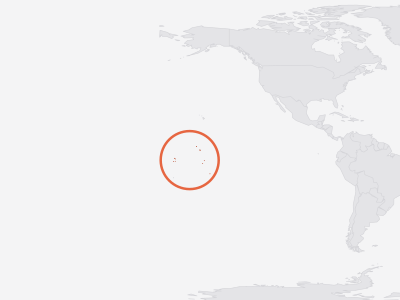
Key facts about Kiribati
- Capital
- South Tarawa
- Official languages
- English, Gilbertese
- Currencies
- Kiribati dollar, Australian dollar (AUD)
- ISO code
- KIR · KI
- Domain · dialling
- .ki · +686
As Wikidata records them. Official languages are the least consistent — some countries list only a national language, others every regional one. Sources and licences.
02Country Index 2026
Where it stands, topic by topic
Strongest first. Each position is Kiribati’s place among the countries with a standing on that topic, built from a few key statistics chosen to measure different things.
12thof 159
From 2 of 3 key statistics
29thof 198
From 3 of 4 key statistics
47thof 183
From 2 of 4 key statistics
101stof 193
From 3 of 4 key statistics
92ndof 165
From 2 of 3 key statistics
116thof 198
From 3 of 4 key statistics
126thof 184
From 2 of 4 key statistics
141stof 200
From 4 of 4 key statistics
139thof 196
From 3 of 3 key statistics
157thof 194
From 2 of 4 key statistics
173rdof 198
From 3 of 4 key statistics
162ndof 176
From 2 of 4 key statistics
No standing — Kiribati holds too few of this subject’s key statistics to be placed on it.
No standing — Kiribati holds too few of this subject’s key statistics to be placed on it.
No standing — Kiribati holds too few of this subject’s key statistics to be placed on it.
No standing — Kiribati holds too few of this subject’s key statistics to be placed on it.
Each standing is built from a few key statistics chosen to measure different things. Select a subject for Kiribati’s readings on it, or see every statistic held for Kiribati in the table further down this page.
03Highs and lows
Where Kiribati stands out
The two ends of its own record: every statistic on which Kiribati sits within ten places of the best or worst in the world, plus its strongest and weakest readings overall. Each is turned into a percentile — its place among every country measured — which is what lets a hunger score and a press-freedom rank be compared at all.
Where Kiribati does best10
In the top third of all countries measured. 10 are within ten places of the best in the world, in a field of at least 50 countries — marked with that place.
- 1st
- 1st
Position · derived 1st of 123 · 16.39 · 2023
world median 3.709 (better)
- 1st
Position · derived 1st of 179 · 62.9 · 2025
world median 19.16 (better)
- 1stDeaths in Organized Violencetop 35%
Position · derived 59th of 59 · 1 = worst · 0 · 2025
world median 0
- 2nd
Position · derived 2nd of 60 · 10.19 · 2023
world median 7.12 (better) · ▲ 10 pts since 2019
- 3rd
Position · derived 188th of 190 · 1 = worst · 0.24 · 2023
world median 1.565 (better)
- 4thGini Indextop 5%
Position · derived 57th of 60 · 1 = worst · 24.74 · 2023
world median 33.72 (better) · ▲ 9 pts since 2019
- 4th
Position · derived 57th of 60 · 1 = worst · 20.91 · 2023
world median 26.18 (better) · ▲ 9 pts since 2019
- 4thPalma Ratiotop 5%
Position · derived 57th of 60 · 1 = worst · 0.849 · 2023
world median 1.332 (better) · ▲ 8 pts since 2019
- 6th
Position · derived 6th of 181 · 61.6 · 2026
world median 35.12 (better)
Where Kiribati struggles most10 of 13
In the bottom third of all countries measured. 13 are within ten places of the worst in the world, in a field of at least 50 countries — marked with that place.
- 1stInbound Mobility Rate, Tertiarybottom 1%
Position · derived 75th of 75 · 0 · 2024
world median 5.494 (worse)
- 2ndBachelor's or Higher Attainmentbottom 1%
Position · derived 89th of 90 · 1.756 · 2023
world median 19.86 (worse)
- 2ndViolent Discipline of Childrenbottom 1%
Position · derived 2nd of 90 · 1 = worst · 92.1 · 2025
world median 75.8 (worse)
- 3rdBribery Incidencebottom 1%
Position · derived 3rd of 175 · 1 = worst · 48.11 · 2026
world median 7.269 (worse)
- 3rd
Position · derived 113th of 115 · 9.302 · 2025
world median 37.57 (worse)
- 3rdTertiary Enrolment Ratiobottom 2%
Position · derived 93rd of 95 · 4.961 · 2024
world median 52.77 (worse)
- 5thUpper Secondary Attainmentbottom 4%
Position · derived 91st of 95 · 13.94 · 2023
world median 65.76 (worse) · ▼ 3 pts since 2018
- 6thFirms with Their Own Websitebottom 3%
Position · derived 176th of 181 · 13.93 · 2026
world median 62.39 (worse)
- 6th
Position · derived 6th of 125 · 1 = worst · 70.2 · 2025
world median 22.4 (worse)
- 7th
Position · derived 7th of 163 · 1 = worst · 25.49 · 2026
world median 9.485 (worse)
3 more in every statistic for Kiribati.
A band is a place among the countries each publisher scores, so Kiribati can move because other countries moved. See the Country Index for the full method.
04Over time
Which way it is moving
The published rank in widely quoted reports, edition by edition — each end with the size of that year’s field.
Human Development Index
UNDP Human Development Report Office
129th
of 186 · 2005
140th
of 193 · 2023
Ranked in 19 of 34 editions
Government AI Readiness Index
Oxford Insights
166th
of 172 · 2020
150th
of 195 · 2025
Ranked in 5 of 6 editions
05In context
Kiribati and its neighbours
A position reads best beside the countries around it. Every position below is a place in the world ranking of 183, not within the region.
Shares a land border with
Kiribati has no land border with another country.
Placed either side in the Country Index 2026






Across Micronesia
Every country in the sub-region, by its position in the world (of 183 placed).
- 109Kiribati
- —
 Guamnot placed
- —
 Marshall Islandsnot placed
- —
 Micronesianot placed
- —
 Naurunot placed
- —
 Northern Mariana Islandsnot placed
- —
 Palaunot placed
06The evidence
Every statistic we hold for Kiribati
Grouped by topic. Each row gives the newest edition’s rank or position, the published value and the year the numbers describe. Select a statistic for this country’s row beside every other country, the world median and every edition.
Governance & Institutions21
- Bribery IncidenceWorld Bank Group · Firms asked for a bribe at least once in six dealings with officials (%)3rd of 175position · derived · 1 = worst48.112026
- Child and Family Benefit CoverageILO · Children or households with children receiving child or family cash benefits (%)bottom 12%1.32024
- Civic Space RatingsCIVICUS · Civic space score (0–100)1st of 198position · derived1002025
- Climate Readiness (ND-GAIN)Notre Dame Global Adaptation Initiative (ND-GAIN), University of Notre Dame · ND-GAIN Readiness (0–1, where 1 is the most ready)110th of 192rank0.3732024
- Completeness of Birth RegistrationUNICEF · Children under 5 whose birth is registered (%)bottom 33%91.62025
- Control of CorruptionWorld Bank Group · Control of Corruption (−2.5 to 2.5)79th of 211position · derived0.2972025
- Country Policy and Institutional AssessmentWorld Bank Group · IDA Resource Allocation Index (1 = low to 6 = high)58th of 78position · derived2.8922025
- Firms Expecting to Make Informal Payments to Public OfficialsWorld Bank Group · Firms saying firms like theirs pay officials informally to get things done (%)102nd of 178position · derived · 1 = worst5.5292026
- Global Indicators of Regulatory Governance ScoreWorld Bank Group · Regulatory governance score (0–5, where 5 is the most transparent rule-making)bottom 19%12018
- Government AI Readiness IndexOxford Insights · AI readiness score (0–100)150th of 195rank23.92025
- Government EffectivenessWorld Bank Group · Governance estimate (−2.5 weak to 2.5 strong)138th of 209position · derived-0.3652025
- Government Spending on EducationUIS · Government expenditure on education (% of GDP)1st of 123position · derived16.392023
- GovTech Maturity IndexWorld Bank Group · GTMI score (0–1)168th of 196position · derived0.2542025
- Old-Age Pension CoverageILO · People above statutory pensionable age receiving an old-age pension (%)top 39%93.82025
- Regulatory QualityWorld Bank Group · Regulatory Quality (−2.5 to 2.5)132nd of 209position · derived-0.4192025
- Rule of LawWorld Bank Group · Rule of Law estimate (−2.5 to 2.5)45th of 211position · derived0.8712025
- Senior Management Time Spent on Government RegulationWorld Bank Group · Senior management time spent dealing with government regulation (% of a typical week)bottom 1%0.1352026
- Statistical Performance IndicatorsWorld Bank Group · SPI overall score (0–100)163rd of 188position · derived50.042024
- Voice and AccountabilityWorld Bank Group · Voice and Accountability estimate (−2.5 to 2.5)38th of 206position · derived1.0352025
- Women, Business and the LawWorld Bank Group · WBL Index (0–100, where 100 is full legal parity)118th of 190position · derived76.252025
Economy & Innovation29
- Commodity Export DependenceUNCTAD · Commodity exports (% of merchandise exports, three-year average)top 25%88.792024
- Crop Production IndexFAO · Crop production index (2014–2016 = 100)149th of 195position · derived95.752022
- Digitally-Deliverable Services ExportsUNCTAD · Digitally-deliverable services exports (% of services exports)155th of 170position · derived5.2272024
- Export Concentration IndexUNCTAD · Export concentration index (0–1, normalised Herfindahl–Hirschman)top 3%0.8042025
- Firms Competing Against Informal FirmsWorld Bank Group · Firms competing against unregistered or informal firms (%)64th of 181position · derived · 1 = worst50.782026
- Firms with a Bank Loan or Line of CreditWorld Bank Group · Firms with a bank loan or line of credit (%)146th of 179position · derived16.112025
- Firms with an International Quality CertificationWorld Bank Group · Firms with an internationally recognised quality certification (%)bottom 2%0.3932026
- Food Production IndexFAO · Food production index (2014–2016 = 100)158th of 195position · derived97.322022
- Foreign Direct Investment InflowsUNCTAD · FDI inflows (% of GDP)bottom 33%1.1962025
- GDP GrowthWorld Bank Group · GDP growth (annual %)67th of 186position · derived4.2222025
- GDP per Capita (PPP)World Bank Group · GDP per capita (constant 2021 international $, PPP)164th of 185position · derived3,3642025
- Gini IndexWorld Bank Group · Gini index (0 = perfect equality, 100 = perfect inequality)57th of 60position · derived · 1 = worst24.742023
- Gini Index of Disposable Income (SWIID)Frederick Solt, University of Iowa · Gini index of disposable household income (0–100), SWIID estimate56th of 79position · derived · 1 = worst30.42023
- Gross Savings (% of GDP)World Bank Group · Gross savings (% of GDP)125th of 146position · derived12.852024
- Inflation, GDP DeflatorWorld Bank Group · Annual change in the GDP implicit deflator (%)bottom 11%0.0092025
- Liner Shipping Connectivity IndexUNCTAD · LSCI (index, average Q1 2023 = 100)151st of 175rank15.462026
- Livestock Production IndexFAO · Livestock production index (2014–2016 = 100)76th of 194position · derived112.732022
- Management Practices IndexWorld Bank Group · Management practices index, medium and large firms (0–100)49th of 169position · derived57.562026
- Merchant Fleet by Country of OwnershipUNCTAD · Merchant fleet owned (thousand dead-weight tons)bottom 12%2.3182026
- Palma RatioWorld Bank Group · Palma ratio (income share of the richest 10% ÷ share of the poorest 40%)57th of 60position · derived · 1 = worst0.8492023
- Productive Capacities IndexUNCTAD · Productive Capacities Index (1–100)131st of 195position · derived41.152022
- Scholarly ArticlesOurResearch · Articles with at least one author at an institution in the country (full counting)bottom 1%12025
- Services ExportsUNCTAD · Services exports (% of GDP)bottom 14%2.482025
- Statutory Minimum WageILO · Statutory minimum wage per month (2021 PPP $)bottom 25%289.372024
- Tax Revenue (% of GDP)OECD · Total tax revenue, all levels of government (% of GDP)bottom 34%17.832024
- Terms of Trade IndexUNCTAD · Terms of trade index (2015 = 100)bottom 49%102.362025
- Total Natural Resources Rents (% of GDP)World Bank Group · Natural resources rents (% of GDP)159th of 180position · derived0.0442021
Work & Labour8
- Compliance with Labour RightsILO · Compliance with freedom of association and collective bargaining rights (0 = best, 10 = worst)top 22%0.562024
- Employment Injury Protection CoverageILO · Labour force covered in the event of a work injury (%)bottom 38%32.82024
- Firms Offering Formal TrainingWorld Bank Group · Firms offering formal training to permanent full-time workers (%)bottom 13%12.142026
- Firms with a Female Top ManagerWorld Bank Group · Firms with a female top manager (%)1st of 179position · derived62.92025
- Informal Employment RateILO · Informal employment (% of total employment)35th of 97position · derived · 1 = worst59.252025
- Length of Paid Maternity LeaveWorld Bank Group · Paid maternity leave set in law (calendar days)bottom 24%842025
- Length of Paid Paternity LeaveWorld Bank Group · Paid paternity leave set in law (calendar days)bottom 19%02025
- Unemployment Benefit CoverageILO · Unemployed people receiving unemployment benefits (%)bottom 26%02024
Education & Knowledge27
- Adult Literacy RateUIS · Adults 15+ who can read and write (%)39th of 172position · derived98.612024
- Bachelor's or Higher AttainmentUIS · Adults 25+ who completed a bachelor's degree or higher (%)89th of 90position · derived1.7562023
- Expected Years of SchoolingUNDP Human Development Report Office · Expected years of schooling139th of 195position · derived11.872023
- Gender Parity Index, Tertiary EnrolmentUIS · Adjusted gender parity index, tertiary gross enrolment (1 = parity)89th of 95position · derived1.5592024
- Harmonized Test ScoresWorld Bank Group · Harmonized test score (TIMSS-equivalent points; 300 = minimum, 625 = advanced attainment)91st of 172position · derived411.482020
- Inbound Mobility Rate, TertiaryUIS · Inbound mobility rate, tertiary (%)75th of 75position · derived02024
- Intergenerational Persistence in EducationWorld Bank Group · Correlation between own and parents' years of schooling, born 1980–89 (0–1)133rd of 153position · derived · 1 = worst0.3132017
- Learning-Adjusted Years of SchoolWorld Bank Group · Learning-adjusted years of school (0–14)96th of 172position · derived7.3822020
- Lower Secondary Completion RateUIS · Lower secondary completion rate (%)94th of 164position · derived81.082025
- Mean Years of SchoolingUNDP Human Development Report Office · Mean years of schooling (adults 25+)108th of 193position · derived9.1292023
- Minimum Proficiency in Mathematics, End of PrimaryUIS · Pupils at the end of primary reaching minimum proficiency in mathematics (%)top 43%53.122023
- Minimum Proficiency in Reading, End of PrimaryUIS · Pupils at the end of primary reaching minimum proficiency in reading (%)bottom 9%13.752023
- Out-of-School Rate, Lower Secondary AgeUIS · Out-of-school rate, lower secondary age (%)59th of 116position · derived · 1 = worst6.1652024
- Out-of-School Rate, PrimaryUIS · Out-of-school rate, primary age (%)36th of 121position · derived · 1 = worst8.712024
- Pre-Primary Net Enrolment RateUIS · Net enrolment rate, pre-primary (%)26th of 120position · derived91.942024
- Primary Completion RateUIS · Primary completion rate (%)98th of 165position · derived94.392025
- Primary Schools with ElectricityUIS · Primary schools with access to electricity (%)bottom 21%87.632024
- Primary Schools with Internet for TeachingUIS · Primary schools with internet access for teaching (%)bottom 14%13.42024
- Pupils per Qualified Teacher, PrimaryUIS · Primary pupils per qualified teacher (headcount basis)39th of 92position · derived · 1 = worst24.152024
- Qualified Teachers in Primary EducationUIS · Primary teachers with the minimum qualifications their country requires (%)bottom 40%89.372024
- School Life ExpectancyUIS · School life expectancy, primary to tertiary (years)55th of 77position · derived13.422024
- Secondary School EnrolmentUIS · Gross secondary enrolment ratio (%)69th of 109position · derived90.282024
- Tertiary Enrolment RatioUIS · Gross enrolment ratio, tertiary (%)93rd of 95position · derived4.9612024
- Upper Secondary AttainmentUIS · Adults 25+ who completed upper secondary or higher (%)91st of 95position · derived13.942023
- Upper Secondary Completion RateUIS · Upper secondary completion rate (%)138th of 164position · derived21.422025
- Wealth Parity Index, Lower Secondary CompletionUIS · Adjusted wealth parity index, lower secondary completion (poorest vs richest fifth; 1 = parity)top 40%0.6922024
- Youth Literacy RateUIS · 15–24 year-olds who can read and write (%)bottom 25%90.442024
Health & Wellbeing48
- Adolescent Birth Rate (Ages 15–19)UN DESA Population Division · Live births per 1,000 women aged 15–1976th of 222position · derived · 1 = worst44.032023
- Adult Mortality (Probability of Dying Between 15 and 60)UN DESA Population Division · Deaths before age 60 per 1,000 people alive at 15, at that year's death rates56th of 222position · derived · 1 = worst195.182023
- Antenatal Care Coverage, At Least Four VisitsUNICEF · Women with a live birth who had 4+ antenatal visits (%)109th of 153position · derived672025
- Caesarean Section RateUNICEF · Live births delivered by caesarean section (%)bottom 25%9.32025
- Care-Seeking for Children with Symptoms of PneumoniaUNICEF · Children under 5 with pneumonia symptoms taken to a health provider (%)18th of 127position · derived86.52024
- Children with Functional DifficultiesUNICEF · Children aged 5-17 with a functional difficulty (%)top 11%22.52024
- Coefficient of Variation of Habitual Caloric ConsumptionFAO · Coefficient of variation of habitual calorie consumption across the population (standard deviation ÷ mean)bottom 34%0.282024
- Contraceptive Prevalence (Any Method)UN DESA Population Division · Share of all women aged 15–49 using any contraceptive method (%)bottom 15%23.52023
- Days Above 35°CECMWF · Days a year with a maximum temperature above 35°C, averaged over the country’s landtop 16%02025
- Demand for Family Planning Satisfied by Modern MethodsUN DESA Population Division · Share of women aged 15–49 wanting to avoid pregnancy who use a modern method (%)164th of 196position · derived48.82023
- Dietary Energy SupplyFAO · Dietary energy supply (kcal per person per day)61st of 155position · derived3,1412024
- Early Initiation of BreastfeedingUNICEF · Newborns put to the breast within one hour of birth (%)92nd of 136position · derived45.62024
- Exclusive Breastfeeding Under Six MonthsUNICEF · Infants under 6 months exclusively breastfed (%)17th of 136position · derived63.592024
- Fish and Seafood Supply per PersonFAO · Fish and seafood available as food (kg per person per year, live-weight equivalent)top 1%72.282023
- Fruit Supply per PersonFAO · Fruit available as food, excluding wine (kg per person per year)bottom 35%69.72023
- Global Multidimensional Poverty IndexOPHI · MPI (0–1)48th of 109position · derived · 1 = worst0.082025
- HPV Vaccination Coverage, GirlsWUENIC · Girls in the target group given the final dose of HPV vaccine (%)top 11%912025
- Human Capital IndexWorld Bank Group · HCI score (0–1)115th of 172position · derived0.4932020
- Human Development IndexUNDP Human Development Report Office · HDI score (0–1)140th of 193rank0.6442023
- Immunisation Coverage, DTP3WUENIC · Infants given a third dose of DTP vaccine (%)bottom 39%872025
- Immunisation Coverage, Measles First Dose (MCV1)WUENIC · Infants given a first dose of measles vaccine (%)bottom 33%842025
- Infant Mortality RateUN IGME · Deaths before age one (per 1,000 live births)28th of 200position · derived · 1 = worst38.812024
- Institutional DeliveriesUNICEF · Live births delivered in a health facility (%)bottom 27%86.12025
- Life Expectancy at Age 65UN DESA Population Division · Further years a 65-year-old would live at current death rates193rd of 222position · derived13.442023
- Life Expectancy at BirthUN DESA Population Division · Years a newborn would live at current death rates184th of 222position · derived66.472023
- Low Birthweight PrevalenceUNICEF and WHO (Joint Low Birthweight Estimates) · Live births weighing under 2,500 g (%)93rd of 158position · derived · 1 = worst9.0312020
- Maternal Mortality RatioMMEIG · Maternal deaths per 100,000 live births74th of 195position · derived · 1 = worst79.762023
- Meat Supply per PersonFAO · Meat available as food (kg per person per year, carcass weight)bottom 40%45.092023
- Minimum Dietary Diversity, Children Aged 6–23 MonthsUNICEF · Children aged 6-23 months fed from at least 5 of 8 food groups (%)113th of 115position · derived9.3022025
- Modern Contraceptive PrevalenceUN DESA Population Division · Share of all women aged 15–49 using a modern contraceptive method (%)bottom 18%19.52023
- Mortality Rate, Ages 5–14UN IGME · Deaths between ages 5 and 14 (per 1,000 children aged 5)29th of 200position · derived · 1 = worst9.7692024
- Neonatal Mortality RateUN IGME · Deaths in the first 28 days (per 1,000 live births)35th of 200position · derived · 1 = worst21.712024
- Oral Rehydration Salts for Children with DiarrhoeaUNICEF · Children under 5 with diarrhoea given oral rehydration salts (%)23rd of 127position · derived61.32024
- Overweight Prevalence in Children Under FiveUNICEF, WHO and World Bank Group (Joint Malnutrition Estimates) · Children under 5 who are overweight (%)151st of 163position · derived · 1 = worst2.1152024
- Pesticide Use per HectareFAO · Pesticide use (kg per hectare of cropland)115th of 178position · derived0.982024
- PM2.5 Air Pollution ExposureAtmospheric Composition Analysis Group, Washington University in St. Louis · Population-weighted PM2.5 concentration (µg/m³)209th of 220position · derived · 1 = worst3.82023
- Postnatal Care for Newborns Within Two DaysUNICEF · Newborns with a health check within 2 days of birth (%)39th of 109position · derived91.42025
- Prevalence of Moderate or Severe Food InsecurityFAO · Population in moderate or severe food insecurity (%)33rd of 135position · derived · 1 = worst43.92024
- Prevalence of Severe Food InsecurityFAO · Population in severe food insecurity (%)65th of 119position · derived · 1 = worst4.82024
- Prevalence of UndernourishmentFAO · Population undernourished (%)92nd of 104position · derived · 1 = worst4.12023
- Severe Child Food Poverty, Children Aged 6–23 MonthsUNICEF · Children aged 6-23 months fed from at most 2 of 8 food groups (%)19th of 113position · derived · 1 = worst34.472024
- Stillbirth RateUN IGME · Stillbirths (per 1,000 total births)93rd of 200position · derived · 1 = worst8.582023
- Stunting Prevalence in Children Under FiveUNICEF, WHO and World Bank Group (Joint Malnutrition Estimates) · Children under 5 who are stunted (%)76th of 162position · derived · 1 = worst15.182024
- Under-Five Mortality RateUN IGME · Deaths before age five (per 1,000 live births)25th of 200position · derived · 1 = worst53.092024
- Vegetable Supply per PersonFAO · Vegetables available as food (kg per person per year)bottom 20%44.372023
- Violent Discipline of ChildrenUNICEF · Children aged 1-14 experiencing violent discipline (%)2nd of 90position · derived · 1 = worst92.12025
- Wasting Prevalence in Children Under FiveUNICEF, WHO and World Bank Group (Joint Malnutrition Estimates) · Children under 5 who are wasted (%)83rd of 163position · derived · 1 = worst3.5352024
Development & Human Capital15
- Access to ElectricityWorld Bank Group · Population with electricity access (%)bottom 33%97.72024
- Child MarriageUNICEF · Women 20–24 married before 18 (%)67th of 143position · derived · 1 = worst18.42025
- Coefficient of Human InequalityUNDP Human Development Report Office · Coefficient of Human Inequality (%)89th of 169position · derived · 1 = worst16.632023
- Gender Development IndexUNDP Human Development Report Office · Gender Development Index (1.000 = parity)74th of 184position · derived0.9762023
- Inequality-adjusted Human Development IndexUNDP Human Development Report Office · IHDI (0–1)104th of 169position · derived0.5352023
- Multidimensional Poverty MeasureWorld Bank Group · Multidimensional poverty headcount ratio (%)104th of 157position · derived · 1 = worst1.6492025
- Net Official Development Assistance ReceivedOECD Development Assistance Committee · Net ODA received (% of GNI)6th of 130position · derived20.562023
- Poverty Gap at $3.00 a DayWorld Bank Group · Poverty gap at $3.00 a day, 2021 PPP (%)46th of 59position · derived · 1 = worst0.12023
- Poverty Headcount at $3.00 a Day, Line-up EstimatesWorld Bank Group · Population below $3.00 a day, 2021 PPP, World Bank line-up estimate (%)top 31%0.612024
- Poverty Headcount Ratio at $3.00 a DayWorld Bank Group · Population below $3.00 a day, 2021 PPP (%)30th of 58position · derived · 1 = worst0.932023
- Poverty Headcount Ratio at $4.20 a DayWorld Bank Group · Population below $4.20 a day, 2021 PPP (%)22nd of 59position · derived · 1 = worst5.692023
- Poverty Headcount Ratio at $8.30 a DayWorld Bank Group · Population below $8.30 a day, 2021 PPP (%)10th of 59position · derived · 1 = worst52.022023
- Poverty Severity (Squared Poverty Gap) at $3.00 a DayWorld Bank Group · Squared poverty gap at $3.00 a day, 2021 PPP (0–100)top 13%0.022023
- Prosperity GapWorld Bank Group · Average factor incomes must rise by to reach $28 a day14th of 60position · derived · 1 = worst3.7522023
Environment & Sustainability29
- Agricultural EmissionsFAO · Farm-gate emissions (kt CO₂eq)183rd of 193position · derived18.32023
- Agricultural Emissions IntensityFAO · Greenhouse gases from farming per value of agricultural output (kg CO₂eq per international dollar)188th of 190position · derived · 1 = worst0.242023
- Agricultural LandFAO · Agricultural land (% of land area)91st of 209position · derived41.982023
- Annual Forest Area Change RateFAO · Compound annual change in forest area over the interval ending that year (%)top 49%02025
- Arable Land per PersonFAO · Arable land (hectares per person)183rd of 206position · derived0.0152023
- Carbon Intensity of ElectricityEmber · Carbon intensity (gCO₂e per kWh generated)73rd of 165position · derived · 1 = worst5002024
- Climate Vulnerability (ND-GAIN)Notre Dame Global Adaptation Initiative (ND-GAIN), University of Notre Dame · ND-GAIN Vulnerability (0–1, where 1 is the most vulnerable)153rd of 190rank0.5282024
- CO₂ Emissions per CapitaGlobal Carbon Project · Fossil CO₂ (tonnes per person)176th of 210position · derived · 1 = worst0.5392024
- Coal Share of Electricity GenerationEmber · Coal (% of electricity generated)top 32%02024
- Cropland Nitrogen BalanceFAO · Nitrogen surplus (+) or deficit (−) on cropland, kg per hectarebottom 1%-75.382023
- Energy Intensity of GDP (PPP)EIA · Energy use per dollar of GDP (thousand Btu per US$ at PPP)bottom 32%3.4862024
- Fertilizer Consumption per HectareFAO · Fertilizer consumption (kg per hectare of arable land)188th of 188position · derived02023
- Fisheries and Aquaculture ProductionFAO · Fish, crustaceans, molluscs and other aquatic animals caught or farmed, tonnes (live weight)top 25%278,5172024
- Forest AreaFAO · Forest area (% of land area)190th of 210position · derived1.4572023
- Livestock DensityFAO · Livestock units per hectare of agricultural land143rd of 188position · derived0.282023
- Low-Carbon Share of Electricity GenerationEmber · Low-carbon sources (% of electricity generated)99th of 162position · derived252024
- Mangrove AreaGlobal Mangrove Watch (Aberystwyth University, JAXA, soloEO, Wetlands International, The Nature Conservancy) · Mangrove forest area (hectares)bottom 25%270.832025
- Methane EmissionsEDGAR · Methane emissions (gigagrams of CH₄)bottom 8%1.0512025
- Municipal Solid Waste GenerationWorld Bank Group · Municipal solid waste generated (kg per person per day)188th of 201position · derived · 1 = worst0.3072026
- ND-GAIN Country IndexNotre Dame Global Adaptation Initiative (ND-GAIN), University of Notre Dame · ND-GAIN Index (0–100, where 100 is best placed to adapt)129th of 190rank42.292024
- Population Living Below 5 m ElevationCenter for International Earth Science Information Network (CIESIN), Columbia University · Population living below 5 m elevation (% of total population)top 4%33.532015
- Progress Toward Productive and Sustainable Agriculture (SDG 2.4.1 Proxy)FAO · Current status score, from 1 (worst) to 5 (best), averaged over up to seven sub-indicators158th of 186position · derived2.332024
- Renewable Share of Electricity GenerationEmber · Renewables (% of electricity generated)95th of 162position · derived252024
- Solar Electricity Installed CapacityEIA · Solar generating capacity installed (gigawatts)bottom 8%0.0022024
- Solar Share of Electricity GenerationEmber · Solar (% of electricity generated)top 2%252024
- Temperature Change on LandFAO · Change in mean land-surface temperature against the country's own 1951–1980 average, °Cbottom 14%1.0172025
- Tree Cover LossWorld Resources Institute — Global Forest Watch (data: University of Maryland) · Tree cover loss (hectares, where canopy cover exceeded 30% in 2000)bottom 6%02025
- Wind and Solar Share of Electricity GenerationEmber · Wind and solar (% of electricity generated)top 13%252024
- World Risk IndexInstitute for International Law of Peace and Armed Conflict (IFHV), Ruhr University Bochum · WorldRiskIndex score (0–100, where 100 is the most at risk)130th of 193position · derived · 1 = worst2.82025
Gender & Equality5
- Female-Headed HouseholdsUN DESA Population Division · Households headed by a woman (% of households)bottom 35%26.52026
- Firms with Female Participation in OwnershipWorld Bank Group · Firms with at least one woman among the owners (%)6th of 181position · derived61.62026
- Mean Age at First Marriage, WomenUN DESA Population Division · Singulate mean age at marriage, women (years)bottom 18%21.62019
- Sex Ratio at BirthUN DESA Population Division · Male births per 100 female birthstop 9%107.12023
- Women Who Think a Husband Is Justified in Hitting or Beating His WifeUNICEF · Women aged 15-49 who say a husband is justified in hitting or beating his wife (%)6th of 125position · derived · 1 = worst70.22025
Democracy & Civil Liberties1
- Perceptions of Electoral Integrity IndexEIP · Electoral Integrity Index (0–100; higher = greater electoral integrity)top 24%69.212025
Peace & Security7
- Civilian Deaths in Organized ViolenceUCDP · Civilians killed in organized violence (people)top 37%02025
- Deaths in Non-State ConflictUCDP · Deaths in non-state conflict (people)top 43%02025
- Deaths in Organized ViolenceUCDP · Deaths in organized violence (people)59th of 59position · derived · 1 = worst02025
- Deaths in State-Based Armed ConflictUCDP · Deaths in state-based armed conflict (people)top 39%02025
- INFORM Risk IndexEuropean Commission Joint Research Centre, with the Inter-Agency Standing Committee · INFORM Risk score (0–10, where 10 is the highest risk)98th of 191position · derived · 1 = worst3.62025
- Political Stability and Absence of ViolenceWorld Bank Group · Political Stability estimate (−2.5 to 2.5)23rd of 211position · derived1.2482025
- Refugees by Country of OriginUNHCR, the UN Refugee Agency · Refugees under UNHCR's mandate from this country, end of year (people)bottom 6%52025
Risk & Resilience2
- Firms Whose Assets Were Damaged by Extreme WeatherWorld Bank Group · Firms whose physical assets were damaged by extreme weather (%)7th of 163position · derived · 1 = worst25.492026
- Per Capita Food Supply VariabilityFAO · Year-to-year variability of the food supply (kcal per person per day)top 46%282024
Mobility & Trade4
- EmigrantsUN DESA Population Division · Migrants from the country living abroad, mid-year (people)bottom 13%6,3062024
- International MigrantsUN DESA Population Division · International migrants living in the country, mid-year (people)bottom 4%3,3022024
- Net Migration RateUN DESA Population Division · Net migrants per 1,000 populationbottom 15%-3.662023
Poverty & Inequality3
- Median Daily Income or Consumption per PersonWorld Bank Group · Median income or consumption per person, 2021 PPP dollars a day51st of 60position · derived8.0512023
- Poverty Headcount at National Poverty LinesWorld Bank Group · Population below the national poverty line (%)bottom 5%5.52025
- Societal Poverty RateWorld Bank Group · Population below the societal poverty line, 2021 PPP (%)36th of 60position · derived · 1 = worst15.852023
Money & Public Finance2
- Firms Using Banks to Finance InvestmentWorld Bank Group · Firms using banks to finance investment in fixed assets (%)bottom 32%18.632026
- Share of Firms' Payments Made ElectronicallyWorld Bank Group · Payments made electronically in a typical month, excluding payroll and payments to government (%)bottom 20%28.252026
Energy11
- Crude Oil ProductionEIA · Crude oil produced (thousand barrels per day)bottom 26%02025
- Firms Identifying Electricity as a Major ConstraintWorld Bank Group · Firms rating electricity a major or very severe constraint (%)41st of 179position · derived · 1 = worst41.772026
- Firms Owning or Sharing a GeneratorWorld Bank Group · Firms owning or sharing a generator (%)top 49%24.512026
- Gas Share of Electricity GenerationEmber · Natural gas (% of electricity generated)bottom 22%02024
- Hydro Share of Electricity GenerationEmber · Hydropower (% of electricity generated)bottom 13%02024
- Natural Gas ProductionEIA · Dry natural gas produced (billion cubic metres)bottom 27%02024
- Net Electricity Imports (share of generation)Ember · Net electricity imports (% of domestic generation)bottom 42%02024
- Nuclear Share of Electricity GenerationEmber · Nuclear (% of electricity generated)bottom 45%02024
- Photovoltaic Power Potential (PVOUT)World Bank Group (ESMAP), data by Solargis · Practical solar power potential (kWh per kWp per day, long-term average)top 17%4.8232020
- Primary Energy Consumption per CapitaEIA · Energy use per person (million Btu)bottom 21%9.1212024
- Primary Energy ProductionEIA · Primary energy produced (quadrillion Btu)bottom 5%02024
Digital & Technology4
- Firms Experiencing Internet DisruptionsWorld Bank Group · Firms that experienced internet outages or slow-downs (%)147th of 163position · derived · 1 = worst8.8362026
- Firms with Their Own WebsiteWorld Bank Group · Firms with their own website (%)176th of 181position · derived13.932026
- GitHub DevelopersGitHub · Developer accounts located in the economy (as of quarter end)bottom 3%5202026
- GitHub RepositoriesGitHub · Public repositories located in the economy (as of quarter end)bottom 2%4092026
People & Population15
- Average Household SizeUN DESA Population Division · Average number of usual residents per household (people)top 9%5.92026
- Crude Birth RateUN DESA Population Division · Births per 1,000 populationtop 22%25.812023
- Crude Death RateUN DESA Population Division · Deaths per 1,000 populationbottom 45%7.0462023
- Mean Age at ChildbearingUN DESA Population Division · Mean age of mothers at the birth of their children (years)bottom 49%29.082023
- Median Age of the PopulationUN DESA Population Division · Median age (years)bottom 27%22.692023
- One-Person HouseholdsUN DESA Population Division · Households with exactly one member (% of households)bottom 10%3.712026
- Population Aged 65 and OverUN DESA Population Division · Share of the total population aged 65 and over (%)bottom 25%4.1182023
- Population DensityUN DESA Population Division · People per square kilometre of landtop 31%182.552023
- Population Growth RateUN DESA Population Division · Population growth (% per year)top 32%1.5042023
- Population Living in Cities (Degree of Urbanisation)UN DESA Population Division · Share of the population living in cities as the Degree of Urbanisation defines them (%)bottom 8%02025
- Population Under Age 15UN DESA Population Division · Share of the total population aged 0–14 (%)top 24%34.932023
- Sex Ratio of the Total PopulationUN DESA Population Division · Males per 100 femalesbottom 18%94.042023
- Total Dependency RatioUN DESA Population Division · People aged 0–14 and 65+ per 100 people aged 15–64top 27%64.062023
- Total Fertility RateUN DESA Population Division · Live births per womantop 24%3.1472023
07Method
Sources and how to read them
How to read this page
- The scores and ranks belong to their publishers. Nothing is adjusted, rescaled or re-ranked; each is reproduced from the edition named beside it. Where a row says position · derived, the publisher ranks nobody on that measure and the position is ours, made by ordering the published score.
- Each statistic shows its newest edition, which is not always the edition the Country Index uses: the index pins every source to one data year so its average compares like with like.
How a standing is built from percentiles, why Kiribati can move because other countries moved, and why publishers measure between 120 and 215 countries each are set out in full in how a standing is made and what a standing cannot tell you.
Sources
- Statistics: 37 publishers, each named beside its numbers, with every edition and licence on the datasets pages.
- Capital, languages, currency, codes: Wikidata, public domain (CC0).
- Map and land borders: Natural Earth, public domain. Borders are de facto — where administration actually changes — not claimed.
Photographs
The photograph of Kiribati on this page comes from Wikimedia Commons and is shown in greyscale. The photographer and the licence are named beside each one.
Cite this page
Nations Inquiry (2026). Kiribati: country statistics, rankings and trends. https://nationsinquiry.com/countries/kiribati