FAO · Temperature Change on Land
Temperature change by country
How much warmer is a country's land than its 1951–1980 average?
Of the 190 countries compared in 2025, Kazakhstan had the highest reading, 3.294, and Solomon Islands had the lowest reading, 0.340. In the middle country the figure was 1.474. Among the 140 countries measured in every edition since 1961, the middle one moved from 0.072 to 1.436.
Temperature change · 2025
Context statistic

Highest of 190Kazakhstan
3.294012025 · values only
The highest and the lowest
The three countries with the highest values of 190 compared, the three with the lowest, and the highest on each continent. This statistic has no better end, so no country is shown as leading.
- 1
- 2

- 3

Lowest in 2025
 Solomon Islands0.340
 Botswana0.443
 Marshall Islands0.507
This statistic has no better end: the two ends describe size, not success.
02Every measured country
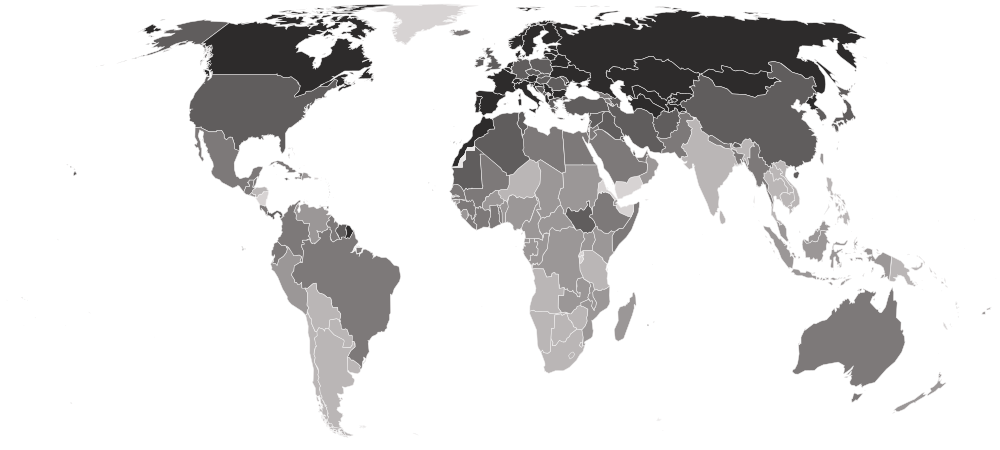
Temperature change on a map
Each country is shaded by its value, in five groups holding the same number of countries. Hover a country for its value, or select it to open its profile. Below the map, each continent’s middle country.
Darker is a higher value. This statistic has no better end, so the shades describe size, not success.
- 0.340–1.063
- 1.067–1.325
- 1.338–1.753
- 1.758–2.110
- 2.115–3.294
- No reading in 2025 (8 measured in an earlier edition)
- Europe
2.176
the middle country, of 44 measured · 49 members
 Finland2.941
 Iceland1.472
Highest and lowest reading in Europe.
- Asia
1.715
the middle country, of 48 measured · 52 members
Kazakhstan3.294 Vietnam0.817
Highest and lowest reading in Asia.
- Americas
1.398
the middle country, of 33 measured · 48 members
Canada2.955 Uruguay0.622
Highest and lowest reading in Americas.
- Africa
1.248
the middle country, of 51 measured · 55 members
 Morocco2.139Botswana0.443
Highest and lowest reading in Africa.
- Oceania
1.011
the middle country, of 14 measured · 21 members
 Australia1.397Solomon Islands0.340
Highest and lowest reading in Oceania.
- Every region
22 sub-regions, highest middle country first
- Central Asia
2.761
the middle country, of 5 measured · 5 members
Kazakhstan3.294 Turkmenistan2.233
Highest and lowest reading in Central Asia.
- Northern Europe
2.409
the middle country, of 11 measured · 13 members
Finland2.941Iceland1.472Highest and lowest reading in Northern Europe.
- Western Europe
2.190
the middle country, of 9 measured · 9 members
 Monaco2.410
 Germany2.106
Highest and lowest reading in Western Europe.
- Southern Europe
2.152
the middle country, of 14 measured · 17 members
 Andorra2.579
 Greece1.945
Highest and lowest reading in Southern Europe.
- Eastern Europe
2.043
the middle country, of 10 measured · 10 members
 Russia2.871
 Slovakia1.896
Highest and lowest reading in Eastern Europe.
- Eastern Asia
1.879
the middle country, of 8 measured · 8 members
 Mongolia2.372
2 share 1.010
Highest and lowest reading in Eastern Asia.
- Western Asia
1.787
the middle country, of 16 measured · 19 members
 Syria2.093
 Oman1.278
Highest and lowest reading in Western Asia.
- Northern Africa
1.708
the middle country, of 6 measured · 6 members
Morocco2.139 Sudan1.205
Highest and lowest reading in Northern Africa.
- Southern Asia
1.581
the middle country, of 9 measured · 9 members
 Bhutan2.076
 Sri Lanka0.849
Highest and lowest reading in Southern Asia.
- Central America
1.471
the middle country, of 7 measured · 8 members
 Panama1.865
 Honduras1.033
Highest and lowest reading in Central America.
- Caribbean
1.360
the middle country, of 12 measured · 24 members
 Trinidad and Tobago1.790
 Dominican Republic1.122
Highest and lowest reading in Caribbean.
- Western Africa
1.355
the middle country, of 16 measured · 16 members
 Mauritania1.855
 Niger1.048
Highest and lowest reading in Western Africa.
- South America
1.238
the middle country, of 12 measured · 12 members
 Suriname1.860Uruguay0.622
Highest and lowest reading in South America.
- Eastern Africa
1.169
the middle country, of 15 measured · 19 members
 South Sudan1.918
 Seychelles1.046
Highest and lowest reading in Eastern Africa.
- Middle Africa
1.150
the middle country, of 9 measured · 9 members
 Central African Republic1.303
 Angola0.971
Highest and lowest reading in Middle Africa.
- South-eastern Asia
0.993
the middle country, of 10 measured · 11 members
 Myanmar1.432Vietnam0.817
Highest and lowest reading in South-eastern Asia.
- Southern Africa
0.979
the middle country, of 5 measured · 5 members
 South Africa1.049Botswana0.443
Highest and lowest reading in Southern Africa.
- Australia and New Zealand
2 of 2 measured — too few for a middle: Australia, New Zealand.
Australia1.397 New Zealand1.225
Highest and lowest reading in Australia and New Zealand.
- Melanesia
4 of 5 measured — too few for a middle: Fiji, Papua New Guinea, Solomon Islands, Vanuatu.
 Fiji1.312Solomon Islands0.340
Highest and lowest reading in Melanesia.
- Micronesia
4 of 7 measured — too few for a middle: Kiribati, Marshall Islands, Micronesia, Palau.
 Micronesia1.325Marshall Islands0.507
Highest and lowest reading in Micronesia.
- Northern America
2 of 4 measured — too few for a middle: Canada, United States.
Canada2.955 United States1.758
Highest and lowest reading in Northern America.
- Polynesia
4 of 7 measured — too few for a middle: American Samoa, Samoa, Tonga, Tuvalu.
 American Samoa1.004
 Tuvalu0.836
Highest and lowest reading in Polynesia.
03The whole field at once
The spread
190 countries, one dot each, on one scale — further right is a higher value. Half the countries are above 1.474; a quarter are above 2.021, and a quarter below 1.154. The bar in each row marks that continent’s middle country.
04All 198 ever measured
Every country
In order, highest value first. No rank or position is shown: too many countries share the same value for an order to mean anything. Neither end is the good end. Each country is measured against its own past, and continental and high-latitude countries warm fastest whatever their policies, so the order here is mostly geography. The standard deviation stored beside each figure shows how large a change is compared with that country's normal year-to-year swings.
Showing 25 of 198 countries
























































































































































Values for 2025. The change column compares 2025 with 2024 only; the sparkline covers the recent editions.
051961–2025 · 65 reference years
Over time
Each point is one meteorological year, December to November, from 1961. Single years jump about with the weather; the slope over decades is the signal.
- the middle country
- the middle half of countries
- the middle of the 140 countries measured every time
- each continent’s middle country
The same, year by year
| Year | Countries | Middle country | Middle half | Measured every time |
|---|---|---|---|---|
| 2025 | 190 | 1.474 | 1.154 – 2.021 | 1.436 |
| 2024 | 191 | 1.926 | 1.540 – 2.391 | 1.914 |
| 2023 | 191 | 1.667 | 1.271 – 2.168 | 1.656 |
| 2022 | 193 | 1.199 | 0.902 – 1.892 | 1.186 |
| 2021 | 193 | 1.270 | 1.010 – 1.630 | 1.272 |
| 2020 | 191 | 1.452 | 1.144 – 1.849 | 1.426 |
| 2019 | 192 | 1.421 | 1.154 – 1.710 | 1.401 |
| 2018 | 193 | 1.120 | 0.887 – 1.866 | 1.114 |
| 2017 | 193 | 1.269 | 1.016 – 1.535 | 1.258 |
| 2016 | 193 | 1.416 | 1.187 – 1.691 | 1.416 |
| 2015 | 193 | 1.234 | 0.994 – 1.567 | 1.216 |
| 2014 | 193 | 0.965 | 0.737 – 1.333 | 0.972 |
| 2013 | 193 | 0.911 | 0.696 – 1.151 | 0.863 |
| 2012 | 191 | 0.845 | 0.563 – 1.152 | 0.788 |
| 2011 | 190 | 0.762 | 0.525 – 1.084 | 0.761 |
| 2010 | 190 | 1.070 | 0.702 – 1.367 | 1.123 |
| 2009 | 191 | 0.891 | 0.689 – 1.170 | 0.891 |
| 2008 | 189 | 0.722 | 0.458 – 1.107 | 0.712 |
| 2007 | 193 | 0.896 | 0.680 – 1.284 | 0.878 |
| 2006 | 191 | 0.845 | 0.611 – 1.136 | 0.886 |
| 2005 | 188 | 0.861 | 0.654 – 1.137 | 0.851 |
| 2004 | 190 | 0.760 | 0.569 – 0.991 | 0.728 |
| 2003 | 191 | 0.865 | 0.609 – 1.053 | 0.909 |
| 2002 | 189 | 0.866 | 0.680 – 1.163 | 0.825 |
| 2001 | 187 | 0.735 | 0.509 – 1.281 | 0.716 |
| 2000 | 187 | 0.565 | 0.317 – 1.023 | 0.547 |
| 1999 | 187 | 0.688 | 0.411 – 1.075 | 0.727 |
| 1998 | 187 | 1.015 | 0.812 – 1.193 | 1.021 |
| 1997 | 183 | 0.551 | 0.235 – 0.846 | 0.611 |
| 1996 | 186 | 0.265 | -0.016 – 0.542 | 0.310 |
| 1995 | 186 | 0.594 | 0.371 – 0.841 | 0.556 |
| 1994 | 184 | 0.470 | 0.315 – 0.869 | 0.484 |
| 1993 | 186 | 0.264 | 0.018 – 0.478 | 0.273 |
| 1992 | 185 | 0.294 | -0.046 – 0.562 | 0.291 |
| 1991 | 163 | 0.388 | 0.201 – 0.555 | 0.388 |
| 1990 | 164 | 0.480 | 0.282 – 0.784 | 0.511 |
| 1989 | 165 | 0.157 | -0.025 – 0.393 | 0.169 |
| 1988 | 164 | 0.512 | 0.323 – 0.672 | 0.524 |
| 1987 | 164 | 0.503 | 0.200 – 0.718 | 0.496 |
| 1986 | 165 | 0.163 | 0.012 – 0.342 | 0.164 |
| 1985 | 163 | 0.099 | -0.071 – 0.282 | 0.104 |
| 1984 | 163 | 0.056 | -0.137 – 0.262 | 0.055 |
| 1983 | 166 | 0.470 | 0.097 – 0.683 | 0.483 |
| 1982 | 166 | 0.203 | -0.031 – 0.364 | 0.203 |
| 1981 | 164 | 0.208 | -0.002 – 0.342 | 0.208 |
| 1980 | 164 | 0.292 | 0.013 – 0.454 | 0.266 |
| 1979 | 163 | 0.312 | 0.126 – 0.455 | 0.323 |
| 1978 | 163 | 0.098 | -0.028 – 0.223 | 0.087 |
| 1977 | 161 | 0.215 | 0.040 – 0.339 | 0.223 |
| 1976 | 162 | -0.286 | -0.446 – -0.074 | -0.295 |
| 1975 | 162 | -0.115 | -0.248 – 0.111 | -0.113 |
| 1974 | 166 | -0.183 | -0.342 – -0.035 | -0.183 |
| 1973 | 166 | 0.273 | 0.037 – 0.462 | 0.264 |
| 1972 | 166 | -0.029 | -0.210 – 0.120 | -0.027 |
| 1971 | 165 | -0.203 | -0.363 – -0.073 | -0.187 |
| 1970 | 164 | 0.120 | -0.073 – 0.283 | 0.120 |
| 1969 | 165 | 0.196 | -0.003 – 0.348 | 0.183 |
| 1968 | 163 | -0.193 | -0.322 – -0.065 | -0.187 |
| 1967 | 164 | -0.151 | -0.297 – 0.019 | -0.139 |
| 1966 | 166 | 0.120 | -0.032 – 0.319 | 0.133 |
| 1965 | 163 | -0.232 | -0.389 – -0.100 | -0.217 |
| 1964 | 164 | -0.131 | -0.276 – 0.063 | -0.131 |
| 1963 | 164 | -0.042 | -0.219 – 0.199 | -0.046 |
| 1962 | 165 | -0.083 | -0.176 – 0.080 | -0.096 |
| 1961 | 165 | 0.041 | -0.115 – 0.325 | 0.072 |
062024 → 2025
Who rose and fell
The biggest changes in value between the two newest editions — reference years recalculated in one report, not two separate publications. Places are shown second, because they also move when other countries do.
Rose most
before → after- Iceland0.117 → 1.472+1.355
- Kazakhstan2.112 → 3.294+1.182
 Sweden2.027 → 2.724+0.697
- Finland2.267 → 2.941+0.674
- Kyrgyzstan2.322 → 2.974+0.652
190 countries were measured in both 2024 and 2025. The field changed from 191 to 190 countries, so a place can move for reasons that have nothing to do with the country itself.
07Across every edition
Temperature change in records
The extremes of the statistic. A record reached by more than one country names none of them.
Highest reading on record
3.697
Change in mean land-surface temperature against the country's own 1951–1980 average, °C
Lowest reading on record
-1.801
Change in mean land-surface temperature against the country's own 1951–1980 average, °C
Biggest rise between editions
+2.890
-1.801 → 1.089
Biggest fall between editions
−2.768
1.892 → -0.876
Biggest change since first measured
+3.040
-1.296 → 1.744
Highest most often
2 countries share this record — no holder is named
7 of 65
editions
08The measure
About temperature change
This is how much warmer — or, occasionally, colder — a country's land surface was over a year than its own average for 1951–1980, in degrees Celsius. FAO calculates it for every country from NASA's global surface temperature record, which makes it the plainest country-by-country measure of how far the climate has already moved.
What the number is: Change in mean land-surface temperature against the country's own 1951–1980 average, °C.
09Where it fits
Connections
Its part in the Country Index, the statistics whose values line up most closely with it across countries, and others on the same subject.
In the Country Index
Context, with no vote
This statistic is published in full under Environment & Sustainability and Risk & Resilience, but does not help decide any Country Index standing.
Environment & SustainabilityRisk & ResilienceWhich statistics vote, and why
Moves with
Where temperature change is higher, these tend to be higher too.
- Completeness of Birth RegistrationUNICEF · 157 countries in commonρ 0.65
- Upper Secondary AttainmentUIS · 90 countries in commonρ 0.65
- Minimum Proficiency in Reading, End of PrimaryUIS · 109 countries in commonρ 0.61
Moves against
Where temperature change is higher, these tend to be lower.
- Learning PovertyWorld Bank Group and UNESCO Institute for Statistics · 104 countries in commonρ −0.63
- Informal Employment RateILO · 93 countries in commonρ −0.62
- Maternal Mortality RatioKeyMMEIG · 184 countries in commonρ −0.61
Rank correlation (ρ, from −1 to 1) across countries, on each statistic’s newest edition, out of 311 statistics sharing at least 80 countries with this one. Two statistics that move together do not cause each other.
10Keep reading
Explore further
The countries at either end
11Questions
Temperature change: questions and answers
Which country has the highest temperature change?
Kazakhstan, at 3.294, among the 190 countries compared in 2025.
Which country has the lowest temperature change?
Solomon Islands, at 0.340, among the 190 countries compared in 2025.
How many countries does the Temperature Change on Land cover?
190 in 2025, and 198 at least once across all editions. The number measured varies from 161 to 193 between editions.
What is the world average temperature change?
This site does not calculate a world average, which would depend on how countries are weighted. In the middle country of the 190 compared in 2025, the figure was 1.474.
Is this Food and Agriculture Organization of the United Nations (FAO)’s own ranking?
No ranking is shown. Food and Agriculture Organization of the United Nations (FAO) publishes values only, and too many countries share the same value for an ordering to mean anything, so none is derived.
How often is the Temperature Change on Land published?
This site holds 65 reference years, 1961–2025, all recalculated in Food and Agriculture Organization of the United Nations (FAO)’s 2026 report on one method — not 65 separate publications.
Where does the data come from, and can I download it?
From Food and Agriculture Organization of the United Nations (FAO), under CC BY 4.0. FAOSTAT's Temperature Change on Land domain, read from FAO's own bulk download, which FAO computes from NASA's GISS Surface Temperature Analysis. Only the annual figure is read; the monthly and seasonal ones in the same file are left out. Every edition is on this site’s Datasets pages as a full table, and downloads as a CSV file with every value unrounded.
12Method
Sources, method and citation
Source
Temperature Change on Land — Food and Agriculture Organization of the United Nations (FAO)
FAOSTAT's Temperature Change on Land domain, read from FAO's own bulk download, which FAO computes from NASA's GISS Surface Temperature Analysis. Only the annual figure is read; the monthly and seasonal ones in the same file are left out.
Newest edition
Report year 2025Data year 2025
Cite the source as: FAO. 2026. FAOSTAT: Temperature change on land. Accessed on 29 September 2026. https://www.fao.org/faostat/en/#data/ET Licence: CC-BY-4.0. Computed by FAO from the NASA GISS Surface Temperature Analysis (GISTEMP v4), NASA Goddard Institute for Space Studies.
Licence: CC BY 4.0, checked 2026-09-29.
How this page reads the numbers
- No rank or position is shown: Food and Agriculture Organization of the United Nations (FAO) publishes values only, and too many countries share the same value for an ordering to mean anything.
- This statistic has no better end, so the page describes higher and lower values and never calls a country a leader.
- A country is named at an end only when it holds that value alone. Where several share it, the page says how many and names none first.
- Values are stored exactly as published and trimmed only for display. “The middle country” is the median of the countries measured, not a world average.
The file itself, column by column — where it came from, what each column holds, and every edition as a CSV — is on its dataset page.
Cite this page
Nations Inquiry (2026). Temperature change by country: Temperature Change on Land, data from Food and Agriculture Organization of the United Nations (FAO). https://nationsinquiry.com/statistics/temperature-change