Loading…
Global Footprint Network · Ecological Footprint
Ecological footprint by country
How much land and sea does a country's consumption require per person?
Of the 126 countries compared in 2025, Yemen had the lowest reading, 0.5138, and Qatar had the highest reading, 11.7321. In the middle country the figure was 2.2963. Among the 101 countries measured in every edition since 1961, the middle one moved from 1.5438 to 2.2867.
Part ofEnvironment & Sustainability
Ecological footprint · 2025
Key statistic · Environment & Sustainability

Lowest of 126Yemen
0.5138012025 · position · derived
Who leads
The three countries at the lowest end of 126 compared, the three at the other end, and the first on each continent.
 1
1Photo: Jialiang Gao www.peace-on-earth.org derivative work: JamesA · CC BY-SA 3.0, greyscale
 2
2Photo: Stig Nygaard derivative work: Jjtkk · CC BY 2.0, greyscale
 3
3Photo: Tequendamia · CC0, greyscale

Highest in 2025
 Qatar11.7321
 Luxembourg10.1193
 Mongolia7.5270
Where a country sits says how it compares with the others measured, and nothing about why.
02Every measured country
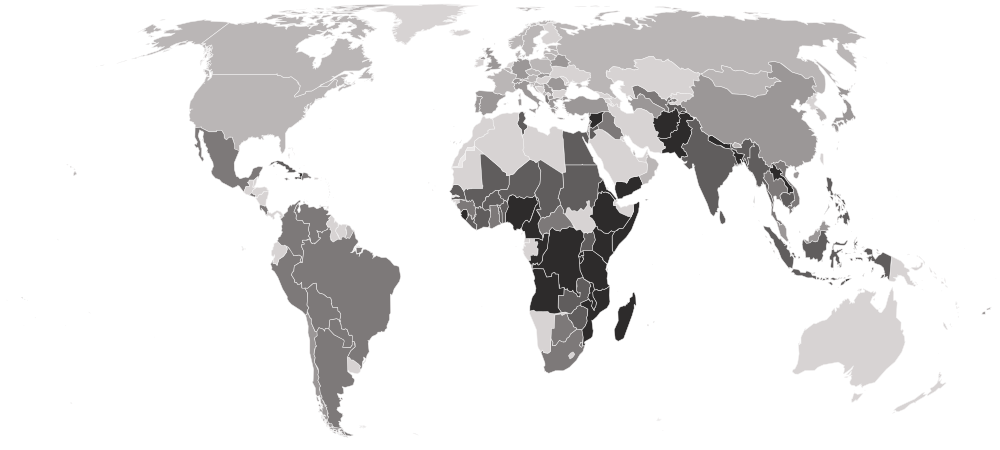
Ecological footprint on a map
Each country is shaded by its value, in five groups holding the same number of countries. Hover a country for its value, or select it to open its profile. Below the map, each continent’s middle country.
Darker is a lower value — the better end.
- 4.3360–11.7321
- 2.7174–4.2607
- 1.7476–2.6685
- 1.0330–1.7019
- 0.5138–1.0270
- No reading in 2025
- Africa
1.0815
the middle country, of 38 measured · 55 members
 Mozambique0.5879
 Mauritius3.9579
Lowest and highest reading in Africa.
- Asia
1.8385
the middle country, of 34 measured · 52 members
Yemen0.5138Qatar11.7321Lowest and highest reading in Asia.
- Americas
2.5743
the middle country, of 21 measured · 48 members
 Haiti0.6236
 United States7.0529
Lowest and highest reading in Americas.
- Europe
4.4284
the middle country, of 30 measured · 49 members
 Albania2.4017Luxembourg10.1193
Lowest and highest reading in Europe.
- Oceania
3 of 21 measured — too few for a middle: Fiji, Samoa, Tonga.
 Samoa2.2867
 Tonga3.7594
Lowest and highest reading in Oceania.
- Every region
20 sub-regions, lowest middle country first
- Eastern Africa
0.8454
the middle country, of 14 measured · 19 members
Mozambique0.5879Mauritius3.9579Lowest and highest reading in Eastern Africa.
- Southern Asia
0.9059
the middle country, of 7 measured · 9 members
 Pakistan0.7224
 Bhutan4.7711
Lowest and highest reading in Southern Asia.
- Middle Africa
0.9985
the middle country, of 6 measured · 9 members
 DR Congo0.6469
 Central African Republic1.8942
Lowest and highest reading in Middle Africa.
- Western Africa
1.1425
the middle country, of 12 measured · 16 members
 Nigeria0.7389
 Ghana1.9009
Lowest and highest reading in Western Africa.
- South-eastern Asia
1.5841
the middle country, of 9 measured · 11 members
 Timor-Leste0.8934
 Malaysia4.1112
Lowest and highest reading in South-eastern Asia.
- Western Asia
2.1639
the middle country, of 11 measured · 19 members
Yemen0.5138Qatar11.7321Lowest and highest reading in Western Asia.
- South America
2.4090
the middle country, of 8 measured · 12 members
 Colombia1.8468
 Chile3.7582
Lowest and highest reading in South America.
- Caribbean
2.5098
the middle country, of 8 measured · 24 members
Haiti0.6236 Antigua and Barbuda4.7233
Lowest and highest reading in Caribbean.
- Eastern Europe
4.2282
the middle country, of 6 measured · 10 members
 Romania3.0499
 Russia5.3926
Lowest and highest reading in Eastern Europe.
- Southern Europe
4.2479
the middle country, of 11 measured · 17 members
Albania2.4017 Malta5.6589
Lowest and highest reading in Southern Europe.
- Western Europe
4.6332
the middle country, of 6 measured · 9 members
 Germany3.7778Luxembourg10.1193
Lowest and highest reading in Western Europe.
- Northern Europe
5.7116
the middle country, of 7 measured · 13 members
 United Kingdom3.4088
 Estonia6.6685
Lowest and highest reading in Northern Europe.
- Central America
3 of 8 measured — too few for a middle: Costa Rica, El Salvador, Mexico.
 El Salvador2.1542
 Mexico2.6464
Lowest and highest reading in Central America.
- Central Asia
3 of 5 measured — too few for a middle: Tajikistan, Turkmenistan, Uzbekistan.
 Tajikistan1.0330
 Turkmenistan4.2341
Lowest and highest reading in Central Asia.
- Eastern Asia
4 of 8 measured — too few for a middle: China, Japan, Mongolia, South Korea.
 China3.7571Mongolia7.5270
Lowest and highest reading in Eastern Asia.
- Melanesia
1 of 5 measured — too few for a middle: Fiji.
 Fiji3.1218
Lowest and highest reading in Melanesia.
- Northern Africa
3 of 6 measured — too few for a middle: Egypt, Sudan, Tunisia.
 Sudan1.2688
 Tunisia1.6287
Lowest and highest reading in Northern Africa.
- Northern America
2 of 4 measured — too few for a middle: Canada, United States.
 Canada6.6221United States7.0529
Lowest and highest reading in Northern America.
- Polynesia
2 of 7 measured — too few for a middle: Samoa, Tonga.
Samoa2.2867Tonga3.7594Lowest and highest reading in Polynesia.
- Southern Africa
3 of 5 measured — too few for a middle: Botswana, Eswatini, South Africa.
 Eswatini1.8217
 South Africa2.5595
Lowest and highest reading in Southern Africa.
03The whole field at once
The spread
126 countries, one dot each, on one scale — further right is a higher value. Half the countries are above 2.2963; a quarter are above 4.0155, and a quarter below 1.1094. The bar in each row marks that continent’s middle country.
04All 126 ever measured
Every country
In order, highest value first — position 1 is the highest value, the way Global Footprint Network’s own tables read. “=” marks a position shared with another country. Global Footprint Network ranks nobody on this measure; the position is derived here by ordering the published values. Read a high figure as demand on nature rather than as wealth or waste, and remember it counts consumption wherever it happens — imports included.
Showing 25 of 126 countries

















































































Values for 2025. The change column compares 2025 with 2024 only; the sparkline covers the recent editions.
051961–2025 · 65 editions
Over time
Each point is one year from 1961. The last two, 2024 and 2025, are Global Footprint Network nowcasts rather than accounted years: the headline figure is published but every land-type component behind it is empty.
- the middle country
- the middle half of countries
- the middle of the 101 countries measured every time
- each continent’s middle country
The same, year by year
| Year | Countries | Middle country | Middle half | Measured every time |
|---|---|---|---|---|
| 2025 | 126 | 2.2963 | 1.1094 – 4.0155 | 2.2867 |
| 2024 | 126 | 2.3139 | 1.1324 – 4.0352 | 2.2997 |
| 2023 | 126 | 2.3174 | 1.1541 – 4.1025 | 2.2699 |
| 2022 | 126 | 2.2724 | 1.1850 – 4.2565 | 2.2138 |
| 2021 | 126 | 2.3370 | 1.1526 – 4.1426 | 2.2631 |
| 2020 | 126 | 2.3057 | 1.1887 – 3.9406 | 2.0902 |
| 2019 | 126 | 2.2578 | 1.2574 – 4.2634 | 2.1952 |
| 2018 | 126 | 2.2485 | 1.2451 – 4.2988 | 2.1480 |
| 2017 | 126 | 2.2209 | 1.2275 – 4.3418 | 2.1411 |
| 2016 | 126 | 2.2308 | 1.2162 – 4.1468 | 2.1322 |
| 2015 | 126 | 2.3000 | 1.2595 – 4.1060 | 2.0600 |
| 2014 | 126 | 2.3814 | 1.2754 – 4.2084 | 2.0949 |
| 2013 | 126 | 2.3363 | 1.2774 – 4.2189 | 2.2691 |
| 2012 | 126 | 2.4200 | 1.2038 – 4.3580 | 2.2439 |
| 2011 | 125 | 2.4794 | 1.2042 – 4.5169 | 2.1019 |
| 2010 | 125 | 2.3679 | 1.2122 – 4.3937 | 2.0236 |
| 2009 | 125 | 2.2224 | 1.1493 – 4.2197 | 1.8986 |
| 2008 | 125 | 2.1727 | 1.1779 – 4.7126 | 1.9995 |
| 2007 | 125 | 2.2036 | 1.1795 – 4.8162 | 2.0618 |
| 2006 | 125 | 2.1203 | 1.1571 – 4.4461 | 2.0078 |
| 2005 | 123 | 2.1512 | 1.1538 – 4.5929 | 2.0304 |
| 2004 | 123 | 2.1055 | 1.1072 – 4.3557 | 1.9980 |
| 2003 | 122 | 2.0449 | 1.1200 – 4.1187 | 1.9264 |
| 2002 | 122 | 2.1195 | 1.1160 – 4.0584 | 1.8717 |
| 2001 | 122 | 2.2004 | 1.1512 – 4.1157 | 1.8873 |
| 2000 | 122 | 1.9499 | 1.1428 – 4.1325 | 1.8591 |
| 1999 | 122 | 1.9219 | 1.1371 – 4.3337 | 1.8212 |
| 1998 | 122 | 1.9764 | 1.1485 – 3.9012 | 1.7944 |
| 1997 | 122 | 2.0739 | 1.1400 – 4.0907 | 1.8747 |
| 1996 | 122 | 2.0566 | 1.1809 – 4.1427 | 1.9899 |
| 1995 | 122 | 2.0770 | 1.0877 – 4.0217 | 1.9399 |
| 1994 | 122 | 2.0820 | 1.0859 – 3.8910 | 1.9295 |
| 1993 | 122 | 2.0036 | 1.1011 – 3.5522 | 1.8183 |
| 1992 | 118 | 1.8604 | 1.1455 – 3.6576 | 1.7412 |
| 1991 | 107 | 1.6381 | 1.0666 – 3.5792 | 1.6869 |
| 1990 | 107 | 1.7403 | 1.0637 – 3.5032 | 1.7806 |
| 1989 | 107 | 1.7287 | 1.0794 – 3.4037 | 1.7759 |
| 1988 | 107 | 1.7887 | 1.1172 – 3.5814 | 1.8006 |
| 1987 | 107 | 1.7259 | 1.1008 – 3.4525 | 1.7763 |
| 1986 | 107 | 1.6731 | 1.1298 – 3.3545 | 1.7429 |
| 1985 | 107 | 1.6713 | 1.1162 – 3.3324 | 1.6869 |
| 1984 | 107 | 1.7191 | 1.1255 – 3.2343 | 1.7457 |
| 1983 | 107 | 1.6792 | 1.1031 – 3.0363 | 1.6802 |
| 1982 | 107 | 1.6875 | 1.1042 – 3.0064 | 1.6930 |
| 1981 | 107 | 1.7262 | 1.1465 – 2.9742 | 1.7520 |
| 1980 | 107 | 1.5838 | 1.1487 – 2.9588 | 1.6493 |
| 1979 | 107 | 1.6736 | 1.1659 – 3.2157 | 1.7101 |
| 1978 | 107 | 1.6495 | 1.1898 – 3.0829 | 1.6610 |
| 1977 | 107 | 1.6779 | 1.2050 – 3.2528 | 1.6834 |
| 1976 | 107 | 1.6956 | 1.1537 – 2.9926 | 1.6988 |
| 1975 | 107 | 1.6993 | 1.1339 – 3.1593 | 1.7034 |
| 1974 | 107 | 1.7124 | 1.1349 – 2.9959 | 1.7172 |
| 1973 | 107 | 1.6622 | 1.1244 – 2.8456 | 1.7108 |
| 1972 | 107 | 1.6491 | 1.1172 – 2.8738 | 1.6674 |
| 1971 | 107 | 1.7063 | 1.1146 – 2.9592 | 1.7063 |
| 1970 | 106 | 1.7001 | 1.1072 – 2.8569 | 1.7040 |
| 1969 | 106 | 1.6513 | 1.0889 – 2.9138 | 1.6506 |
| 1968 | 106 | 1.5651 | 1.0712 – 2.7898 | 1.5523 |
| 1967 | 105 | 1.5826 | 1.0819 – 2.6693 | 1.5772 |
| 1966 | 105 | 1.5558 | 1.0256 – 2.5911 | 1.5558 |
| 1965 | 104 | 1.5236 | 1.0043 – 2.4481 | 1.5011 |
| 1964 | 104 | 1.5650 | 1.0180 – 2.4039 | 1.5633 |
| 1963 | 101 | 1.5800 | 1.0078 – 2.4206 | 1.5800 |
| 1962 | 101 | 1.5075 | 0.9976 – 2.4577 | 1.5075 |
| 1961 | 101 | 1.5438 | 1.0038 – 2.4362 | 1.5438 |
062024 → 2025
Who rose and fell
The biggest changes in value between the two newest editions. Places are shown second, because they also move when other countries do.
Improved most
before → after- Qatar11.9936 → 11.7321 · 1st → 1st−0.2615
- Turkmenistan4.4486 → 4.2341 · 26th → 29th−0.2145
- Luxembourg10.3274 → 10.1193 · 2nd → 2nd−0.2081
 Oman5.1432 → 4.9449 · 14th → 17th−0.1983
- Mongolia7.6142 → 7.5270 · 3rd → 3rd−0.0872
Worsened most
before → after North Macedonia3.1585 → 3.3899 · 47th → 46th+0.2313
- Estonia6.5633 → 6.6685 · 6th → 5th+0.1052
 Lithuania5.6435 → 5.7116 · 10th → 9th+0.0681
 Montenegro4.8667 → 4.9270 · 18th → 18th+0.0603
 Latvia6.4721 → 6.5188 · 8th → 7th+0.0468
126 countries were measured in both 2024 and 2025.
07Across every edition
Ecological footprint in records
The extremes of the statistic. A record reached by more than one country names none of them.
Highest reading on record
17.6431
Ecological Footprint (global hectares per person)
Lowest reading on record
0.2721
Ecological Footprint (global hectares per person)
Biggest improvement between editions
−10.1971
11.5991 → 1.4020
Biggest decline between editions
+8.6876
4.9344 → 13.6220
Most improved since first measured
−2.6470
7.0533 → 4.4063
At the top most often
27 of 65
editions, alone at the first-listed end
08The measure
About ecological footprint
The Ecological Footprint measures how much biologically productive land and sea a country’s consumption demands, per person, in global hectares. A higher figure means a heavier draw on nature — not a richer country, though in practice the two track closely.
What the number is: Ecological Footprint (global hectares per person).
What it does not measure
It measures the demand consumption places on nature, not how well a country manages its environment: a poor country consumes little and scores well without any environmental policy at all.
09Where it fits
Connections
Its part in the Country Index, the statistics whose values line up most closely with it across countries, and others on the same subject.
In the Country Index
A key statistic for Environment & Sustainability
“How much of the planet's biological capacity a country's own consumption uses up.”
- Edition used
- 2025 (data 2025)
- Countries
- 126
- Licence
- CC BY-SA 4.0
Moves with
Where ecological footprint is higher, these tend to be higher too.
- GDP per Capita (PPP)KeyWorld Bank Group · 119 countries in commonρ 0.88
- Human Development IndexKeyUNDP Human Development Report Office · 126 countries in commonρ 0.87
- GDP per Person EmployedWorld Bank Group · 115 countries in commonρ 0.86
Moves against
Where ecological footprint is higher, these tend to be lower.
- INFORM Risk IndexKeyEuropean Commission Joint Research Centre, with the Inter-Agency Standing Committee · 126 countries in commonρ −0.86
- Prevalence of UndernourishmentFAO · 112 countries in commonρ −0.85
- Gender Inequality IndexKeyUNDP Human Development Report Office · 122 countries in commonρ −0.85
Rank correlation (ρ, from −1 to 1) across countries, on each statistic’s newest edition, out of 106 statistics sharing at least 80 countries with this one. Two statistics that move together do not cause each other.
10Keep reading
Explore further
The subject
The countries at either end
11Questions
Ecological footprint: questions and answers
Which country has the lowest ecological footprint?
Yemen, at 0.5138, among the 126 countries compared in 2025.
Which country has the highest ecological footprint?
Qatar, at 11.7321, among the 126 countries compared in 2025.
How many countries does the Ecological Footprint cover?
126 in 2025. The number measured varies from 101 to 126 between editions.
What is the world average ecological footprint?
This site does not calculate a world average, which would depend on how countries are weighted. In the middle country of the 126 compared in 2025, the figure was 2.2963.
Is this Global Footprint Network’s own ranking?
No. Global Footprint Network publishes the values but ranks nobody; the position on this page is derived by Nations Inquiry by ordering the published values, and equal values share a position.
How often is the Ecological Footprint published?
This site holds 65 editions, describing 1961 to 2025.
Where does the data come from, and can I download it?
From Global Footprint Network, under CC BY-SA 4.0. From the Global Footprint Network’s own data platform. Four dissolved states in the source are not imported because every row here keys to a present-day country, which is why Ethiopia’s series starts in 1993 and Sudan’s in 2012. Every edition is available on this site’s Datasets pages as a full table, unrounded.
12Method
Sources, method and citation
Source
Ecological Footprint — Global Footprint Network
From the Global Footprint Network’s own data platform. Four dissolved states in the source are not imported because every row here keys to a present-day country, which is why Ethiopia’s series starts in 1993 and Sudan’s in 2012.
Newest edition
Report year 2025Data year 2025
Cite the source as: Global Footprint Network. National Footprint and Biocapacity Accounts. Oakland, CA: Global Footprint Network.
Licence: CC BY-SA 4.0, checked 2026-09-05.
How this page reads the numbers
- Global Footprint Network ranks nobody on this measure. The position is derived by Nations Inquiry by ordering the published values; equal values share a position.
- Which end is better follows the publisher’s own reading of the measure.
- A country is named at an end only when it holds that value alone. Where several share it, the page says how many and names none first.
- Values are stored exactly as published and trimmed only for display. “The middle country” is the median of the countries measured, not a world average.
The full note on this data
65 reference years (1961–2025), covering 104 to 126 countries. It measures how much biologically productive land and sea a country’s consumption demands, per person, in global hectares - so a higher figure means a heavier demand on nature, not a richer country, though in practice the two track closely. ⚠ 2024 and 2025 are GFN NOWCASTS rather than accounted years: the headline figure is published but every land-type component behind it is empty. ⚠ Four dissolved states in the source (Yugoslav SFR, Serbia and Montenegro, Ethiopia PDR and Sudan (former)) are deliberately not imported, because every row here keys to a present-day country. The visible cost is that Ethiopia’s series starts in 1993 and Sudan’s in 2012. ⚠ GFN publishes no rank, so none is stored; the POSITION shown on the statistics page is derived here by ordering the score, and labelled as ours.
Photographs
The countries at the top of this statistic, from their profiles: Wikimedia Commons, shown in greyscale, each used under the licence named.
- Yemen — Jialiang Gao www.peace-on-earth.org derivative work: JamesA, CC BY-SA 3.0
- Mozambique — Stig Nygaard derivative work: Jjtkk, CC BY 2.0
- Burundi — Tequendamia, CC0
Cite this page
Nations Inquiry (2026). Ecological footprint by country: Ecological Footprint, data from Global Footprint Network. https://nationsinquiry.com/statistics/ecological-footprint