World Bank Group · GDP per Capita (PPP)
GDP per capita (PPP) by country
How much does an economy produce per person?
Singapore placed first of the 185 countries compared in 2025, at 139,593, and Burundi last, at 1,067. In the middle country the figure was 17,265. Among the 178 countries measured in every edition since 1990, the middle one moved from 8,882 to 17,476.
Share
GDP per capita (PPP) · 2025
Key statistic · Economy & Innovation

Highest of 185Singapore
139,593012025 · position · derived
Who leads
The three countries at the highest end of 185 compared, the three at the other end, and the first on each continent.
 1
Photo: Khairul Nizam . · CC BY 2.0, greyscale
 2
Photo: derivative work: Jjtkk · CC BY-SA 2.0, greyscale
 3
Photo: Michal Osmenda from Brussels, Belgium · CC BY-SA 2.0, greyscale
Lowest in 2025
- 185
 Burundi1,067
- 184
 Central African Republic1,123
- 183
 Somalia1,404
Positions out of 185. Where a country sits says how it compares with the others measured, and nothing about why.
02Every measured country
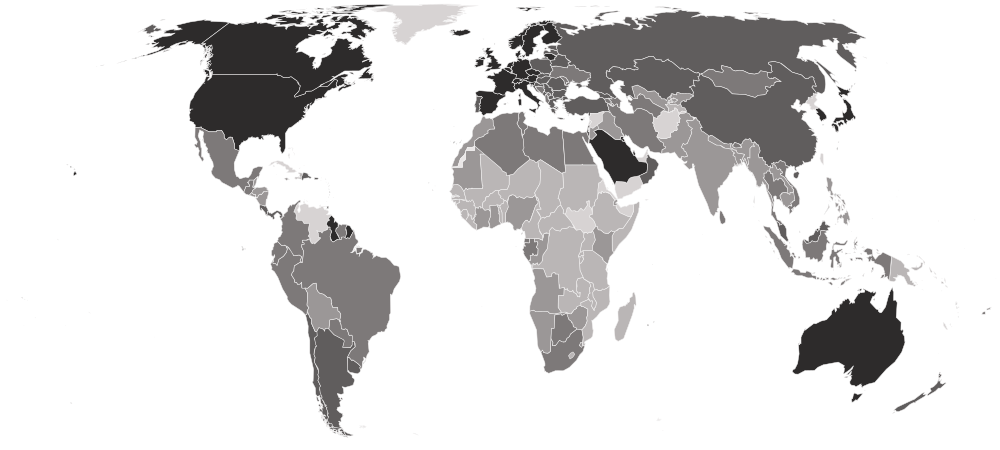
GDP per capita (PPP) on a map
Each country is shaded by its value, in five groups holding the same number of countries. Hover a country for its value, or select it to open its profile. Below the map, each continent’s middle country.
Darker is a higher value — the better end.
- 1,067–5,062
- 5,137–12,789
- 12,987–22,724
- 24,401–48,233
- 48,254–139,593
- No reading in 2025 (14 measured in an earlier edition)
- Europe
48,840
the middle country, of 41 measured · 49 members
 Ireland131,338
 Ukraine16,155
Highest and lowest reading in Europe.
- Americas
20,968
the middle country, of 34 measured · 48 members
 Guyana83,659
 Haiti2,678
Highest and lowest reading in Americas.
- Asia
20,234
the middle country, of 44 measured · 52 members
Singapore139,593 Timor-Leste4,110
Highest and lowest reading in Asia.
- Oceania
7,537
the middle country, of 14 measured · 21 members
 Australia60,194
 Solomon Islands2,382
Highest and lowest reading in Oceania.
- Africa
4,443
the middle country, of 52 measured · 55 members
 Seychelles30,639Burundi1,067
Highest and lowest reading in Africa.
- Every region
22 sub-regions, highest middle country first
- Western Europe
63,970
the middle country, of 7 measured · 9 members
 Luxembourg127,421
 France55,125
Highest and lowest reading in Western Europe.
- Northern Europe
59,549
the middle country, of 10 measured · 13 members
Ireland131,338 Latvia38,801
Highest and lowest reading in Northern Europe.
- Eastern Asia
51,990
the middle country, of 6 measured · 8 members
 Macau117,098
 Mongolia17,773
Highest and lowest reading in Eastern Asia.
- Eastern Europe
40,768
the middle country, of 10 measured · 10 members
 Czechia49,292Ukraine16,155
Highest and lowest reading in Eastern Europe.
- Southern Europe
40,398
the middle country, of 14 measured · 17 members
 Andorra67,993
 Kosovo16,461
Highest and lowest reading in Southern Europe.
- Western Asia
36,722
the middle country, of 14 measured · 19 members
 Qatar110,136
 Palestine4,272
Highest and lowest reading in Western Asia.
- Caribbean
24,503
the middle country, of 13 measured · 24 members
 Sint Maarten48,273Haiti2,678
Highest and lowest reading in Caribbean.
- South America
19,357
the middle country, of 11 measured · 12 members
Guyana83,659 Bolivia11,001
Highest and lowest reading in South America.
- South-eastern Asia
15,091
the middle country, of 11 measured · 11 members
Singapore139,593Timor-Leste4,110Highest and lowest reading in South-eastern Asia.
- Northern Africa
13,568
the middle country, of 6 measured · 6 members
 Egypt17,265
 Sudan1,873
Highest and lowest reading in Northern Africa.
- Central America
12,888
the middle country, of 8 measured · 8 members
 Panama37,516
 Honduras6,726
Highest and lowest reading in Central America.
- Southern Asia
12,311
the middle country, of 8 measured · 9 members
 Maldives24,401
 Nepal5,277
Highest and lowest reading in Southern Asia.
- Central Asia
11,623
the middle country, of 5 measured · 5 members
 Kazakhstan37,851
 Tajikistan5,062
Highest and lowest reading in Central Asia.
- Southern Africa
10,707
the middle country, of 5 measured · 5 members
 Botswana17,687
 Lesotho2,721
Highest and lowest reading in Southern Africa.
- Micronesia
7,660
the middle country, of 5 measured · 7 members
 Palau19,699
 Kiribati3,364
Highest and lowest reading in Micronesia.
- Middle Africa
5,459
the middle country, of 9 measured · 9 members
 Gabon18,986Central African Republic1,123
Highest and lowest reading in Middle Africa.
- Western Africa
3,801
the middle country, of 16 measured · 16 members
 Cabo Verde10,396
 Liberia1,693
Highest and lowest reading in Western Africa.
- Eastern Africa
3,590
the middle country, of 16 measured · 19 members
Seychelles30,639Burundi1,067Highest and lowest reading in Eastern Africa.
- Australia and New Zealand
2 of 2 measured — too few for a middle: Australia, New Zealand.
Australia60,194 New Zealand48,233
Highest and lowest reading in Australia and New Zealand.
- Melanesia
4 of 5 measured — too few for a middle: Fiji, Papua New Guinea, Solomon Islands, Vanuatu.
 Fiji13,961Solomon Islands2,382
Highest and lowest reading in Melanesia.
- Northern America
2 of 4 measured — too few for a middle: Canada, United States.
 United States76,931
 Canada57,990
Highest and lowest reading in Northern America.
- Polynesia
3 of 7 measured — too few for a middle: Samoa, Tonga, Tuvalu.
 Samoa7,963
 Tuvalu5,776
Highest and lowest reading in Polynesia.
03The whole field at once
The spread
185 countries, one dot each, on one scale — further right is a higher value. Half the countries are above 17,265; a quarter are above 40,846, and a quarter below 6,726. The bar in each row marks that continent’s middle country.
04All 199 ever measured
Every country
In order, highest value first. “=” marks a position shared with another country. World Bank Group ranks nobody on this measure; the position is derived here by ordering the published values. This is the most editorially loaded table on the site. Nobody publishes a ranking of countries by income, and calling a richer country a better one is an opinion, so it is deliberately left out of the Country Index.
Showing 25 of 199 countries

























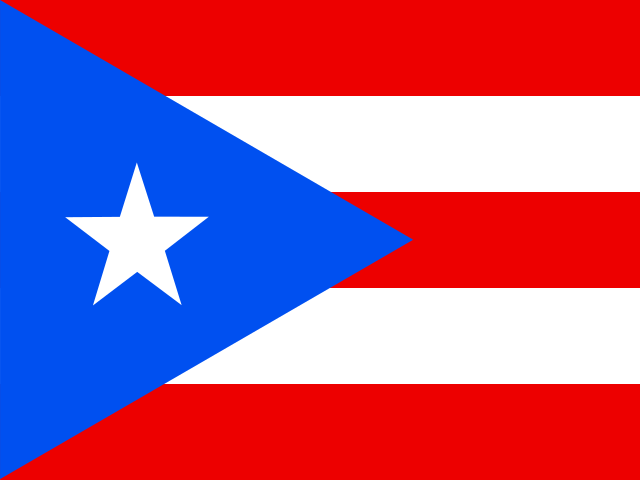













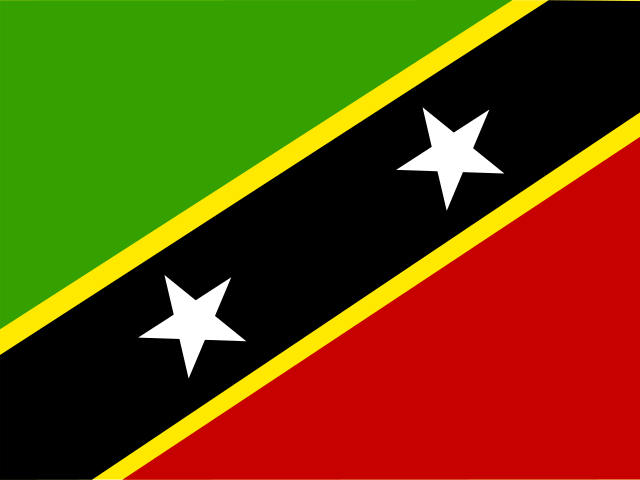

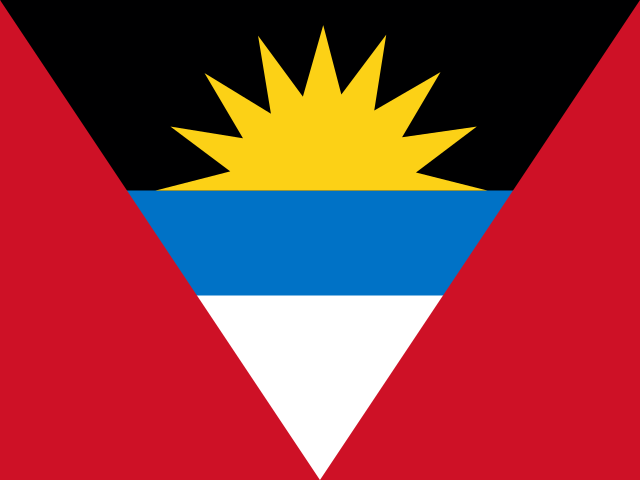




















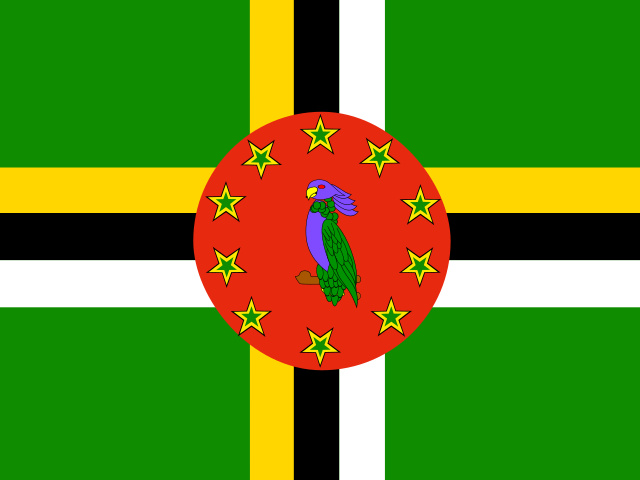













































































Values for 2025. The change column compares 2025 with 2024 only; the sparkline covers the recent editions.
051990–2025 · 36 reference years
Over time
Each point is one reference year from 1990, in constant 2021 international dollars, so inflation and exchange-rate swings are already out of it.
- the middle country
- the middle half of countries
- the middle of the 178 countries measured every time
- each continent’s middle country
The same, year by year
| Year | Countries | Middle country | Middle half | Measured every time |
|---|---|---|---|---|
| 2025 | 185 | 17,265 | 6,726 – 40,846 | 17,476 |
| 2024 | 195 | 18,108 | 6,809 – 41,539 | 17,163 |
| 2023 | 197 | 17,686 | 6,521 – 41,320 | 16,589 |
| 2022 | 199 | 16,933 | 6,239 – 40,237 | 16,368 |
| 2021 | 199 | 16,260 | 6,214 – 38,689 | 15,847 |
| 2020 | 199 | 15,631 | 6,046 – 36,614 | 15,021 |
| 2019 | 199 | 16,761 | 6,338 – 38,237 | 15,626 |
| 2018 | 199 | 16,349 | 6,177 – 37,605 | 15,488 |
| 2017 | 199 | 16,129 | 5,936 – 36,757 | 15,394 |
| 2016 | 199 | 15,512 | 5,674 – 36,274 | 14,895 |
| 2015 | 199 | 14,857 | 5,508 – 35,534 | 14,467 |
| 2014 | 199 | 14,475 | 5,464 – 35,409 | 14,053 |
| 2013 | 199 | 14,681 | 5,493 – 34,566 | 13,706 |
| 2012 | 198 | 14,631 | 5,313 – 34,618 | 13,178 |
| 2011 | 198 | 13,916 | 5,094 – 34,419 | 12,606 |
| 2010 | 198 | 14,101 | 4,890 – 33,945 | 12,598 |
| 2009 | 198 | 13,655 | 4,699 – 34,859 | 12,132 |
| 2008 | 197 | 14,030 | 4,446 – 35,825 | 12,191 |
| 2007 | 195 | 13,755 | 4,359 – 35,261 | 11,698 |
| 2006 | 194 | 12,983 | 4,241 – 33,345 | 11,098 |
| 2005 | 193 | 12,023 | 4,152 – 31,303 | 10,673 |
| 2004 | 193 | 11,608 | 4,089 – 28,226 | 10,277 |
| 2003 | 193 | 11,183 | 3,998 – 25,485 | 10,036 |
| 2002 | 193 | 11,144 | 3,943 – 24,229 | 10,007 |
| 2001 | 192 | 10,907 | 3,906 – 23,306 | 9,933 |
| 2000 | 192 | 10,589 | 3,819 – 23,098 | 9,989 |
| 1999 | 190 | 10,436 | 3,797 – 22,714 | 9,677 |
| 1998 | 190 | 9,886 | 3,757 – 23,337 | 9,635 |
| 1997 | 190 | 9,705 | 3,675 – 23,276 | 9,268 |
| 1996 | 188 | 9,057 | 3,532 – 21,807 | 8,940 |
| 1995 | 188 | 8,783 | 3,409 – 20,728 | 8,643 |
| 1994 | 187 | 8,629 | 3,189 – 20,141 | 8,402 |
| 1993 | 186 | 9,324 | 3,370 – 20,640 | 8,441 |
| 1992 | 186 | 9,023 | 3,368 – 19,602 | 8,711 |
| 1991 | 186 | 9,128 | 3,343 – 21,264 | 8,980 |
| 1990 | 185 | 8,946 | 3,411 – 23,400 | 8,882 |
062024 → 2025
Who rose and fell
The biggest changes in value between the two newest editions — reference years recalculated in one report, not two separate publications. Places are shown second, because they also move when other countries do.
Improved most
before → afterDeclined most
before → after Equatorial Guinea14,998 → 13,786 · 110th → 108th−1,211
- Qatar111,314 → 110,136 · 5th → 5th−1,179
- Luxembourg128,475 → 127,421 · 2nd → 3rd−1,055
 Iran17,484 → 16,834 · 100th → 96th−650
 Oman36,721 → 36,143 · 56th → 54th−578
185 countries were measured in both 2024 and 2025. The field changed from 195 to 185 countries, so a place can move for reasons that have nothing to do with the country itself.
07Across every edition
GDP per capita (PPP) in records
The extremes of the statistic. A record reached by more than one country names none of them.
Highest reading on record
174,570
GDP per capita (constant 2021 international $, PPP)
Lowest reading on record
511
GDP per capita (constant 2021 international $, PPP)
Biggest improvement between editions
+44,894
59,921 → 104,815
Biggest decline between editions
−73,791
133,454 → 59,662
Most improved since first measured
+101,834
29,505 → 131,338
At the top most often
16 of 36
editions, alone at the first-listed end
08The measure
About GDP per capita (PPP)
GDP per capita measures a country’s output per person, converted at purchasing power parities so a dollar buys the same basket of goods everywhere. That conversion is what makes the figures comparable across countries — and what makes each one an estimate rather than a measurement.
What the number is: GDP per capita (constant 2021 international $, PPP).
What it does not measure
It is an average, so it says nothing about how income is shared, and it counts output rather than wellbeing: unpaid work is left out and spending on repairing damage is counted in.
09Where it fits
Connections
Its part in the Country Index, the statistics whose values line up most closely with it across countries, and others on the same subject.
In the Country Index
A key statistic for Economy & Innovation
“Output per person: the standard measure of an economy's size set against the population it has to support.”
- Edition used
- 2025 (data 2025)
- Countries
- 185
- Licence
- CC BY 4.0
Moves with
Where GDP per capita (PPP) is higher, these tend to be higher too.
- GNI per Capita (PPP)World Bank Group · 102 countries in commonρ 1.00
- Historical GDP per Capita (Maddison)GGDC · 157 countries in commonρ 0.98
- GDP per Person EmployedWorld Bank Group · 168 countries in commonρ 0.98
Moves against
Where GDP per capita (PPP) is higher, these tend to be lower.
- Gender Inequality IndexUNDP Human Development Report Office · 164 countries in commonρ −0.89
- Vulnerable EmploymentKeyILO · 168 countries in commonρ −0.88
- Self-Employment RateILO · 168 countries in commonρ −0.88
Rank correlation (ρ, from −1 to 1) across countries, on each statistic’s newest edition, out of 379 statistics sharing at least 80 countries with this one. Two statistics that move together do not cause each other.
10Analysis
Charts and analysis on GDP per capita (PPP)
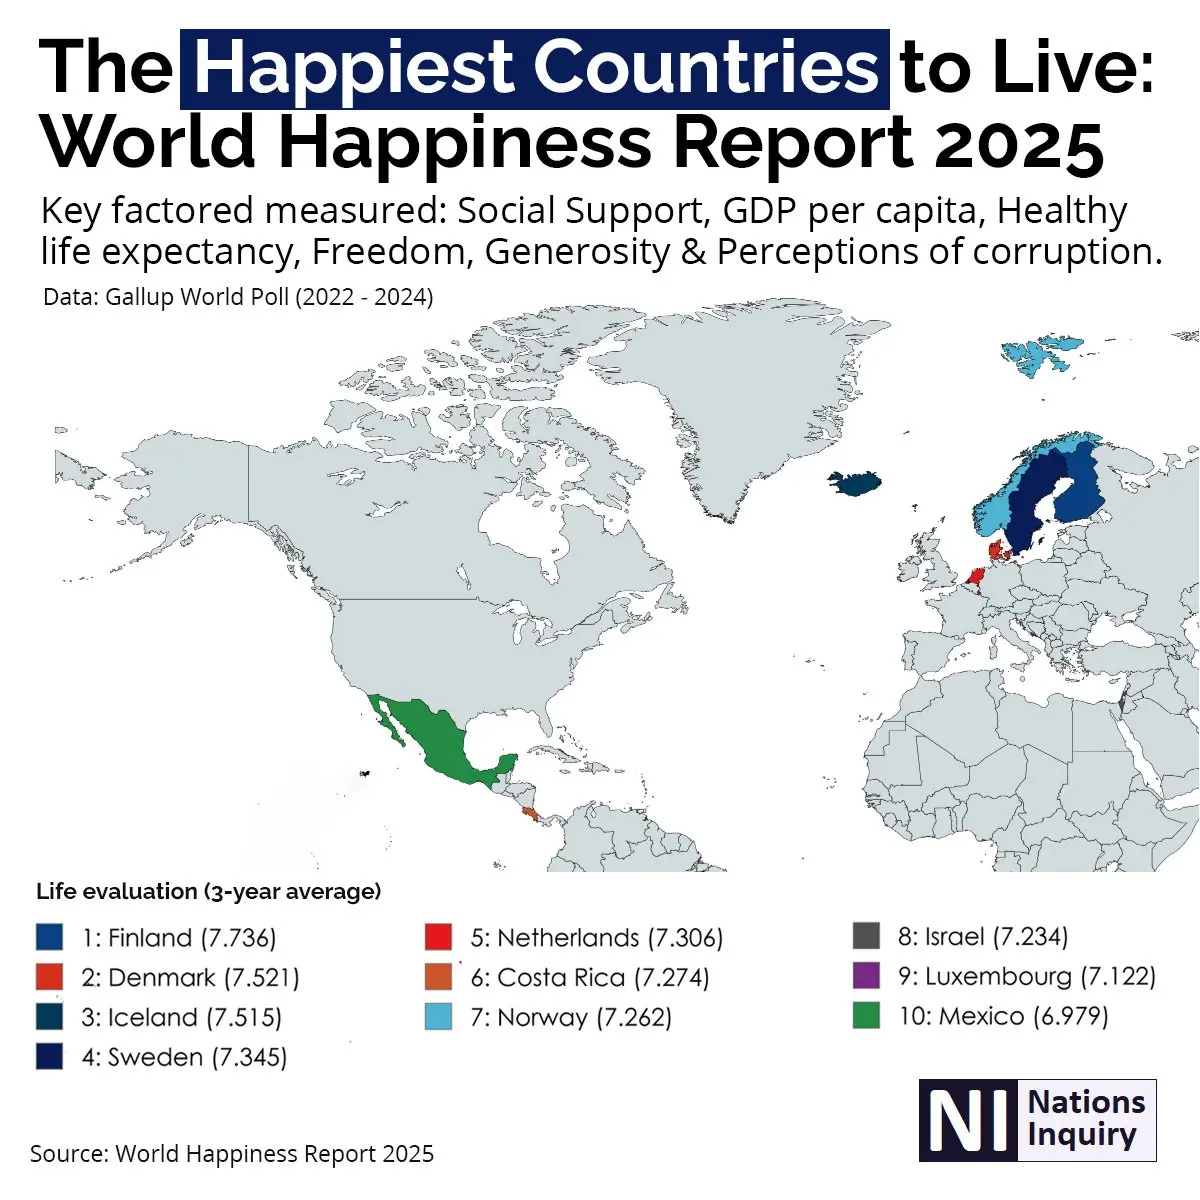
World Happiness Report 2025: Finland Leads Again as the US and UK Face Major Declines
The ten highest life evaluations of 2025, drawn on a world map, and the six things the report uses to explain them. Costa Rica and Mexico are the only two outside Europe and the Middle East.
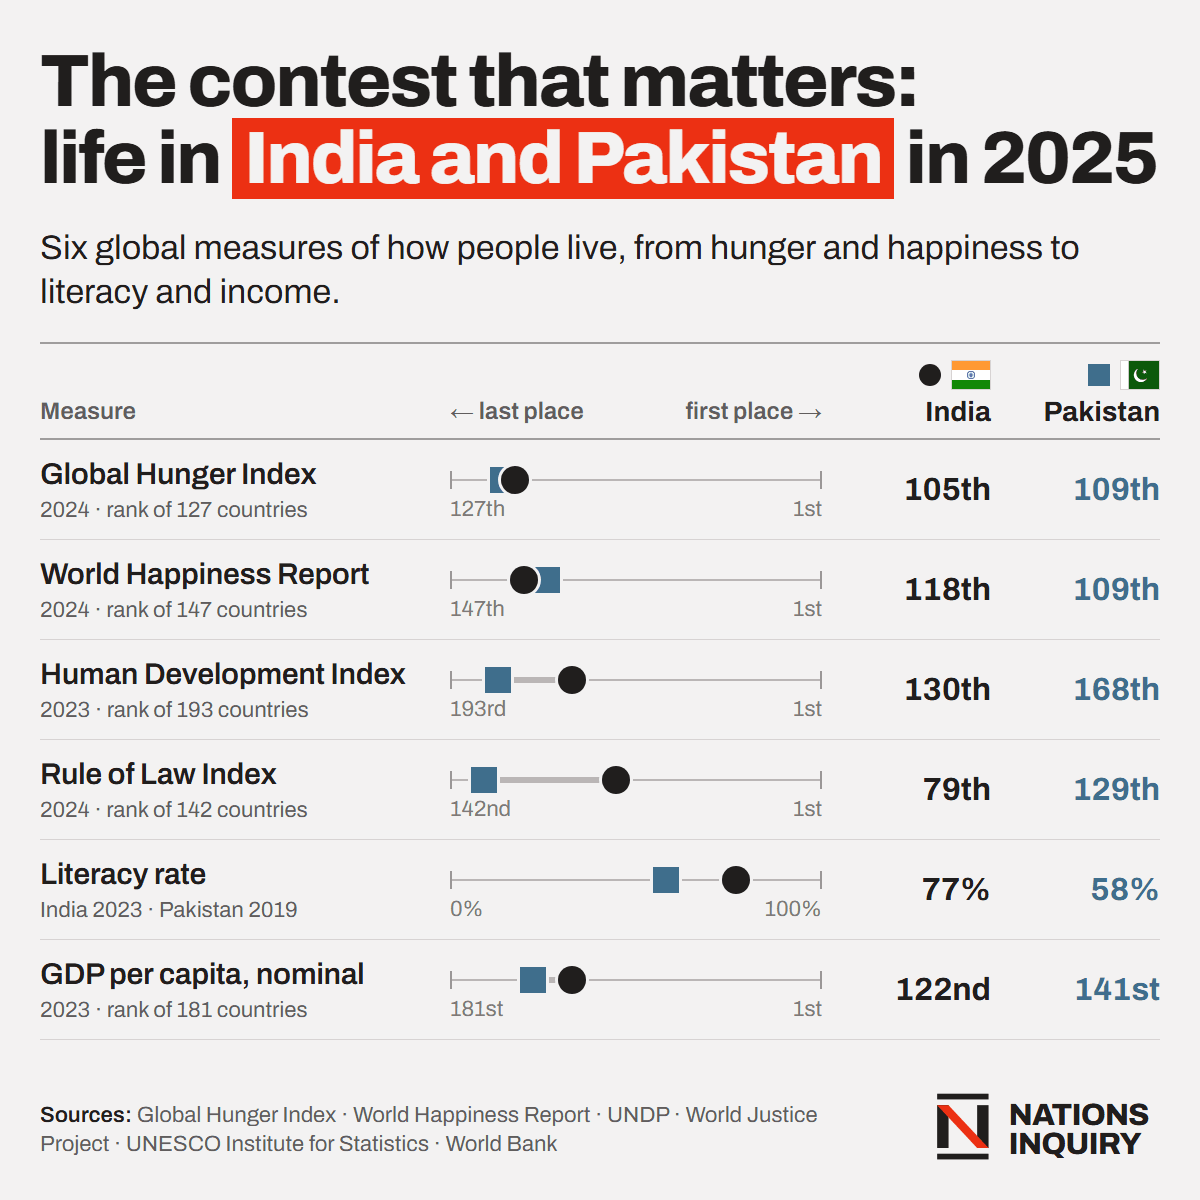
India vs Pakistan 2025: Comparison of Hunger Index, Happiness, HDI, Rule of Law, Literacy & GDP
India and Pakistan on six published measures: hunger, happiness, human development, rule of law, literacy and GDP per capita, each from its own publisher and year.
11Keep reading
Explore further
The countries at either end
More from World Bank Group
12Questions
GDP per capita (PPP): questions and answers
Which country has the highest GDP per capita (PPP)?
Singapore, at 139,593, among the 185 countries compared in 2025.
Which country has the lowest GDP per capita (PPP)?
Burundi, at 1,067, among the 185 countries compared in 2025.
How many countries does the GDP per Capita (PPP) cover?
185 in 2025, and 199 at least once across all editions. The number measured varies from 185 to 199 between editions.
What is the world average GDP per capita (PPP)?
This site does not calculate a world average, which would depend on how countries are weighted. In the middle country of the 185 compared in 2025, the figure was 17,265.
Is this World Bank Group’s own ranking?
No. World Bank Group publishes the values but ranks nobody; the position on this page is derived by Nations Inquiry by ordering the published values, and equal values share a position.
How often is the GDP per Capita (PPP) published?
This site holds 36 reference years, 1990–2025, all recalculated in World Bank Group’s 2026 report on one method — not 36 separate publications.
Where does the data come from, and can I download it?
From World Bank Group, under CC BY 4.0. Pulled from the World Bank’s indicator API (NY.GDP.PCAP.PP.KD) and stored to whole dollars — two decimals on a PPP-converted national accounts estimate would be false precision. Every edition is on this site’s Datasets pages as a full table, and downloads as a CSV file with every value unrounded.
13Method
Sources, method and citation
Source
GDP per Capita (PPP) — World Bank Group
Pulled from the World Bank’s indicator API (NY.GDP.PCAP.PP.KD) and stored to whole dollars — two decimals on a PPP-converted national accounts estimate would be false precision.
Newest edition
Report year 2025Data year 2025
Cite the source as: World Bank. World Development Indicators. Washington, DC: World Bank Group.
Licence: CC BY 4.0, checked 2026-08-29.
How this page reads the numbers
- World Bank Group ranks nobody on this measure. The position is derived by Nations Inquiry by ordering the published values; equal values share a position.
- Which end is better follows the publisher’s own reading of the measure.
- A country is named at an end only when it holds that value alone. Where several share it, the page says how many and names none first.
- Values are stored exactly as published and trimmed only for display. “The middle country” is the median of the countries measured, not a world average.
The file itself, column by column — where it came from, what each column holds, and every edition as a CSV — is on its dataset page.
Photographs
The countries at the top of this statistic, from their profiles: Wikimedia Commons, shown in greyscale, each used under the licence named.
- Singapore — Khairul Nizam ., CC BY 2.0
- Ireland — derivative work: Jjtkk, CC BY-SA 2.0
- Luxembourg — Michal Osmenda from Brussels, Belgium, CC BY-SA 2.0
Cite this page
Nations Inquiry (2026). GDP per capita (PPP) by country: GDP per Capita (PPP), data from World Bank Group. https://nationsinquiry.com/statistics/gdp-per-capita