Loading…
World Bank Group · GNI per Capita (PPP)
GNI per capita (PPP) by country
How much do a country's residents earn per person?
Singapore placed first of the 102 countries compared in 2025, at 116,633, and Central African Republic last, at 1,181. In the middle country the figure was 14,273. Among the 59 countries measured in every edition since 1994, the middle one moved from 7,774 to 15,877.
GNI per capita (PPP) · 2025
Context statistic

Highest of 102Singapore
116,633012025 · position · derived
Who leads
The three countries at the highest end of 102 compared, the three at the other end, and the first on each continent.
 1
1Photo: Khairul Nizam . · CC BY 2.0, greyscale
 2
2Photo: kulimpapat derivative work: Inkey · CC BY 2.0, greyscale
 3
3Photo: Base64 and Derivative work by Globe-trotter · CC BY-SA 3.0, greyscale
Lowest in 2025
- 102
 Central African Republic1,181
 - 101
 DR Congo1,239
 - 100
 Mozambique1,354
Positions out of 102. Where a country sits says how it compares with the others measured, and nothing about why.
02Every measured country
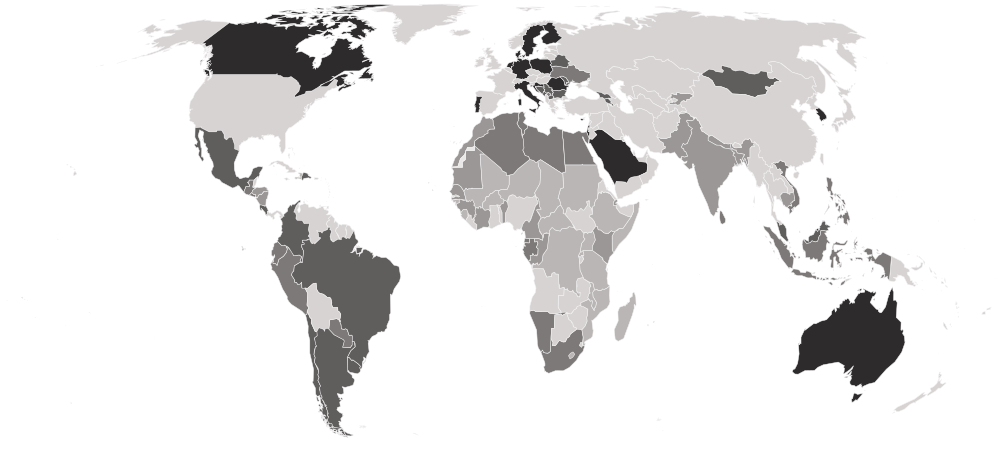
GNI per capita (PPP) on a map
Each country is shaded by its value, in five groups holding the same number of countries. Hover a country for its value, or select it to open its profile. Below the map, each continent’s middle country.
Darker is a higher value — the better end.
- 1,181–3,830
- 4,028–9,910
- 10,243–17,156
- 17,969–34,062
- 42,050–116,633
- No reading in 2025 (95 measured in an earlier edition)
- Europe
42,591
the middle country, of 20 measured · 49 members
 Denmark71,534
 Kosovo16,485
Highest and lowest reading in Europe.
- Americas
19,071
the middle country, of 17 measured · 48 members
 Canada56,432
 Haiti3,001
Highest and lowest reading in Americas.
- Asia
16,579
the middle country, of 22 measured · 52 members
Singapore116,633 Palestine4,625
Highest and lowest reading in Asia.
- Africa
4,028
the middle country, of 41 measured · 55 members
 Mauritius29,003Central African Republic1,181
Highest and lowest reading in Africa.
- Oceania
2 of 21 measured — too few for a middle: Australia, Samoa.
 Australia58,319
 Samoa8,553
Highest and lowest reading in Oceania.
- Every region
20 sub-regions, highest middle country first
- Western Asia
36,093
the middle country, of 6 measured · 19 members
 Saudi Arabia61,805Palestine4,625
Highest and lowest reading in Western Asia.
- Eastern Europe
31,690
the middle country, of 6 measured · 10 members
 Poland44,439
 Ukraine17,156
Highest and lowest reading in Eastern Europe.
- Southern Europe
30,626
the middle country, of 9 measured · 17 members
 Malta56,504Kosovo16,485
Highest and lowest reading in Southern Europe.
- South America
19,141
the middle country, of 8 measured · 12 members
 Chile29,817
 Ecuador14,256
Highest and lowest reading in South America.
- South-eastern Asia
15,189
the middle country, of 7 measured · 11 members
Singapore116,633 Cambodia6,909
Highest and lowest reading in South-eastern Asia.
- Northern Africa
12,959
the middle country, of 6 measured · 6 members
 Algeria15,908
 Sudan1,879
Highest and lowest reading in Northern Africa.
- Central America
12,254
the middle country, of 6 measured · 8 members
 Costa Rica25,809
 Honduras6,190
Highest and lowest reading in Central America.
- Southern Asia
9,153
the middle country, of 5 measured · 9 members
 Sri Lanka14,291
 Nepal5,351
Highest and lowest reading in Southern Asia.
- Middle Africa
5,004
the middle country, of 8 measured · 9 members
 Gabon16,784Central African Republic1,181
Highest and lowest reading in Middle Africa.
- Western Africa
3,526
the middle country, of 12 measured · 16 members
 Cabo Verde10,243
 Niger1,857
Highest and lowest reading in Western Africa.
- Eastern Africa
3,205
the middle country, of 12 measured · 19 members
Mauritius29,003Mozambique1,354Highest and lowest reading in Eastern Africa.
- Australia and New Zealand
1 of 2 measured — too few for a middle: Australia.
Australia58,319Highest and lowest reading in Australia and New Zealand.
- Caribbean
2 of 24 measured — too few for a middle: Dominican Republic, Haiti.
 Dominican Republic23,723Haiti3,001
Highest and lowest reading in Caribbean.
- Central Asia
1 of 5 measured — too few for a middle: Kyrgyzstan.
 Kyrgyzstan8,966
Highest and lowest reading in Central Asia.
- Eastern Asia
3 of 8 measured — too few for a middle: Hong Kong, Mongolia, South Korea.
 Hong Kong75,243
 Mongolia17,969
Highest and lowest reading in Eastern Asia.
- Northern America
1 of 4 measured — too few for a middle: Canada.
Canada56,432Highest and lowest reading in Northern America.
- Northern Europe
3 of 13 measured — too few for a middle: Denmark, Finland, Sweden.
Denmark71,534 Finland55,772
Highest and lowest reading in Northern Europe.
- Polynesia
1 of 7 measured — too few for a middle: Samoa.
Samoa8,553Highest and lowest reading in Polynesia.
- Southern Africa
3 of 5 measured — too few for a middle: Lesotho, Namibia, South Africa.
 South Africa13,036
 Lesotho3,220
Highest and lowest reading in Southern Africa.
- Western Europe
2 of 9 measured — too few for a middle: Germany, Netherlands.
 Netherlands70,745
 Germany65,564
Highest and lowest reading in Western Europe.
03The whole field at once
The spread
102 countries, one dot each, on one scale — further right is a higher value. Half the countries are above 14,273; a quarter are above 29,597, and a quarter below 4,930. The bar in each row marks that continent’s middle country.
04All 197 ever measured
Every country
In order, highest value first. “=” marks a position shared with another country. World Bank Group ranks nobody on this measure; the position is derived here by ordering the published values. Editorially loaded in the way GDP per capita is: calling a richer country a better one is an opinion no publisher here has offered, so this is left out of the Country Index.
Showing 25 of 197 countries





























































































































































Values for 2025. The change column compares 2025 with 2024 only; the sparkline covers the recent editions.
051994–2025 · 32 reference years
Over time
Each point is one reference year from 1994, in constant 2021 international dollars at purchasing power parity, so inflation and exchange rates are already out of it.
- the middle country
- the middle half of countries
- the middle of the 59 countries measured every time
- each continent’s middle country
The same, year by year
| Year | Countries | Middle country | Middle half | Measured every time |
|---|---|---|---|---|
| 2025 | 102 | 14,273 | 4,930 – 29,597 | 15,877 |
| 2024 | 151 | 15,805 | 6,142 – 41,081 | 15,079 |
| 2023 | 157 | 16,174 | 6,481 – 41,041 | 14,365 |
| 2022 | 158 | 15,721 | 6,221 – 40,846 | 14,093 |
| 2021 | 197 | 15,904 | 5,973 – 36,871 | 14,104 |
| 2020 | 158 | 14,248 | 5,629 – 36,697 | 12,841 |
| 2019 | 157 | 15,042 | 5,827 – 39,176 | 14,235 |
| 2018 | 157 | 15,031 | 5,577 – 38,277 | 14,009 |
| 2017 | 156 | 14,623 | 5,494 – 37,481 | 13,787 |
| 2016 | 154 | 14,253 | 5,487 – 35,533 | 13,192 |
| 2015 | 153 | 13,939 | 5,406 – 35,116 | 13,245 |
| 2014 | 151 | 14,142 | 5,275 – 34,816 | 13,272 |
| 2013 | 149 | 13,751 | 5,277 – 33,411 | 13,189 |
| 2012 | 146 | 14,440 | 5,245 – 34,030 | 13,023 |
| 2011 | 145 | 13,245 | 5,058 – 33,676 | 12,560 |
| 2010 | 144 | 13,117 | 4,963 – 34,927 | 11,735 |
| 2009 | 139 | 12,729 | 4,739 – 34,548 | 11,037 |
| 2008 | 136 | 14,014 | 5,262 – 36,450 | 11,884 |
| 2007 | 133 | 13,219 | 5,237 – 36,850 | 11,386 |
| 2006 | 130 | 13,301 | 5,104 – 35,196 | 10,897 |
| 2005 | 125 | 13,608 | 5,211 – 34,270 | 10,046 |
| 2004 | 123 | 12,087 | 4,863 – 34,376 | 9,144 |
| 2003 | 123 | 11,361 | 4,470 – 33,680 | 8,817 |
| 2002 | 123 | 11,099 | 4,603 – 32,455 | 8,687 |
| 2001 | 120 | 11,031 | 4,675 – 31,557 | 8,678 |
| 2000 | 117 | 11,060 | 4,796 – 30,327 | 8,709 |
| 1999 | 108 | 9,998 | 4,551 – 29,368 | 8,562 |
| 1998 | 105 | 9,666 | 4,222 – 28,370 | 8,452 |
| 1997 | 104 | 9,426 | 4,151 – 27,523 | 8,058 |
| 1996 | 101 | 9,310 | 4,028 – 27,370 | 7,741 |
| 1995 | 99 | 9,170 | 3,792 – 27,574 | 7,681 |
| 1994 | 81 | 8,014 | 3,482 – 20,460 | 7,774 |
062024 → 2025
Who rose and fell
The biggest changes in value between the two newest editions — reference years recalculated in one report, not two separate publications. Places are shown second, because they also move when other countries do.
Improved most
before → afterDeclined most
before → after Brunei80,625 → 78,957 · 6th → 2nd−1,667
- Gabon18,253 → 16,784 · 69th → 42nd−1,468
- Saudi Arabia63,211 → 61,805 · 15th → 8th−1,405
 Republic of the Congo5,608 → 5,151 · 117th → 76th−457
 Namibia10,960 → 10,536 · 93rd → 59th−424
102 countries were measured in both 2024 and 2025. The field changed from 151 to 102 countries, so a place can move for reasons that have nothing to do with the country itself.
07Across every edition
GNI per capita (PPP) in records
The extremes of the statistic. A record reached by more than one country names none of them.
Highest reading on record
133,563
GNI per capita (constant 2021 international $, PPP)
Lowest reading on record
390
GNI per capita (constant 2021 international $, PPP)
Biggest improvement between editions
+35,287
70,516 → 105,803
Biggest decline between editions
−49,667
122,611 → 72,945
Most improved since first measured
+62,086
54,547 → 116,633
At the top most often
11 of 32
editions, alone at the first-listed end
08The measure
About GNI per capita (PPP)
Gross national income per capita counts what a country’s residents EARN, wherever in the world they earn it, where GDP counts what is produced inside its borders. The two part company most for countries living on remittances and for those hosting foreign operations whose profits go home.
What the number is: GNI per capita (constant 2021 international $, PPP).
09Where it fits
Connections
Its part in the Country Index, the statistics whose values line up most closely with it across countries, and others on the same subject.
In the Country Index
Context, with no vote
This statistic is published in full under Economy & Innovation and Development & Human Capital, but does not help decide any Country Index standing.
Economy & InnovationDevelopment & Human CapitalWhich statistics vote, and why
Moves with
Where GNI per capita (PPP) is higher, these tend to be higher too.
- GDP per Capita (PPP)KeyWorld Bank Group · 102 countries in commonρ 1.00
- Human Development IndexKeyUNDP Human Development Report Office · 101 countries in commonρ 0.97
- GDP per Person EmployedWorld Bank Group · 98 countries in commonρ 0.97
Moves against
Where GNI per capita (PPP) is higher, these tend to be lower.
- Gender Inequality IndexKeyUNDP Human Development Report Office · 96 countries in commonρ −0.91
- Self-Employment RateILO · 98 countries in commonρ −0.90
- Under-Five Mortality RateKeyUN IGME · 101 countries in commonρ −0.89
Rank correlation (ρ, from −1 to 1) across countries, on each statistic’s newest edition, out of 93 statistics sharing at least 80 countries with this one. Two statistics that move together do not cause each other.
10Keep reading
Explore further
The countries at either end
More from World Bank Group
11Questions
GNI per capita (PPP): questions and answers
Which country has the highest GNI per capita (PPP)?
Singapore, at 116,633, among the 102 countries compared in 2025.
Which country has the lowest GNI per capita (PPP)?
Central African Republic, at 1,181, among the 102 countries compared in 2025.
How many countries does the GNI per Capita (PPP) cover?
102 in 2025, and 197 at least once across all editions. The number measured varies from 81 to 197 between editions.
What is the world average GNI per capita (PPP)?
This site does not calculate a world average, which would depend on how countries are weighted. In the middle country of the 102 compared in 2025, the figure was 14,273.
Is this World Bank Group’s own ranking?
No. World Bank Group publishes the values but ranks nobody; the position on this page is derived by Nations Inquiry by ordering the published values, and equal values share a position.
How often is the GNI per Capita (PPP) published?
This site holds 32 reference years, 1994–2025, all recalculated in World Bank Group’s 2026 report on one method — not 32 separate publications.
Where does the data come from, and can I download it?
From World Bank Group, under CC BY 4.0. Pulled from the World Bank’s indicator API (NY.GNP.PCAP.PP.KD). 1990–1993 are not imported: fewer than 80 countries reported. Every edition is available on this site’s Datasets pages as a full table, unrounded.
12Method
Sources, method and citation
Source
GNI per Capita (PPP) — World Bank Group
Pulled from the World Bank’s indicator API (NY.GNP.PCAP.PP.KD). 1990–1993 are not imported: fewer than 80 countries reported.
Newest edition
Report year 2025Data year 2025
Cite the source as: World Bank. World Development Indicators. Washington, DC: World Bank Group.
Licence: CC BY 4.0, checked 2026-09-06.
How this page reads the numbers
- World Bank Group ranks nobody on this measure. The position is derived by Nations Inquiry by ordering the published values; equal values share a position.
- Which end is better follows the publisher’s own reading of the measure.
- A country is named at an end only when it holds that value alone. Where several share it, the page says how many and names none first.
- Values are stored exactly as published and trimmed only for display. “The middle country” is the median of the countries measured, not a world average.
The full note on this data
32 reference years (1994–2025), covering 81 to 197 countries, pulled from the World Bank’s indicator API (NY.GNP.PCAP.PP.KD). Gross national income counts what a country’s residents EARN, wherever in the world they earn it, where GDP counts what is PRODUCED inside its borders — so the two part company most for countries living on remittances (GNI higher) and for those hosting large foreign operations whose profits go home (GNI lower). Both are converted at purchasing power parities so a dollar buys the same basket everywhere, which is what makes them comparable and also what makes them estimates rather than measurements. ⚠ 1990–1993 are not imported: fewer than 80 countries reported. ⚠ These are not 32 published reports — see `restatedByReport`, which names the World Development Indicators release this was pulled from. ⚠ A statistic, not an index, and editorially loaded in the way GDP per capita is: calling a richer country a better one is an opinion no publisher here has offered, so it is left out of the Country Index. No rank is published, so none is stored; the POSITION shown on the statistics page is derived here by ordering the score, and labelled as ours.
Photographs
The countries at the top of this statistic, from their profiles: Wikimedia Commons, shown in greyscale, each used under the licence named.
- Singapore — Khairul Nizam ., CC BY 2.0
- Brunei — kulimpapat derivative work: Inkey, CC BY 2.0
- Hong Kong — Base64 and Derivative work by Globe-trotter, CC BY-SA 3.0
Cite this page
Nations Inquiry (2026). GNI per capita (PPP) by country: GNI per Capita (PPP), data from World Bank Group. https://nationsinquiry.com/statistics/gni-per-capita