Loading…
Growth Lab at Harvard University · Economic Complexity Index
Economic Complexity Index by country
How much productive know-how does a country's exports reveal?
Japan placed first of the 145 countries compared in 2024, at 1.729, and Chad last, at -3.530. In the middle country the figure was 0.131. Among the 140 countries measured in every edition since 1995, the middle one moved from 0.094 to 0.127.
Part ofEconomy & Innovation
Economic Complexity Index · 2024
Key statistic · Economy & Innovation

Highest of 145Japan
1.729012024 · Growth Lab at Harvard University’s rank
Who leads
The three countries at the highest end of 145 compared, the three at the other end, and the first on each continent.
 1
1Photo: JurriaanH · CC BY-SA 3.0, greyscale
 2
2Photo: xiangyang17 · CC BY-SA 2.0, greyscale
 3
3Photo: Unknown author · CC BY-SA 2.0, greyscale


Lowest in 2024
- 145
 Chad-3.530
 - 144
 DR Congo-3.126
 - 143
 Equatorial Guinea-2.731
Ranks out of 145. Where a country sits says how it compares with the others measured, and nothing about why.
Highest on each continent
- Africa
 Tunisia0.565
 - Americas
 United States1.122
 - AsiaJapan1.729
- Europe
 Switzerland1.584
 - Oceania
 New Zealand0.523
3 of 21 measured
- Every region
02Every measured country
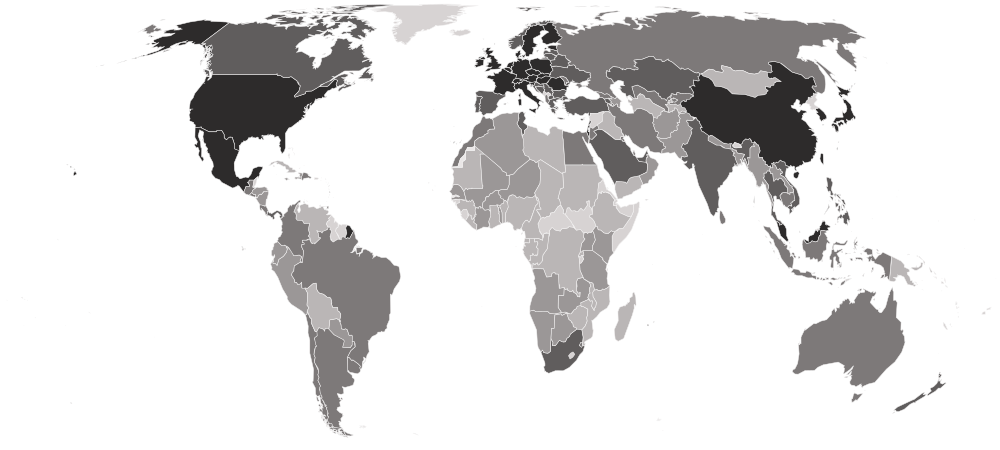
Economic Complexity Index on a map
Each country is shaded by its value, in five groups holding the same number of countries. Hover a country for its value, or select it to open its profile. Below the map, each continent’s middle country.
Darker is a higher value — the better end.
- -3.530–-0.980
- -0.978–-0.102
- -0.071–0.349
- 0.359–0.828
- 0.860–1.729
- No reading in 2024
- Europe
0.948
the middle country, of 35 measured · 49 members
Switzerland1.584 Albania0.032
Highest and lowest reading in Europe.
- Asia
0.259
the middle country, of 43 measured · 52 members
Japan1.729 Yemen-1.682
Highest and lowest reading in Asia.
- Americas
-0.005
the middle country, of 24 measured · 48 members
United States1.122 Venezuela-1.601
Highest and lowest reading in Americas.
- Africa
-0.979
the middle country, of 40 measured · 55 members
Tunisia0.565Chad-3.530Highest and lowest reading in Africa.
- Oceania
3 of 21 measured — too few for a middle: Australia, New Zealand, Papua New Guinea.
New Zealand0.523 Papua New Guinea-2.137
Highest and lowest reading in Oceania.
- Every region
20 sub-regions, highest middle country first
- Eastern Asia
1.436
the middle country, of 6 measured · 8 members
Japan1.729 Mongolia-1.568
Highest and lowest reading in Eastern Asia.
- Western Europe
1.168
the middle country, of 6 measured · 9 members
Switzerland1.584 Netherlands0.948
Highest and lowest reading in Western Europe.
- Northern Europe
1.012
the middle country, of 9 measured · 13 members
 United Kingdom1.246
 Norway0.726
Highest and lowest reading in Northern Europe.
- Eastern Europe
0.884
the middle country, of 10 measured · 10 members
 Czechia1.323
 Moldova0.203
Highest and lowest reading in Eastern Europe.
- Southern Europe
0.738
the middle country, of 10 measured · 17 members
 Slovenia1.277Albania0.032
Highest and lowest reading in Southern Europe.
- South-eastern Asia
0.672
the middle country, of 9 measured · 11 members
 Singapore1.520
 Myanmar-0.943
Highest and lowest reading in South-eastern Asia.
- Central America
0.334
the middle country, of 7 measured · 8 members
 Mexico0.942
 Nicaragua-0.891
Highest and lowest reading in Central America.
- Western Asia
0.300
the middle country, of 16 measured · 19 members
 Israel1.334Yemen-1.682
Highest and lowest reading in Western Asia.
- Central Asia
0.212
the middle country, of 5 measured · 5 members
 Kazakhstan0.363
 Tajikistan-1.399
Highest and lowest reading in Central Asia.
- Southern Asia
-0.102
the middle country, of 7 measured · 9 members
 India0.705
 Afghanistan-0.818
Highest and lowest reading in Southern Asia.
- South America
-0.166
the middle country, of 10 measured · 12 members
 Brazil0.349Venezuela-1.601
Highest and lowest reading in South America.
- Caribbean
-0.351
the middle country, of 5 measured · 24 members
 Trinidad and Tobago0.056
 Cuba-1.048
Highest and lowest reading in Caribbean.
- Northern Africa
-0.514
the middle country, of 6 measured · 6 members
Tunisia0.565 Sudan-2.078
Highest and lowest reading in Northern Africa.
- Western Africa
-0.970
the middle country, of 12 measured · 16 members
 Senegal-0.507
 Liberia-2.284
Highest and lowest reading in Western Africa.
- Eastern Africa
-1.007
the middle country, of 11 measured · 19 members
 Mauritius0.287
 Mozambique-1.227
Highest and lowest reading in Eastern Africa.
- Middle Africa
-2.531
the middle country, of 7 measured · 9 members
 Angola-0.768Chad-3.530
Highest and lowest reading in Middle Africa.
- Australia and New Zealand
2 of 2 measured — too few for a middle: Australia, New Zealand.
New Zealand0.523 Australia0.131
Highest and lowest reading in Australia and New Zealand.
- Melanesia
1 of 5 measured — too few for a middle: Papua New Guinea.
Papua New Guinea-2.137Highest and lowest reading in Melanesia.
- Northern America
2 of 4 measured — too few for a middle: Canada, United States.
United States1.122 Canada0.778
Highest and lowest reading in Northern America.
- Southern Africa
4 of 5 measured — too few for a middle: Botswana, Eswatini, Namibia, South Africa.
 South Africa0.378
 Namibia-0.520
Highest and lowest reading in Southern Africa.
03The whole field at once
The spread
145 countries, one dot each, on one scale — further right is a higher value. Half the countries are above 0.131; a quarter are above 0.751, and a quarter below -0.835. The bar in each row marks that continent’s middle country.
04All 145 ever measured
Every country
In order, highest value first. “=” marks a rank shared with another country. This is built from trade in GOODS, so it describes service economies and single-resource exporters poorly: a wealthy oil exporter scores low because oil requires little accumulated know-how, which is the index's argument rather than an error in it.
Showing 25 of 145 countries

































































































Values for 2024. The change column compares 2024 with 2023 only; the sparkline covers the recent editions.
051995–2024 · 30 reference years
Over time
Each point is one year from 1995. The whole series is recalculated at each release, so the line can shift when the Growth Lab updates its method.
- the middle country
- the middle half of countries
- the middle of the 140 countries measured every time
- each continent’s middle country
The same, year by year
| Year | Countries | Middle country | Middle half | Measured every time |
|---|---|---|---|---|
| 2024 | 145 | 0.131 | -0.835 – 0.751 | 0.127 |
| 2023 | 145 | 0.071 | -1.023 – 0.775 | 0.069 |
| 2022 | 145 | 0.058 | -0.823 – 0.786 | 0.047 |
| 2021 | 145 | 0.001 | -0.940 – 0.817 | -0.003 |
| 2020 | 145 | 0.047 | -0.909 – 0.800 | 0.040 |
| 2019 | 145 | 0.030 | -0.961 – 0.804 | 0.026 |
| 2018 | 145 | -0.015 | -0.894 – 0.793 | -0.020 |
| 2017 | 145 | 0.008 | -0.836 – 0.819 | -0.056 |
| 2016 | 145 | -0.066 | -0.941 – 0.769 | -0.072 |
| 2015 | 145 | -0.060 | -0.860 – 0.787 | -0.063 |
| 2014 | 145 | -0.019 | -0.806 – 0.796 | -0.020 |
| 2013 | 145 | 0.014 | -0.801 – 0.801 | -0.008 |
| 2012 | 145 | 0.006 | -0.931 – 0.799 | -0.031 |
| 2011 | 145 | -0.014 | -0.857 – 0.783 | -0.045 |
| 2010 | 145 | -0.002 | -0.798 – 0.779 | -0.024 |
| 2009 | 145 | 0.099 | -0.823 – 0.764 | 0.071 |
| 2008 | 145 | 0.070 | -0.833 – 0.789 | 0.054 |
| 2007 | 145 | -0.008 | -0.802 – 0.762 | -0.033 |
| 2006 | 145 | 0.074 | -0.795 – 0.748 | 0.069 |
| 2005 | 144 | 0.051 | -0.872 – 0.724 | 0.051 |
| 2004 | 144 | 0.051 | -0.794 – 0.714 | 0.051 |
| 2003 | 144 | 0.045 | -0.857 – 0.682 | 0.045 |
| 2002 | 144 | 0.010 | -0.801 – 0.663 | 0.010 |
| 2001 | 144 | 0.047 | -0.780 – 0.671 | 0.047 |
| 2000 | 144 | 0.016 | -0.752 – 0.687 | 0.016 |
| 1999 | 140 | 0.125 | -0.715 – 0.651 | 0.125 |
| 1998 | 140 | 0.201 | -0.745 – 0.675 | 0.201 |
| 1997 | 140 | 0.131 | -0.776 – 0.696 | 0.131 |
| 1996 | 140 | 0.154 | -0.800 – 0.761 | 0.154 |
| 1995 | 140 | 0.094 | -0.754 – 0.696 | 0.094 |
062023 → 2024
Who rose and fell
The biggest changes in value between the two newest editions — reference years recalculated in one report, not two separate publications. Places are shown second, because they also move when other countries do.
Improved most
before → after Haiti-1.167 → -0.558 · 122nd → 101st+0.609
 Togo-1.239 → -0.637 · 125th → 103rd+0.602
- Sudan-2.582 → -2.078 · 145th → 138th+0.504
- Afghanistan-1.277 → -0.818 · 127th → 108th+0.459
 Burkina Faso-1.132 → -0.708 · 119th → 106th+0.424
Declined most
before → after- Chad-2.495 → -3.530 · 144th → 145th−1.035
 Gabon-0.784 → -1.797 · 102nd → 137th−1.013
 Republic of the Congo-1.592 → -2.531 · 137th → 142nd−0.939
- Liberia-1.472 → -2.284 · 134th → 141st−0.812
- DR Congo-2.450 → -3.126 · 143rd → 144th−0.676
145 countries were measured in both 2023 and 2024.
07Across every edition
Economic Complexity Index in records
The extremes of the statistic. A record reached by more than one country names none of them.
Highest reading on record
2.100
ECI score (standardised, roughly −3 to +3)
Lowest reading on record
-3.530
ECI score (standardised, roughly −3 to +3)
Biggest improvement between editions
+1.676
-2.628 → -0.952
Biggest decline between editions
−1.594
-0.258 → -1.852
Most improved since first measured
+1.716
-1.685 → 0.031
At the top most often
30 of 30
editions, alone at the first-listed end
08The measure
About Economic Complexity Index
The Economic Complexity Index measures the productive know-how a country has accumulated, read from what it manages to export. A country scores highly when it exports many different things and when few other countries can make them.
What the number is: ECI score (standardised, roughly −3 to +3).
What it does not measure
It is read from goods exports, so services and production sold only at home are invisible to it, and it measures capability, not income or wellbeing.
09Where it fits
Connections
Its part in the Country Index, the statistics whose values line up most closely with it across countries, and others on the same subject.
In the Country Index
A key statistic for Economy & Innovation
“What an economy knows how to make, read from the diversity and rarity of what it exports.”
- Edition used
- 2024 (data 2024)
- Countries
- 145
- Licence
- CC0 1.0
Moves with
Where Economic Complexity Index is higher, these tend to be higher too.
- Global Innovation IndexWorld Intellectual Property Organization · 129 countries in commonρ 0.90
- ICT Goods ExportsKeyUNCTAD · 99 countries in commonρ 0.85
- Human Capital IndexWorld Bank Group · 138 countries in commonρ 0.84
Moves against
Where Economic Complexity Index is higher, these tend to be lower.
- Gender Inequality IndexKeyUNDP Human Development Report Office · 140 countries in commonρ −0.84
- Under-Five Mortality RateKeyUN IGME · 143 countries in commonρ −0.83
- Maternal Mortality RatioKeyMMEIG · 143 countries in commonρ −0.79
Rank correlation (ρ, from −1 to 1) across countries, on each statistic’s newest edition, out of 116 statistics sharing at least 80 countries with this one. Two statistics that move together do not cause each other.
10Analysis
Charts and analysis on Economic Complexity Index


11Keep reading
Explore further
The subject
The countries at either end
12Questions
Economic Complexity Index: questions and answers
Which country has the highest Economic Complexity Index?
Japan, at 1.729, among the 145 countries compared in 2024.
Which country has the lowest Economic Complexity Index?
Chad, at -3.530, among the 145 countries compared in 2024.
How many countries does the Economic Complexity Index cover?
145 in 2024. The number measured varies from 140 to 145 between editions.
What is the world average Economic Complexity Index?
This site does not calculate a world average, which would depend on how countries are weighted. In the middle country of the 145 compared in 2024, the figure was 0.131.
Is this Growth Lab at Harvard University’s own ranking?
Yes. The rank shown is the one Growth Lab at Harvard University publishes.
How often is the Economic Complexity Index published?
This site holds 30 reference years, 1995–2024, all recalculated in Growth Lab at Harvard University’s 2026 report on one method — not 30 separate publications.
Where does the data come from, and can I download it?
From Growth Lab at Harvard University, under CC0 1.0. The Growth Lab's Harvard Dataverse deposit, version 12.0, on the HS92 trade classification. The rank shown is the Growth Lab's own. Every edition is available on this site’s Datasets pages as a full table, unrounded.
13Method
Sources, method and citation
Source
Economic Complexity Index — Growth Lab at Harvard University
The Growth Lab's Harvard Dataverse deposit, version 12.0, on the HS92 trade classification. The rank shown is the Growth Lab's own.
Newest edition
Report year 2024Data year 2024
Cite the source as: The Growth Lab at Harvard University. Growth Projections and Complexity Rankings, doi:10.7910/DVN/XTAQMC.
Licence: CC0 1.0, checked 2026-09-05.
How this page reads the numbers
- The rank is Growth Lab at Harvard University’s own, as published.
- Which end is better follows the publisher’s own reading of the measure.
- A country is named at an end only when it holds that value alone. Where several share it, the page says how many and names none first.
- Values are stored exactly as published and trimmed only for display. “The middle country” is the median of the countries measured, not a world average.
The full note on this data
30 reference years (1995–2024), covering 140 to 145 countries, on the HS92 trade classification, from the Growth Lab's "Growth Projections and Complexity Rankings" deposit (doi:10.7910/DVN/XTAQMC, version 12.0). The index measures the KNOW-HOW embedded in what a country exports: how diverse its export basket is, and how few other countries can make the same things. ⚠ THE RANK IS THE GROWTH LAB'S OWN and is stored as published — nothing is derived here. ⚠ THIRTY EDITIONS, ONE REPORT: version 12.0 recomputes every year back to 1995 on its current method, so these are not thirty published rankings. ⚠ IT IS BUILT FROM TRADE IN GOODS, so economies that live on services or on a single resource are described poorly — an oil exporter scores low however rich it is, which is the finding rather than a flaw. ⚠ THE DATA HAS BEEN ON DISK SINCE 2026-09-06 and unreachable, because no registry entry existed; adding one is the whole of what batch 8 did for it.
Photographs
The countries at the top of this statistic, from their profiles: Wikimedia Commons, shown in greyscale, each used under the licence named.
- Japan — JurriaanH, CC BY-SA 3.0
- Taiwan — xiangyang17, CC BY-SA 2.0
- South Korea — Unknown author, CC BY-SA 2.0
Cite this page
Nations Inquiry (2026). Economic Complexity Index by country: Economic Complexity Index, data from Growth Lab at Harvard University. https://nationsinquiry.com/statistics/economic-complexity