Growth Lab at Harvard University · Complexity Outlook Index
Complexity outlook by country
How many more complex products lie within easy reach of what a country already makes?
Of the 145 countries compared in 2024, India had the highest reading, 2.878, and Germany had the lowest reading, -1.682. In the middle country the figure was -0.225. Among the 140 countries measured in every edition since 1995, the middle one moved from -0.126 to -0.196.
Share
Part ofEconomy & Innovation
Complexity outlook · 2024
Context statistic

Highest of 145India
2.878012024 · values only
The highest and the lowest
The three countries with the highest values of 145 compared, the three with the lowest, and the highest on each continent. This statistic has no better end, so no country is shown as leading.
- 1
- 2

- 3

Highest on each continent
- Africa
 Egypt1.727
 - Americas
 United States1.372
 - AsiaIndia2.878
- EuropeSpain2.342
- Oceania
 New Zealand0.082
3 of 21 measured
- Every region
02Every measured country
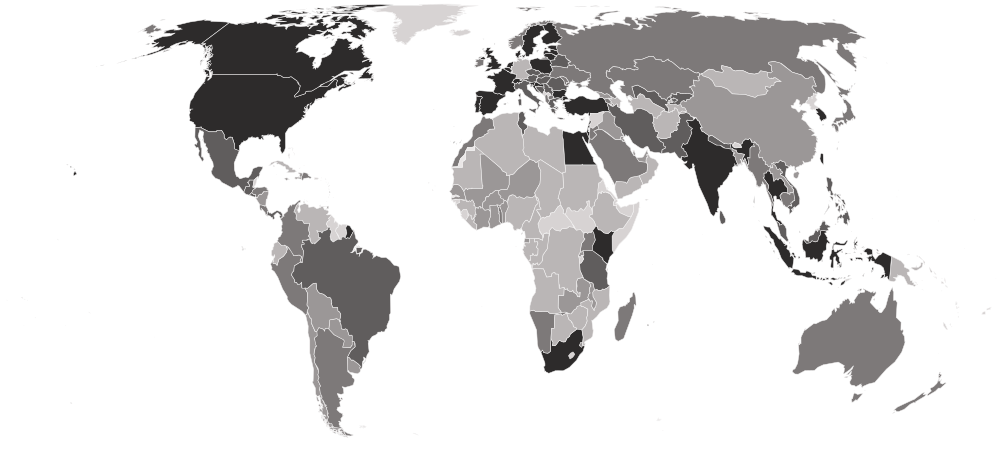
Complexity outlook on a map
Each country is shaded by its value, in five groups holding the same number of countries. Hover a country for its value, or select it to open its profile. Below the map, each continent’s middle country.
Darker is a higher value. This statistic has no better end, so the shades describe size, not success.
- -1.682–-1.036
- -1.025–-0.514
- -0.508–0.176
- 0.210–0.970
- 0.977–2.878
- No reading in 2024
- Europe
0.970
the middle country, of 35 measured · 49 members
Spain2.342 Germany-1.682
Highest and lowest reading in Europe.
- Americas
-0.237
the middle country, of 24 measured · 48 members
United States1.372 Venezuela-1.205
Highest and lowest reading in Americas.
- Asia
-0.271
the middle country, of 43 measured · 52 members
India2.878 Turkmenistan-1.252
Highest and lowest reading in Asia.
- Africa
-0.960
the middle country, of 40 measured · 55 members
Egypt1.727 Guinea-1.312
Highest and lowest reading in Africa.
- Oceania
3 of 21 measured — too few for a middle: Australia, New Zealand, Papua New Guinea.
New Zealand0.082 Papua New Guinea-1.196
Highest and lowest reading in Oceania.
- Every region
20 sub-regions, highest middle country first
- Western Europe
1.157
the middle country, of 6 measured · 9 members
 Netherlands1.889Germany-1.682
Highest and lowest reading in Western Europe.
- Northern Europe
1.144
the middle country, of 9 measured · 13 members
 Denmark1.398
 Norway-0.118
Highest and lowest reading in Northern Europe.
- Southern Europe
0.938
the middle country, of 10 measured · 17 members
Spain2.342 North Macedonia-0.080
Highest and lowest reading in Southern Europe.
- South-eastern Asia
0.821
the middle country, of 9 measured · 11 members
 Thailand1.518
 Laos-0.831
Highest and lowest reading in South-eastern Asia.
- Eastern Europe
0.755
the middle country, of 10 measured · 10 members
 Bulgaria1.547
 Russia-0.310
Highest and lowest reading in Eastern Europe.
- Eastern Asia
0.439
the middle country, of 6 measured · 8 members
 Taiwan1.784
 Mongolia-1.161
Highest and lowest reading in Eastern Asia.
- Southern Asia
0.265
the middle country, of 7 measured · 9 members
India2.878 Afghanistan-1.036
Highest and lowest reading in Southern Asia.
- Central America
0.254
the middle country, of 7 measured · 8 members
 Guatemala0.776
 Nicaragua-0.881
Highest and lowest reading in Central America.
- Central Asia
-0.508
the middle country, of 5 measured · 5 members
 Kyrgyzstan0.449Turkmenistan-1.252
Highest and lowest reading in Central Asia.
- South America
-0.616
the middle country, of 10 measured · 12 members
 Brazil0.210Venezuela-1.205
Highest and lowest reading in South America.
- Western Asia
-0.647
the middle country, of 16 measured · 19 members
Türkiye2.530 Yemen-1.250
Highest and lowest reading in Western Asia.
- Northern Africa
-0.741
the middle country, of 6 measured · 6 members
Egypt1.727 Sudan-1.301
Highest and lowest reading in Northern Africa.
- Caribbean
-0.822
the middle country, of 5 measured · 24 members
 Dominican Republic0.140
 Cuba-1.172
Highest and lowest reading in Caribbean.
- Eastern Africa
-0.842
the middle country, of 11 measured · 19 members
 Kenya1.035
 Zimbabwe-1.191
Highest and lowest reading in Eastern Africa.
- Western Africa
-0.960
the middle country, of 12 measured · 16 members
 Togo-0.440Guinea-1.312
Highest and lowest reading in Western Africa.
- Middle Africa
-1.130
the middle country, of 7 measured · 9 members
 Equatorial Guinea-0.993
 DR Congo-1.217
Highest and lowest reading in Middle Africa.
- Australia and New Zealand
2 of 2 measured — too few for a middle: Australia, New Zealand.
New Zealand0.082 Australia-0.019
Highest and lowest reading in Australia and New Zealand.
- Melanesia
1 of 5 measured — too few for a middle: Papua New Guinea.
Papua New Guinea-1.196Highest and lowest reading in Melanesia.
- Northern America
2 of 4 measured — too few for a middle: Canada, United States.
United States1.372 Canada1.311
Highest and lowest reading in Northern America.
- Southern Africa
4 of 5 measured — too few for a middle: Botswana, Eswatini, Namibia, South Africa.
 South Africa1.077
 Botswana-1.084
Highest and lowest reading in Southern Africa.
03The whole field at once
The spread
145 countries, one dot each, on one scale — further right is a higher value. Half the countries are above -0.225; a quarter are above 0.821, and a quarter below -0.910. The bar in each row marks that continent’s middle country.
04All 145 ever measured
Every country
In order, highest value first. No rank or position is shown: too many countries share the same value for an order to mean anything. Neither end is better. The index is low for economies with few productive capabilities, which have little within reach, and also for the most diversified, which already make most complex goods — so a leading industrial economy can sit at the very bottom. Read it beside the Economic Complexity Index: complexity says what a country can make now, the outlook how much more lies within reach.
Showing 25 of 145 countries



































































































Values for 2024. The change column compares 2024 with 2023 only; the sparkline covers the recent editions.
051995–2024 · 30 reference years
Over time
Each point is one year from 1995, on the Growth Lab's current method; each new release recalculates the whole series. A falling line can mean a country has run out of easy next steps — or that it has already taken them.
- the middle country
- the middle half of countries
- the middle of the 140 countries measured every time
- each continent’s middle country
The same, year by year
| Year | Countries | Middle country | Middle half | Measured every time |
|---|---|---|---|---|
| 2024 | 145 | -0.225 | -0.910 – 0.821 | -0.196 |
| 2023 | 145 | -0.235 | -0.971 – 0.778 | -0.209 |
| 2022 | 145 | -0.254 | -0.968 – 0.749 | -0.252 |
| 2021 | 145 | -0.208 | -0.983 – 0.787 | -0.189 |
| 2020 | 145 | -0.160 | -0.955 – 0.821 | -0.144 |
| 2019 | 145 | -0.147 | -0.975 – 0.823 | -0.132 |
| 2018 | 145 | -0.179 | -0.991 – 0.808 | -0.178 |
| 2017 | 145 | -0.147 | -0.978 – 0.820 | -0.146 |
| 2016 | 145 | -0.092 | -1.002 – 0.812 | -0.077 |
| 2015 | 145 | -0.142 | -1.014 – 0.773 | -0.092 |
| 2014 | 145 | -0.079 | -0.994 – 0.730 | -0.055 |
| 2013 | 145 | -0.107 | -0.983 – 0.800 | -0.088 |
| 2012 | 145 | -0.061 | -0.980 – 0.775 | -0.053 |
| 2011 | 145 | -0.115 | -0.988 – 0.775 | -0.106 |
| 2010 | 145 | -0.081 | -0.967 – 0.810 | -0.069 |
| 2009 | 145 | 0.010 | -1.035 – 0.758 | 0.026 |
| 2008 | 145 | 0.010 | -1.012 – 0.833 | 0.001 |
| 2007 | 145 | -0.039 | -1.041 – 0.783 | -0.041 |
| 2006 | 145 | 0.001 | -1.024 – 0.841 | 0.003 |
| 2005 | 144 | -0.126 | -0.966 – 0.832 | -0.110 |
| 2004 | 144 | -0.127 | -0.990 – 0.806 | -0.089 |
| 2003 | 144 | -0.167 | -0.994 – 0.824 | -0.153 |
| 2002 | 144 | -0.152 | -0.989 – 0.859 | -0.125 |
| 2001 | 144 | -0.085 | -0.975 – 0.827 | -0.056 |
| 2000 | 144 | -0.054 | -0.936 – 0.821 | -0.032 |
| 1999 | 140 | -0.226 | -0.924 – 0.857 | -0.226 |
| 1998 | 140 | -0.155 | -0.956 – 0.926 | -0.155 |
| 1997 | 140 | -0.149 | -0.914 – 0.909 | -0.149 |
| 1996 | 140 | -0.082 | -0.930 – 0.846 | -0.082 |
| 1995 | 140 | -0.126 | -0.936 – 0.894 | -0.126 |
062023 → 2024
Who rose and fell
The biggest changes in value between the two newest editions — reference years recalculated in one report, not two separate publications. Places are shown second, because they also move when other countries do.
Rose most
before → after Panama-0.717 → 0.398+1.115
- Togo-0.971 → -0.440+0.531
 Indonesia0.908 → 1.288+0.380
- United States1.079 → 1.372+0.293
 Namibia-0.767 → -0.493+0.274
Fell most
before → after United Arab Emirates0.446 → -0.707−1.153
- Spain2.977 → 2.342−0.635
 Mali-0.617 → -1.025−0.408
 Ethiopia-0.716 → -1.090−0.374
 Vietnam1.197 → 0.871−0.326
145 countries were measured in both 2023 and 2024.
07Across every edition
Complexity outlook in records
The extremes of the statistic. A record reached by more than one country names none of them.
Highest reading on record
3.151
Complexity Outlook Index (standardised; roughly −2.5 to +3)
Lowest reading on record
-2.421
Complexity Outlook Index (standardised; roughly −2.5 to +3)
Biggest rise between editions
+1.354
0.339 → 1.693
Biggest fall between editions
−1.405
0.821 → -0.584
Biggest change since first measured
+1.840
-0.113 → 1.727
Highest most often
2 countries share this record — no holder is named
10 of 30
editions
08The measure
About complexity outlook
The Complexity Outlook Index, from Harvard's Growth Lab, measures how many complex products lie close to what a country already exports — close meaning they draw on similar know-how. A high reading means plenty of nearby opportunities to move into more sophisticated goods; a low one means few.
What the number is: Complexity Outlook Index (standardised; roughly −2.5 to +3).
09Where it fits
Connections
Its part in the Country Index, the statistics whose values line up most closely with it across countries, and others on the same subject.
In the Country Index
Context, with no vote
This statistic is published in full under Economy & Innovation, but does not help decide any Country Index standing.
Moves with
Where complexity outlook is higher, these tend to be higher too.
- Economic Complexity IndexKeyGrowth Lab at Harvard University · 145 countries in commonρ 0.80
- Frontier Technology Readiness IndexUNCTAD · 142 countries in commonρ 0.70
- Statistical Performance IndicatorsKeyWorld Bank Group · 142 countries in commonρ 0.69
Moves against
Where complexity outlook is higher, these tend to be lower.
- Export Concentration IndexUNCTAD · 145 countries in commonρ −0.76
- Commodity Export DependenceUNCTAD · 143 countries in commonρ −0.69
- Population Under Age 15UN DESA Population Division · 145 countries in commonρ −0.63
Rank correlation (ρ, from −1 to 1) across countries, on each statistic’s newest edition, out of 359 statistics sharing at least 80 countries with this one. Two statistics that move together do not cause each other.
10Keep reading
Explore further
The subject
More from Growth Lab at Harvard University
11Questions
Complexity outlook: questions and answers
Which country has the highest complexity outlook?
India, at 2.878, among the 145 countries compared in 2024.
Which country has the lowest complexity outlook?
Germany, at -1.682, among the 145 countries compared in 2024.
How many countries does the Complexity Outlook Index cover?
145 in 2024. The number measured varies from 140 to 145 between editions.
What is the world average complexity outlook?
This site does not calculate a world average, which would depend on how countries are weighted. In the middle country of the 145 compared in 2024, the figure was -0.225.
Is this Growth Lab at Harvard University’s own ranking?
No ranking is shown. Growth Lab at Harvard University publishes values only, and too many countries share the same value for an ordering to mean anything, so none is derived.
How often is the Complexity Outlook Index published?
This site holds 30 reference years, 1995–2024, all recalculated in Growth Lab at Harvard University’s 2026 report on one method — not 30 separate publications.
Where does the data come from, and can I download it?
From Growth Lab at Harvard University, under CC0 1.0. The Growth Lab's International Trade Data (HS, 92) deposit on Harvard Dataverse, dedicated to the public domain. Only the economies the Growth Lab admits to its own rankings in each year are shown — those that meet its thresholds for trade volume, population and data quality. Every edition is on this site’s Datasets pages as a full table, and downloads as a CSV file with every value unrounded.
12Method
Sources, method and citation
Source
Complexity Outlook Index — Growth Lab at Harvard University
The Growth Lab's International Trade Data (HS, 92) deposit on Harvard Dataverse, dedicated to the public domain. Only the economies the Growth Lab admits to its own rankings in each year are shown — those that meet its thresholds for trade volume, population and data quality.
Newest edition
Report year 2024Data year 2024
Cite the source as: The Growth Lab at Harvard University. International Trade Data (HS, 92), doi:10.7910/DVN/T4CHWJ, Harvard Dataverse.
Licence: CC0 1.0, checked 2026-10-03.
How this page reads the numbers
- No rank or position is shown: Growth Lab at Harvard University publishes values only, and too many countries share the same value for an ordering to mean anything.
- This statistic has no better end, so the page describes higher and lower values and never calls a country a leader.
- A country is named at an end only when it holds that value alone. Where several share it, the page says how many and names none first.
- Values are stored exactly as published and trimmed only for display. “The middle country” is the median of the countries measured, not a world average.
The file itself, column by column — where it came from, what each column holds, and every edition as a CSV — is on its dataset page.
Cite this page
Nations Inquiry (2026). Complexity outlook by country: Complexity Outlook Index, data from Growth Lab at Harvard University. https://nationsinquiry.com/statistics/complexity-outlook