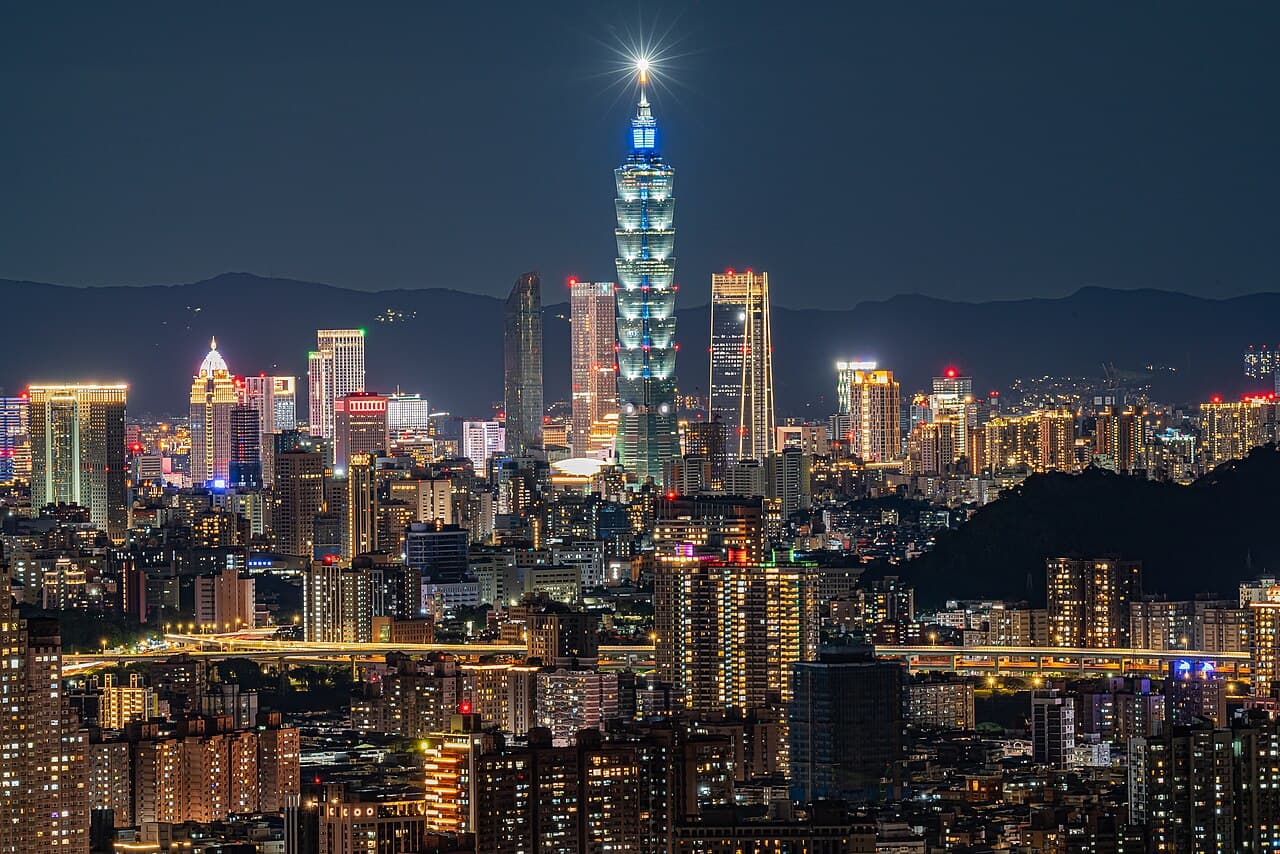
Photo: xiangyang17 · CC BY-SA 2.0 · via Wikimedia Commons, shown in greyscale

Taiwan
Taiwan places highest on Economic Complexity Index (top 1% worldwide) and lowest on Official Development Assistance Given (% of GNI) (bottom 1%).
Share
Taiwan in the Nations Inquiry Country Index
Taiwan appears in 184 of the statistics tracked here, but is not placed in the Country Index: the index needs a standing on three quarters of its topics, and Taiwan is measured on too few of them. Every published reading below is unaffected.
At a glance
Population
23,317,145
people
since 1950
Land area
35,410
km²
since 1961
Life expectancy
80.56
years at birth
since 1950
The newest published figure for each, the year it describes and who published it, with a line showing how it has moved.
01The country
About Taiwan
Taiwan rises steeply from the sea across the Taiwan Strait from the Chinese mainland, pushed up where two tectonic plates collide. The Central Mountain Range runs down its length, crowned by Yushan, or Jade Mountain, and on the east coast it drops almost straight into the Pacific, cut by the marble walls of Taroko Gorge. The west is a broad plain of rice fields, fish ponds and cities. The Penghu islands lie in the strait, typhoons arrive most summers, and earthquakes are frequent.
Austronesian peoples settled the island thousands of years ago, and their languages are thought to have spread from the island across the Pacific and Indian Oceans. Dutch and Spanish traders built forts in the seventeenth century until Koxinga drove the Dutch out in 1662, and the Qing dynasty took the island in 1683. Japan ruled it from 1895 to 1945. In 1949, at the end of the Chinese Civil War, the government of the Republic of China withdrew to Taiwan; martial law, imposed that year, was lifted in 1987.
Folk temples to Mazu, goddess of the sea, are among the busiest on the island, and her yearly procession from Dajia draws pilgrims who walk for days behind her palanquin. Night markets sell oyster omelettes, stinky tofu and beef noodle soup, and bubble tea was first served here in the 1980s. Hsinchu’s science park anchors a chip-making industry that supplies electronics makers worldwide, alongside machine tools, bicycles from Taichung, petrochemicals and high-mountain oolong tea.
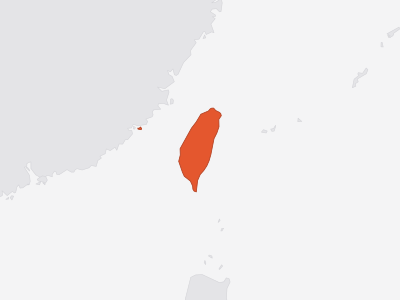
Key facts about Taiwan
- Capital
- Taipei
- Official languages
- Amis, Atayal, Bunun +19 more
- Currency
- New Taiwan dollar (TWD)
- ISO code
- TWN · TW
- Domain · dialling
- .tw · +886
As Wikidata records them. Official languages are the least consistent — some countries list only a national language, others every regional one. Sources and licences.
02Country Index 2026
Where it stands, topic by topic
Strongest first. Each position is Taiwan’s place among the countries with a standing on that topic, built from a few key statistics chosen to measure different things.
2ndof 183
From 3 of 4 key statistics
joint7thof 177
From 3 of 4 key statistics
16thof 177
From 3 of 4 key statistics
21stof 198
From 4 of 4 key statistics
joint19thof 159
From 3 of 3 key statistics
30thof 198
From 4 of 4 key statistics
30thof 194
From 3 of 4 key statistics
joint143rdof 186
From 2 of 4 key statistics
No standing — Taiwan holds too few of this subject’s key statistics to be placed on it.
No standing — Taiwan holds too few of this subject’s key statistics to be placed on it.
No standing — Taiwan holds too few of this subject’s key statistics to be placed on it.
No standing — Taiwan holds too few of this subject’s key statistics to be placed on it.
No standing — Taiwan holds too few of this subject’s key statistics to be placed on it.
No standing — Taiwan holds too few of this subject’s key statistics to be placed on it.
No standing — Taiwan holds too few of this subject’s key statistics to be placed on it.
No standing — Taiwan holds too few of this subject’s key statistics to be placed on it.
Each standing is built from a few key statistics chosen to measure different things. Select a subject for Taiwan’s readings on it, or see every statistic held for Taiwan in the table further down this page.
03Highs and lows
Where Taiwan stands out
The two ends of its own record: every statistic on which Taiwan sits within ten places of the best or worst in the world, plus its strongest and weakest readings overall. Each is turned into a percentile — its place among every country measured — which is what lets a hunger score and a press-freedom rank be compared at all.
Where Taiwan does best10 of 15
In the top third of all countries measured. 15 are within ten places of the best in the world, in a field of at least 50 countries — marked with that place.
- 1stDeaths in Organized Violencetop 35%
Position · derived 59th of 59 · 1 = worst · 0 · 2025
world median 0
- 2nd
- 3rd
Position · derived 3rd of 79 · 547.09 · 2022
world median 442.09 (better)
- 4thFreedom of Religiontop 2%
Position · derived 4th of 176 · 2.607 · 2025
world median 1.296 (better) · ▲ 3 pts since 2015
- 4th
Position · derived 4th of 176 · 0.652 · 2025
world median 0.298 (better) · ▲ 15 pts since 2015
- 4thPISA Science Performancetop 4%
Position · derived 4th of 79 · 537.38 · 2022
world median 446.93 (better) · ▲ 12 pts since 2012
- 5th
Position · derived 5th of 172 · 2.944 · 2025
world median 0.756 (better) · ▲ 14 pts since 2015
- 5th
Position · derived 153rd of 157 · 1 = worst · 0.049 · 2025
world median 4.252 (better)
- 5thPISA Reading Performancetop 5%
Position · derived 5th of 79 · 515.17 · 2022
world median 440.35 (better) · ▲ 7 pts since 2012
- 6th
Position · derived 6th of 176 · 3.245 · 2025
world median 0.333 (better) · ▲ 18 pts since 2015
5 more in every statistic for Taiwan.
Where Taiwan struggles most5
In the bottom third of all countries measured.
Not ranked by the publisher · 0.05 · 2025
world median 0.27 (worse) · ▼ 3 pts since 2018
- CO₂ Emissions per Capitabottom 9%
Position · derived 20th of 210 · 1 = worst · 11.3 · 2024
world median 3.21 (worse)
- Length of Paid Maternity Leavebottom 10%
Not ranked by the publisher · 56 · 2025
world median 98 (worse)
- Armed Forces Personnel (% of population)bottom 11%
Not ranked by the publisher · 0.92 · 2019
world median 0.26 (worse)
- Agreement That Vaccines Are Safebottom 13%
Position · derived 126th of 144 · 56.6 · 2018
world median 77.65 (worse)
A band is a place among the countries each publisher scores, so Taiwan can move because other countries moved. See the Country Index for the full method.
04Over time
Which way it is moving
The published rank in widely quoted reports, edition by edition — each end with the size of that year’s field.
Corruption Perceptions Index
Transparency International
36th
of 173 · 2012
24th
of 181 · 2025
Ranked in 14 of 14 editions
Economic Complexity Index
Growth Lab at Harvard University
8th
of 140 · 1995
2nd
of 145 · 2024
Ranked in 30 of 30 editions
Government AI Readiness Index
Oxford Insights
18th
of 160 · 2021
31st
of 195 · 2025
Ranked in 5 of 6 editions
05In context
Taiwan and its neighbours
A position reads best beside the countries around it. Every position below is a place in the world ranking, not within the region.
Shares a land border with
Taiwan has no land border with another country.
Across Eastern Asia
Every country in the sub-region, by its position in the world.
- 13
 South Korea
- 15
 Japan
- 42
 Hong Kong
- 49
 China
- 75
 Mongolia
- —
 Macaunot placed
- —
 North Koreanot placed
- —Taiwannot placed
06The evidence
Every statistic we hold for Taiwan
Grouped by topic. Each row gives the newest edition’s rank or position, the published value and the year the numbers describe. Select a statistic for this country’s row beside every other country, the world median and every edition.
Governance & Institutions32
- Bribery IncidenceWorld Bank Group · Firms asked for a bribe at least once in six dealings with officials (%)168th of 175position · derived · 1 = worst0.172026
- Central Bank Independence IndexAna Carolina Garriga, University of Essex · CBI index (0–1, where 1 is the most statutory independence)bottom 4%0.2732023
- Child and Family Benefit CoverageILO · Children or households with children receiving child or family cash benefits (%)bottom 46%19.82024
- Civic Space RatingsCIVICUS · Civic space score (0–100)19th of 198position · derived87.922025
- Control of CorruptionWorld Bank Group · Control of Corruption (−2.5 to 2.5)28th of 211position · derived1.1832025
- Corruption Perceptions IndexTransparency International · CPI score (0–100, where 100 is very clean)24th of 181rank682025
- Disability Benefit CoverageILO · People with severe disabilities receiving disability benefits (%)top 46%48.92025
- Equal Protection IndexV-Dem Institute, University of Gothenburg · Equal protection index (0–1); higher = rights and freedoms protected more equally across social groups and classes14th of 176position · derived0.9222025
- Firms Expecting to Make Informal Payments to Public OfficialsWorld Bank Group · Firms saying firms like theirs pay officials informally to get things done (%)132nd of 178position · derived · 1 = worst2.4312026
- Global Indicators of Regulatory Governance ScoreWorld Bank Group · Regulatory governance score (0–5, where 5 is the most transparent rule-making)top 4%52018
- Government AI Readiness IndexOxford Insights · AI readiness score (0–100)31st of 195rank64.812025
- Government EffectivenessWorld Bank Group · Governance estimate (−2.5 weak to 2.5 strong)19th of 209position · derived1.5112025
- GovTech Maturity IndexWorld Bank Group · GTMI score (0–1)60th of 196position · derived0.8052025
- Judicial Constraints on the Executive IndexV-Dem Institute, University of Gothenburg · Judicial constraints on the executive index (0–1)58th of 175position · derived0.7942025
- Liberal Democracy IndexV-Dem Institute, University of Gothenburg · Liberal democracy index (0–1)28th of 176position · derived0.7042025
- Meritocratic Appointment in the State AdministrationV-Dem Institute, University of Gothenburg · Original latent estimate (≈ −2.9 to +3.6); higher = more appointments on merit28th of 176position · derived1.5362025
- Neopatrimonial Rule IndexV-Dem Institute, University of Gothenburg · Neopatrimonial rule index (0–1; higher = more personalised rule)139th of 176position · derived · 1 = worst0.1442025
- Old-Age Pension CoverageILO · People above statutory pensionable age receiving an old-age pension (%)top 30%99.32025
- Open Data InventoryOpen Data Watch · ODIN overall score (0–100)54th of 168rank662024
- Political Corruption IndexV-Dem Institute, University of Gothenburg · Political corruption index (0–1; higher = more corrupt)130th of 176position · derived · 1 = worst0.2142025
- Regulatory QualityWorld Bank Group · Regulatory Quality (−2.5 to 2.5)23rd of 209position · derived1.1952025
- Rigorous and Impartial Public AdministrationV-Dem Institute, University of Gothenburg · Original latent estimate (≈ −3.6 to +4.0); higher = a more rigorous and impartial administration6th of 176position · derived3.2452025
- Rule of LawWorld Bank Group · Rule of Law estimate (−2.5 to 2.5)30th of 211position · derived1.2012025
- Senior Management Time Spent on Government RegulationWorld Bank Group · Senior management time spent dealing with government regulation (% of a typical week)top 49%6.8252026
- State Capacity IndexJonathan K. Hanson (University of Michigan) and Rachel Sigman (Naval Postgraduate School) · Latent estimate of state capacity (≈ −2.3 to +3.0, centred near 0); higher = a more capable state31st of 166position · derived1.4552015
- State Fiscal Source of RevenueV-Dem Institute, University of Gothenburg · Original latent estimate (≈ −2.9 to +3.1); higher = broader taxation9th of 176position · derived2.7372025
- Trade Union DensityILO · Employees who are trade union members (%)19th of 139position · derived32.232020
- V-Dem Electoral Democracy IndexV-Dem Institute, University of Gothenburg · Electoral democracy index (0–1)28th of 176position · derived0.8012025
- Voice and AccountabilityWorld Bank Group · Voice and Accountability estimate (−2.5 to 2.5)35th of 206position · derived1.0472025
- Women, Business and the LawWorld Bank Group · WBL Index (0–100, where 100 is full legal parity)43rd of 190position · derived91.252025
Economy & Innovation23
- Actual Individual Consumption per Capita (PPP)World Bank Group · Actual individual consumption per capita (PPP, current international $)22nd of 173position · derived33,0612021
- Complexity Outlook IndexGrowth Lab at Harvard University · Complexity Outlook Index (standardised; roughly −2.5 to +3)top 3%1.7842024
- Creative Goods ExportsUNCTAD · Creative goods exports (% of merchandise exports)top 23%2.6672024
- Creative Services ExportsUNCTAD · Creative services exports (% of services exports)top 28%13.022024
- Digitally-Deliverable Services ExportsUNCTAD · Digitally-deliverable services exports (% of services exports)35th of 170position · derived49.032024
- Economic Complexity IndexGrowth Lab at Harvard University · ECI score (standardised, roughly −3 to +3)2nd of 145rank1.6212024
- Export Concentration IndexUNCTAD · Export concentration index (0–1, normalised Herfindahl–Hirschman)top 41%0.3652025
- Firms Competing Against Informal FirmsWorld Bank Group · Firms competing against unregistered or informal firms (%)105th of 181position · derived · 1 = worst37.042026
- Firms with an International Quality CertificationWorld Bank Group · Firms with an internationally recognised quality certification (%)top 4%35.332026
- Foreign Direct Investment InflowsUNCTAD · FDI inflows (% of GDP)bottom 34%1.1982025
- Foreign Value Added Share of Gross ExportsOECD · Foreign value added (% of gross exports)top 37%32.32022
- Gini Index of Disposable Income (SWIID)Frederick Solt, University of Iowa · Gini index of disposable household income (0–100), SWIID estimate61st of 79position · derived · 1 = worst29.22023
- Historical GDP per Capita (Maddison)GGDC · GDP per capita (2011 international $)11th of 166position · derived53,1432022
- Liner Shipping Connectivity IndexUNCTAD · LSCI (index, average Q1 2023 = 100)15th of 175rank318.022026
- Logistics Performance IndexWorld Bank Group · LPI score (1–5)13th of 139rank3.92023
- Management Practices IndexWorld Bank Group · Management practices index, medium and large firms (0–100)46th of 169position · derived58.172026
- Merchant Fleet by Country of OwnershipUNCTAD · Merchant fleet owned (thousand dead-weight tons)top 4%66,1842026
- New Business DensityWorld Bank Group · New limited liability companies registered per 1,000 people aged 15–64bottom 43%1.9892024
- Price Level of Household ConsumptionGGDC · Price level of household consumption (US output price level in 2021 = 1)bottom 47%0.5132023
- Scholarly ArticlesOurResearch · Articles with at least one author at an institution in the country (full counting)top 13%42,5412025
- Services ExportsUNCTAD · Services exports (% of GDP)bottom 37%7.0082025
- Terms of Trade IndexUNCTAD · Terms of trade index (2015 = 100)bottom 30%93.92025
- Total Factor Productivity LevelGGDC · TFP level at current PPPs (USA = 1)top 24%0.8252023
Work & Labour8
- Average Weekly Hours WorkedILO · Average weekly hours actually worked per employed person91st of 182position · derived38.92025
- Employment Injury Protection CoverageILO · Labour force covered in the event of a work injury (%)top 17%87.72024
- Firms Offering Formal TrainingWorld Bank Group · Firms offering formal training to permanent full-time workers (%)top 14%55.212026
- Labour Productivity per Hour WorkedILO · Output per hour worked (constant 2021 international $ at PPP)22nd of 182position · derived69.882025
- Length of Paid Maternity LeaveWorld Bank Group · Paid maternity leave set in law (calendar days)bottom 10%562025
- Length of Paid Paternity LeaveWorld Bank Group · Paid paternity leave set in law (calendar days)top 30%92025
- Unemployment Benefit CoverageILO · Unemployed people receiving unemployment benefits (%)top 36%6.92024
Education & Knowledge7
- Academic Freedom IndexV-Dem Institute, University of Gothenburg · Academic freedom index (0–1)46th of 176position · derived0.8282025
- Intergenerational Persistence in EducationWorld Bank Group · Correlation between own and parents' years of schooling, born 1980–89 (0–1)77th of 153position · derived · 1 = worst0.4462017
- Nobel Prize Laureates by Country of BirthNobel Prize Outreach · Laureates born in the country, 1901 to date (people)bottom 20%12025
- PISA Mathematics PerformanceOECD · Mean mathematics score3rd of 79position · derived547.092022
- PISA Reading PerformanceOECD · Mean reading score5th of 79position · derived515.172022
- PISA Science PerformanceOECD · Mean science score4th of 79position · derived537.382022
- Trust in ScientistsWellcome Trust · People aged 15+ who trust scientists in their country 'a lot' (%)bottom 24%20.62020
Health & Wellbeing21
- Adolescent Birth Rate (Ages 15–19)UN DESA Population Division · Live births per 1,000 women aged 15–19206th of 222position · derived · 1 = worst3.0182023
- Adult Mortality (Probability of Dying Between 15 and 60)UN DESA Population Division · Deaths before age 60 per 1,000 people alive at 15, at that year's death rates147th of 222position · derived · 1 = worst94.52023
- Adults Who Have Been Too Anxious or Depressed to Carry OnWellcome Trust · People aged 15+ who have ever been too anxious or depressed to continue their usual activities for two weeks or more (%)bottom 1%2.9342020
- Agreement That Vaccines Are SafeWellcome Trust · People aged 15+ who agree that vaccines are safe (% of those who had heard of vaccines)126th of 144position · derived56.62018
- Coefficient of Variation of Habitual Caloric ConsumptionFAO · Coefficient of variation of habitual calorie consumption across the population (standard deviation ÷ mean)top 31%0.222024
- Contraceptive Prevalence (Any Method)UN DESA Population Division · Share of all women aged 15–49 using any contraceptive method (%)top 29%50.62023
- Cost of a Healthy DietFAO · Cost of the cheapest locally available healthy diet, PPP dollars per person per daytop 16%5.482025
- Days Above 35°CECMWF · Days a year with a maximum temperature above 35°C, averaged over the country’s landtop 16%02025
- Demand for Family Planning Satisfied by Modern MethodsUN DESA Population Division · Share of women aged 15–49 wanting to avoid pregnancy who use a modern method (%)34th of 196position · derived82.72023
- Dietary Energy SupplyFAO · Dietary energy supply (kcal per person per day)80th of 155position · derived2,9742024
- Excess Mortality During the COVID-19 PandemicAriel Karlinsky and Dmitry Kobak (World Mortality Dataset) · Excess deaths per 100,000 people, March 2020 to the end of each country's data (at most December 2023)top 24%160.22026
- Fish and Seafood Supply per PersonFAO · Fish and seafood available as food (kg per person per year, live-weight equivalent)top 16%30.42023
- Fruit Supply per PersonFAO · Fruit available as food, excluding wine (kg per person per year)top 40%94.382023
- Life Expectancy at Age 65UN DESA Population Division · Further years a 65-year-old would live at current death rates39th of 222position · derived20.182023
- Life Expectancy at BirthUN DESA Population Division · Years a newborn would live at current death rates47th of 222position · derived80.562023
- Meat Supply per PersonFAO · Meat available as food (kg per person per year, carcass weight)top 14%91.52023
- Modern Contraceptive PrevalenceUN DESA Population Division · Share of all women aged 15–49 using a modern contraceptive method (%)top 26%46.42023
- Pesticide Use per HectareFAO · Pesticide use (kg per hectare of cropland)23rd of 178position · derived13.582024
- Share of Population Unable to Afford a Healthy DietFAO · Share of the population unable to afford a healthy diet (%)121st of 145position · derived · 1 = worst3.82025
- Vegetable Supply per PersonFAO · Vegetables available as food (kg per person per year)top 40%120.822023
Development & Human Capital3
- Multidimensional Poverty MeasureWorld Bank Group · Multidimensional poverty headcount ratio (%)153rd of 157position · derived · 1 = worst0.0492025
- Official Development Assistance Given (% of GNI)OECD Development Assistance Committee · ODA given (% of the provider's GNI, grant equivalent)bottom 1%0.052025
- Poverty Headcount at $3.00 a Day, Line-up EstimatesWorld Bank Group · Population below $3.00 a day, 2021 PPP, World Bank line-up estimate (%)top 4%02024
Environment & Sustainability18
- Agricultural EmissionsFAO · Farm-gate emissions (kt CO₂eq)107th of 193position · derived7,6172023
- Agricultural Emissions IntensityFAO · Greenhouse gases from farming per value of agricultural output (kg CO₂eq per international dollar)171st of 190position · derived · 1 = worst0.582023
- Burned AreaGWIS · Burned area (hectares)bottom 28%107.332025
- CO₂ Emissions per CapitaGlobal Carbon Project · Fossil CO₂ (tonnes per person)20th of 210position · derived · 1 = worst11.32024
- Consumption-Based CO₂ EmissionsGlobal Carbon Project · Consumption-based fossil CO₂ (million tonnes of carbon)top 17%80.462023
- Cropland Nitrogen BalanceFAO · Nitrogen surplus (+) or deficit (−) on cropland, kg per hectaretop 9%176.962023
- Energy Intensity of GDP (PPP)EIA · Energy use per dollar of GDP (thousand Btu per US$ at PPP)bottom 38%3.1892024
- Fisheries and Aquaculture ProductionFAO · Fish, crustaceans, molluscs and other aquatic animals caught or farmed, tonnes (live weight)top 10%1,134,7732024
- Livestock DensityFAO · Livestock units per hectare of agricultural land13th of 188position · derived3.122023
- Mangrove AreaGlobal Mangrove Watch (Aberystwyth University, JAXA, soloEO, Wetlands International, The Nature Conservancy) · Mangrove forest area (hectares)bottom 32%604.032025
- Methane EmissionsEDGAR · Methane emissions (gigagrams of CH₄)top 38%553.782025
- Municipal Solid Waste GenerationWorld Bank Group · Municipal solid waste generated (kg per person per day)54th of 201position · derived · 1 = worst1.3572026
- Operating Coal Power CapacityGlobal Energy Monitor · Coal-fired capacity in operation (megawatts)top 12%16,1932026
- Operating Wind Power CapacityGlobal Energy Monitor · Wind farm capacity in operation (megawatts)top 17%4,3962026
- Organic Agricultural AreaFAO · Organic share of agricultural land (%)50th of 150position · derived2.612024
- Solar Electricity Installed CapacityEIA · Solar generating capacity installed (gigawatts)top 8%14.282024
- Temperature Change on LandFAO · Change in mean land-surface temperature against the country's own 1951–1980 average, °Cbottom 39%1.3142025
- Tree Cover LossWorld Resources Institute — Global Forest Watch (data: University of Maryland) · Tree cover loss (hectares, where canopy cover exceeded 30% in 2000)bottom 47%3,0572025
Gender & Equality5
- Firms with Female Participation in OwnershipWorld Bank Group · Firms with at least one woman among the owners (%)8th of 181position · derived61.222026
- Mean Age at First Marriage, WomenUN DESA Population Division · Singulate mean age at marriage, women (years)top 30%27.62019
- Sex Ratio at BirthUN DESA Population Division · Male births per 100 female birthstop 15%106.82023
- Social Institutions and Gender IndexOECD · SIGI score (0 = no discrimination, 100 = absolute)134th of 140position · derived · 1 = worst9.22023
- Women's Political Empowerment IndexV-Dem Institute, University of Gothenburg · Women's political empowerment index (0–1)27th of 176position · derived0.9032025
Democracy & Civil Liberties17
- Deliberative Democracy IndexV-Dem Institute, University of Gothenburg · Deliberative democracy index (0–1)28th of 176position · derived0.6852025
- Egalitarian Democracy IndexV-Dem Institute, University of Gothenburg · Egalitarian democracy index (0–1)22nd of 176position · derived0.7022025
- Exclusion by Socio-Economic GroupV-Dem Institute, University of Gothenburg · Exclusion by socio-economic group index (0–1; higher = more exclusion)153rd of 174position · derived · 1 = worst0.0732023
- Freedom of Expression and Alternative Sources of Information IndexV-Dem Institute, University of Gothenburg · Freedom of expression index (0–1)49th of 176position · derived0.8382025
- Freedom of Foreign MovementV-Dem Institute, University of Gothenburg · Original latent estimate (≈ −3.6 to +2.9); higher = freer movement62nd of 176position · derived1.7082025
- Freedom of Peaceful AssemblyV-Dem Institute, University of Gothenburg · Original latent estimate (≈ −3.5 to +3.5); higher = more freedom5th of 172position · derived2.9442025
- Freedom of ReligionV-Dem Institute, University of Gothenburg · Original latent estimate (≈ −3.5 to +3); higher = more religious freedom4th of 176position · derived2.6072025
- Government Censorship of the MediaV-Dem Institute, University of Gothenburg · Original latent estimate (≈ −3 to +3.5); higher = less censorship61st of 176position · derived1.1172025
- Government Dissemination of False Information (Domestic)V-Dem Institute, University of Gothenburg · Original latent estimate (≈ −3.6 to +3.2); higher = less disinformation45th of 176position · derived0.9932025
- Government Internet ShutdownsV-Dem Institute, University of Gothenburg · Original latent estimate (≈ −4 to +2); higher = fewer shutdowns84th of 176position · derived1.0822025
- Mass MobilizationV-Dem Institute, University of Gothenburg · Original latent estimate (≈ −3.6 to +4); higher = more and larger eventstop 11%1.9482025
- Military Dimension IndexV-Dem Institute, University of Gothenburg · Military dimension index (0–1; higher = larger military role)top 21%02025
- Participatory Democracy IndexV-Dem Institute, University of Gothenburg · Participatory democracy index (0–1)4th of 176position · derived0.6522025
- Perceptions of Electoral Integrity IndexEIP · Electoral Integrity Index (0–100; higher = greater electoral integrity)top 22%70.032025
- Physical Violence IndexV-Dem Institute, University of Gothenburg · Freedom from political killings and torture (0–1)18th of 176position · derived0.9712025
- Political PolarizationV-Dem Institute, University of Gothenburg · Original latent estimate (≈ −3.8 to +3.9); higher = more polarized141st of 172position · derived · 1 = worst-1.1562025
Peace & Security9
- Armed Forces Personnel (% of population)U.S. Department of State · Active-duty armed forces personnel (% of population)bottom 11%0.922019
- Arms Imports (% of total imports)U.S. Department of State · Arms imports (% of all imports of goods and services)top 28%0.62019
- Civilian Deaths in Organized ViolenceUCDP · Civilians killed in organized violence (people)top 37%02025
- Deaths in Non-State ConflictUCDP · Deaths in non-state conflict (people)top 43%02025
- Deaths in Organized ViolenceUCDP · Deaths in organized violence (people)59th of 59position · derived · 1 = worst02025
- Deaths in State-Based Armed ConflictUCDP · Deaths in state-based armed conflict (people)top 39%02025
- Government Cyber Security CapacityV-Dem Institute, University of Gothenburg · Original latent estimate (≈ −3.6 to +3.7); higher = more capacity9th of 176position · derived2.292025
- Political Stability and Absence of ViolenceWorld Bank Group · Political Stability estimate (−2.5 to 2.5)45th of 211position · derived0.9992025
- Political Violence by Non-State ActorsV-Dem Institute, University of Gothenburg · Original latent estimate (≈ −3.5 to +4); higher = more violence147th of 171position · derived · 1 = worst-2.1462025
Risk & Resilience3
- Firms Whose Assets Were Damaged by Extreme WeatherWorld Bank Group · Firms whose physical assets were damaged by extreme weather (%)26th of 163position · derived · 1 = worst17.792026
- Per Capita Food Supply VariabilityFAO · Year-to-year variability of the food supply (kcal per person per day)top 37%252024
- World Risk Poll Resilience IndexLloyd's Register Foundation · Resilience Index, 0–100 (higher = more reported capacity to cope with a shock; the mean of individual, household, community and societal sub-indices)top 15%642023
Mobility & Trade6
- Cereal Import Dependency RatioFAO · Share of the cereal supply that is imported (%)top 28%78.32022
- Container Import Dwell TimeWorld Bank Group · Median days a full import container waits in port88th of 156position · derived · 1 = worst3.92024
- EmigrantsUN DESA Population Division · Migrants from the country living abroad, mid-year (people)top 34%832,5072024
- International MigrantsUN DESA Population Division · International migrants living in the country, mid-year (people)top 25%1,136,4252024
- Net Migration RateUN DESA Population Division · Net migrants per 1,000 populationbottom 29%-1.4062023
Money & Public Finance2
- Firms Using Banks to Finance InvestmentWorld Bank Group · Firms using banks to finance investment in fixed assets (%)bottom 42%24.232026
- Share of Firms' Payments Made ElectronicallyWorld Bank Group · Payments made electronically in a typical month, excluding payroll and payments to government (%)bottom 46%61.382026
Energy6
- Crude Oil ProductionEIA · Crude oil produced (thousand barrels per day)top 46%0.1962025
- Firms Identifying Electricity as a Major ConstraintWorld Bank Group · Firms rating electricity a major or very severe constraint (%)119th of 179position · derived · 1 = worst18.942026
- Firms Owning or Sharing a GeneratorWorld Bank Group · Firms owning or sharing a generator (%)top 41%20.872026
- Natural Gas ProductionEIA · Dry natural gas produced (billion cubic metres)top 37%0.062024
- Primary Energy Consumption per CapitaEIA · Energy use per person (million Btu)top 9%197.732024
- Primary Energy ProductionEIA · Primary energy produced (quadrillion Btu)top 39%0.2622024
Digital & Technology10
- Anthropic AI Usage IndexAnthropic · Claude usage index (1 = in proportion to working-age population)top 25%2.082026
- Firms Experiencing Internet DisruptionsWorld Bank Group · Firms that experienced internet outages or slow-downs (%)43rd of 163position · derived · 1 = worst47.092026
- Firms with Their Own WebsiteWorld Bank Group · Firms with their own website (%)42nd of 181position · derived79.992026
- GitHub DevelopersGitHub · Developer accounts located in the economy (as of quarter end)top 11%1,890,2592026
- GitHub Git PushesGitHub · Git pushes during the quartertop 14%2,565,3082025
- GitHub RepositoriesGitHub · Public repositories located in the economy (as of quarter end)top 11%4,585,8642026
- Internet Use Among AdultsWorld Bank Group · Adults who used the internet in the past three months (% of population aged 15+)38th of 140position · derived90.232024
- Mobile Phone OwnershipWorld Bank Group · Adults who own a mobile phone (% of population aged 15+)34th of 140position · derived95.572024
- Smartphone OwnershipWorld Bank Group · Adults whose main mobile phone is a smartphone (% of population aged 15+)24th of 140position · derived89.232024
People & Population14
- Crude Birth RateUN DESA Population Division · Births per 1,000 populationbottom 2%5.6782023
- Crude Death RateUN DESA Population Division · Deaths per 1,000 populationtop 32%8.8062023
- Historical Index of Ethnic FractionalizationLenka Dražanová, European University Institute (Migration Policy Centre) · Ethnic fractionalization index (0–1): the probability that two randomly drawn people belong to different ethnic groupsbottom 42%0.3732013
- Mean Age at ChildbearingUN DESA Population Division · Mean age of mothers at the birth of their children (years)top 8%31.882023
- Median Age of the PopulationUN DESA Population Division · Median age (years)top 10%43.542023
- Population Aged 65 and OverUN DESA Population Division · Share of the total population aged 65 and over (%)top 19%18.332023
- Population DensityUN DESA Population Division · People per square kilometre of landtop 6%658.492023
- Population Growth RateUN DESA Population Division · Population growth (% per year)bottom 11%-0.4532023
- Population Living in Cities (Degree of Urbanisation)UN DESA Population Division · Share of the population living in cities as the Degree of Urbanisation defines them (%)top 5%78.142025
- Population Under Age 15UN DESA Population Division · Share of the total population aged 0–14 (%)bottom 2%11.942023
- Sex Ratio of the Total PopulationUN DESA Population Division · Males per 100 femalesbottom 47%98.222023
- Total Dependency RatioUN DESA Population Division · People aged 0–14 and 65+ per 100 people aged 15–64bottom 14%43.412023
- Total Fertility RateUN DESA Population Division · Live births per womanbottom 1%0.872023
07Method
Sources and how to read them
How to read this page
- The scores and ranks belong to their publishers. Nothing is adjusted, rescaled or re-ranked; each is reproduced from the edition named beside it. Where a row says position · derived, the publisher ranks nobody on that measure and the position is ours, made by ordering the published score.
- Each statistic shows its newest edition, which is not always the edition the Country Index uses: the index pins every source to one data year so its average compares like with like.
How a standing is built from percentiles, why Taiwan can move because other countries moved, and why publishers measure between 120 and 215 countries each are set out in full in how a standing is made and what a standing cannot tell you.
Sources
- Statistics: 38 publishers, each named beside its numbers, with every edition and licence on the datasets pages.
- Capital, languages, currency, codes: Wikidata, public domain (CC0).
- Map and land borders: Natural Earth, public domain. Borders are de facto — where administration actually changes — not claimed.
Photographs
The photograph of Taiwan on this page comes from Wikimedia Commons and is shown in greyscale. The photographer and the licence are named beside each one.
Cite this page
Nations Inquiry (2026). Taiwan: country statistics, rankings and trends. https://nationsinquiry.com/countries/taiwan