Jonathan K. Hanson (University of Michigan) and Rachel Sigman (Naval Postgraduate School) · State Capacity Index
State capacity by country
How able is the state to raise revenue, keep order across its territory and run its administration?
Denmark placed first of the 166 countries compared in 2015, at 2.6970, and Somalia last, at -2.0960. In the middle country the figure was 0.4867. Among the 102 countries measured in every edition since 1960, the middle one moved from -0.2520 to 0.5891.
Share
Part ofGovernance & Institutions
State capacity · 2015
Context statistic

Highest of 166Denmark
2.6970012015 · position · derived
Who leads
The three countries at the highest end of 166 compared, the three at the other end, and the first on each continent.
 1
1Photo: User:Aconcagua · CC BY-SA 3.0, greyscale
 2
2Photo: Ximonic , Simo Räsänen · CC BY-SA 3.0, greyscale
 3
3Photo: chensiyuan · CC BY-SA 4.0, greyscale

Lowest in 2015
- 166
 Somalia-2.0960
 - 165
 Central African Republic-1.5410
 - 164
 Yemen-1.4420
Positions out of 166. Where a country sits says how it compares with the others measured, and nothing about why.
Highest on each continent
- Africa
 Mauritius0.9300
 - Americas
 Canada2.0950
 - Asia
 South Korea1.9610
 - EuropeDenmark2.6970
- Oceania
 New Zealand2.2350
 - Every region
02Every measured country
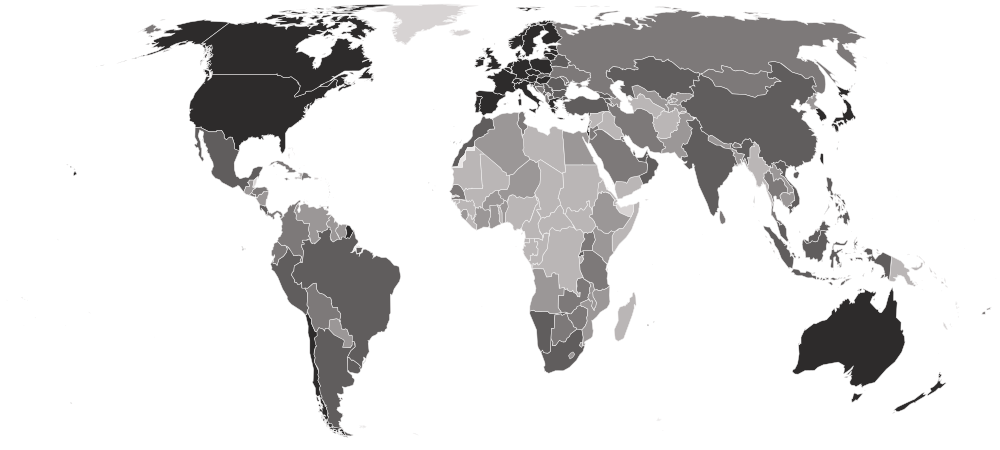
State capacity on a map
Each country is shaded by its value, in five groups holding the same number of countries. Hover a country for its value, or select it to open its profile. Below the map, each continent’s middle country.
Darker is a higher value — the better end.
- -2.0960–-0.1567
- -0.1073–0.2661
- 0.2706–0.6490
- 0.6551–1.4060
- 1.4180–2.6970
- No reading in 2015
- Europe
1.5170
the middle country, of 37 measured · 49 members
Denmark2.6970 Kosovo-0.2738
Highest and lowest reading in Europe.
- Americas
0.5687
the middle country, of 26 measured · 48 members
Canada2.0950 Haiti-1.1520
Highest and lowest reading in Americas.
- Asia
0.4871
the middle country, of 46 measured · 52 members
South Korea1.9610Yemen-1.4420Highest and lowest reading in Asia.
- Oceania
0.4425
the middle country, of 5 measured · 21 members
New Zealand2.2350 Solomon Islands-0.7057
Highest and lowest reading in Oceania.
- Africa
-0.0789
the middle country, of 52 measured · 55 members
Mauritius0.9300Somalia-2.0960Highest and lowest reading in Africa.
- Every region
20 sub-regions, highest middle country first
- Western Europe
2.2865
the middle country, of 6 measured · 9 members
 Austria2.4790
 France1.6420
Highest and lowest reading in Western Europe.
- Northern Europe
2.0090
the middle country, of 9 measured · 13 members
Denmark2.6970 Latvia1.4740
Highest and lowest reading in Northern Europe.
- Southern Europe
1.2030
the middle country, of 12 measured · 17 members
 Spain2.0030Kosovo-0.2738
Highest and lowest reading in Southern Europe.
- Eastern Europe
1.0905
the middle country, of 10 measured · 10 members
 Czechia1.5860
 Ukraine0.3095
Highest and lowest reading in Eastern Europe.
- Eastern Asia
1.0848
the middle country, of 6 measured · 8 members
South Korea1.9610 North Korea0.1979
Highest and lowest reading in Eastern Asia.
- South-eastern Asia
0.6269
the middle country, of 10 measured · 11 members
 Singapore1.6720
 Myanmar-0.3026
Highest and lowest reading in South-eastern Asia.
- Southern Africa
0.6213
the middle country, of 5 measured · 5 members
 South Africa0.8833
 Eswatini-0.0790
Highest and lowest reading in Southern Africa.
- South America
0.5909
the middle country, of 12 measured · 12 members
 Chile1.5030
 Suriname-0.0876
Highest and lowest reading in South America.
- Caribbean
0.5713
the middle country, of 5 measured · 24 members
 Jamaica0.6490Haiti-1.1520
Highest and lowest reading in Caribbean.
- Western Asia
0.4698
the middle country, of 17 measured · 19 members
 Israel1.7550Yemen-1.4420
Highest and lowest reading in Western Asia.
- Central America
0.4130
the middle country, of 7 measured · 8 members
 Costa Rica0.8696
 Nicaragua0.1352
Highest and lowest reading in Central America.
- Northern Africa
0.1999
the middle country, of 6 measured · 6 members
 Morocco0.7204
 Libya-1.3520
Highest and lowest reading in Northern Africa.
- Southern Asia
0.1747
the middle country, of 8 measured · 9 members
 India0.7670
 Afghanistan-1.0460
Highest and lowest reading in Southern Asia.
- Eastern Africa
0.1021
the middle country, of 17 measured · 19 members
Mauritius0.9300Somalia-2.0960Highest and lowest reading in Eastern Africa.
- Central Asia
-0.0292
the middle country, of 5 measured · 5 members
 Kazakhstan0.8113
 Turkmenistan-0.7071
Highest and lowest reading in Central Asia.
- Western Africa
-0.1140
the middle country, of 16 measured · 16 members
 Cabo Verde0.4860
 Guinea-Bissau-0.8603
Highest and lowest reading in Western Africa.
- Middle Africa
-0.4931
the middle country, of 8 measured · 9 members
 Angola-0.1073Central African Republic-1.5410
Highest and lowest reading in Middle Africa.
- Australia and New Zealand
2 of 2 measured — too few for a middle: Australia, New Zealand.
New Zealand2.2350 Australia2.2180
Highest and lowest reading in Australia and New Zealand.
- Melanesia
3 of 5 measured — too few for a middle: Fiji, Papua New Guinea, Solomon Islands.
 Fiji0.4425Solomon Islands-0.7057
Highest and lowest reading in Melanesia.
- Northern America
2 of 4 measured — too few for a middle: Canada, United States.
Canada2.0950 United States1.8600
Highest and lowest reading in Northern America.
03The whole field at once
The spread
166 countries, one dot each, on one scale — further right is a higher value. Half the countries are above 0.4867; a quarter are above 0.9877, and a quarter below -0.0486. The bar in each row marks that continent’s middle country.
04All 166 ever measured
Every country
In order, highest value first. “=” marks a position shared with another country. Jonathan K. Hanson (University of Michigan) and Rachel Sigman (Naval Postgraduate School) ranks nobody on this measure; the position is derived here by ordering the published values. Higher means a more capable state, not a freer or fairer one — a capable state can also be a repressive one. The scale has no fixed ends and is centred near zero, so a negative figure means below the typical country, not a collapse. The newest year in the series is 2015.
Showing 25 of 166 countries


















































































































Values for 2015. The change column compares 2015 with 2014 only; the sparkline covers the recent editions.
051960–2015 · 56 reference years
Over time
Each point is one year from 1960 to 2015, all of them estimated together in one model released in 2020. The series stops in 2015 and has not been updated, so it shows the long arc of a state's capacity rather than where it stands today.
- the middle country
- the middle half of countries
- the middle of the 102 countries measured every time
- each continent’s middle country
The same, year by year
| Year | Countries | Middle country | Middle half | Measured every time |
|---|---|---|---|---|
| 2015 | 166 | 0.4867 | -0.0486 – 0.9877 | 0.5891 |
| 2014 | 166 | 0.5074 | -0.0718 – 1.0833 | 0.5763 |
| 2013 | 166 | 0.4714 | -0.0772 – 1.0242 | 0.5731 |
| 2012 | 166 | 0.5023 | -0.0699 – 1.0134 | 0.5457 |
| 2011 | 166 | 0.4523 | -0.0618 – 1.1011 | 0.5570 |
| 2010 | 165 | 0.4480 | -0.0764 – 1.1560 | 0.5145 |
| 2009 | 165 | 0.4482 | -0.1197 – 1.0320 | 0.5818 |
| 2008 | 165 | 0.4850 | -0.1098 – 1.1560 | 0.5913 |
| 2007 | 164 | 0.4064 | -0.1336 – 1.2075 | 0.5885 |
| 2006 | 164 | 0.3561 | -0.1559 – 1.1683 | 0.5134 |
| 2005 | 162 | 0.3310 | -0.1999 – 1.1260 | 0.4824 |
| 2004 | 162 | 0.2853 | -0.2656 – 1.0700 | 0.4197 |
| 2003 | 162 | 0.2408 | -0.2984 – 0.9925 | 0.2656 |
| 2002 | 162 | 0.2279 | -0.3053 – 0.9909 | 0.2910 |
| 2001 | 161 | 0.2327 | -0.2746 – 1.0330 | 0.3257 |
| 2000 | 161 | 0.2261 | -0.2587 – 1.0150 | 0.3208 |
| 1999 | 161 | 0.2727 | -0.2366 – 0.9992 | 0.3467 |
| 1998 | 161 | 0.2479 | -0.2465 – 1.0840 | 0.3416 |
| 1997 | 161 | 0.2649 | -0.2457 – 1.0240 | 0.3611 |
| 1996 | 161 | 0.2770 | -0.2103 – 1.0150 | 0.3421 |
| 1995 | 161 | 0.2263 | -0.2427 – 0.9861 | 0.3498 |
| 1994 | 161 | 0.1406 | -0.3084 – 0.9070 | 0.2829 |
| 1993 | 161 | 0.0949 | -0.3579 – 0.8604 | 0.2702 |
| 1992 | 158 | 0.1056 | -0.4582 – 0.7203 | 0.2138 |
| 1991 | 156 | 0.0082 | -0.4154 – 0.6268 | 0.0623 |
| 1990 | 139 | -0.0383 | -0.4557 – 0.6459 | 0.0926 |
| 1989 | 136 | -0.0600 | -0.5192 – 0.6893 | 0.0469 |
| 1988 | 136 | -0.0363 | -0.4877 – 0.6548 | 0.0891 |
| 1987 | 136 | -0.0132 | -0.5009 – 0.6589 | 0.0605 |
| 1986 | 136 | -0.0442 | -0.5123 – 0.6673 | 0.0942 |
| 1985 | 136 | -0.0757 | -0.5008 – 0.7109 | 0.0132 |
| 1984 | 136 | -0.0911 | -0.5256 – 0.7148 | -0.0479 |
| 1983 | 136 | -0.0560 | -0.4943 – 0.6883 | -0.0349 |
| 1982 | 136 | -0.0700 | -0.4801 – 0.6695 | -0.0470 |
| 1981 | 136 | -0.0628 | -0.4792 – 0.6442 | -0.0168 |
| 1980 | 136 | -0.0807 | -0.5185 – 0.6415 | -0.0589 |
| 1979 | 136 | -0.0503 | -0.5116 – 0.6218 | 0.0028 |
| 1978 | 136 | -0.1187 | -0.5238 – 0.6065 | -0.0243 |
| 1977 | 135 | -0.1010 | -0.6084 – 0.5709 | -0.0734 |
| 1976 | 134 | -0.1080 | -0.5453 – 0.5540 | -0.0806 |
| 1975 | 133 | -0.1181 | -0.5679 – 0.5180 | -0.0449 |
| 1974 | 127 | -0.1412 | -0.6159 – 0.6053 | -0.0984 |
| 1973 | 126 | -0.1859 | -0.6117 – 0.5826 | -0.1671 |
| 1972 | 126 | -0.1735 | -0.5958 – 0.5602 | -0.1722 |
| 1971 | 125 | -0.1970 | -0.5716 – 0.5359 | -0.1748 |
| 1970 | 122 | -0.2229 | -0.6308 – 0.5220 | -0.1882 |
| 1969 | 120 | -0.2223 | -0.6156 – 0.4752 | -0.1955 |
| 1968 | 120 | -0.2168 | -0.6007 – 0.4114 | -0.2011 |
| 1967 | 117 | -0.2441 | -0.5726 – 0.4995 | -0.1860 |
| 1966 | 117 | -0.2293 | -0.5653 – 0.4039 | -0.1995 |
| 1965 | 114 | -0.2433 | -0.5757 – 0.4953 | -0.1985 |
| 1964 | 113 | -0.2141 | -0.6224 – 0.5294 | -0.1828 |
| 1963 | 111 | -0.2409 | -0.6403 – 0.4692 | -0.1751 |
| 1962 | 109 | -0.2582 | -0.6834 – 0.5083 | -0.1874 |
| 1961 | 105 | -0.2109 | -0.7249 – 0.4968 | -0.2057 |
| 1960 | 102 | -0.2520 | -0.8232 – 0.4974 | -0.2520 |
062014 → 2015
Who rose and fell
The biggest changes in value between the two newest editions — reference years recalculated in one report, not two separate publications. Places are shown second, because they also move when other countries do.
Improved most
before → after Sudan-1.1050 → -0.8835 · 161st → 155th+0.2215
 Côte d’Ivoire-0.2823 → -0.0714 · 138th → 127th+0.2109
 Germany2.1230 → 2.3010 · 12th → 7th+0.1780
 Equatorial Guinea-0.6734 → -0.5207 · 151st → 147th+0.1527
 Benin-0.0186 → 0.1220 · 120th → 113th+0.1406
Declined most
before → after- Yemen-0.8452 → -1.4420 · 154th → 164th−0.5968
- Libya-0.8898 → -1.3520 · 156th → 162nd−0.4622
 United Arab Emirates1.0510 → 0.7112 · 43rd → 63rd−0.3398
 Cyprus1.1880 → 0.9260 · 39th → 45th−0.2620
- Denmark2.9570 → 2.6970 · 1st → 1st−0.2600
166 countries were measured in both 2014 and 2015.
07Across every edition
State capacity in records
The extremes of the statistic. A record reached by more than one country names none of them.
Highest reading on record
2.9640
Latent estimate of state capacity (≈ −2.3 to +3.0, centred near 0); higher = a more capable state
Jonathan K. Hanson (University of Michigan) and Rachel Sigman (Naval Postgraduate School) · 2010
Lowest reading on record
-2.3100
Latent estimate of state capacity (≈ −2.3 to +3.0, centred near 0); higher = a more capable state
Jonathan K. Hanson (University of Michigan) and Rachel Sigman (Naval Postgraduate School) · 2006
Biggest improvement between editions
+1.3117
-0.1997 → 1.1120
Biggest decline between editions
−1.0431
-0.4849 → -1.5280
Most improved since first measured
+2.2490
-1.0470 → 1.2020
At the top most often
50 of 56
editions, alone at the first-listed end
08The measure
About state capacity
The State Capacity Index estimates how able a state is to do the basic work of governing — to raise revenue, to enforce order across its territory and to run a competent, rule-bound administration. Built by political scientists Jonathan Hanson and Rachel Sigman from 21 indicators, it covers most countries from 1960 to 2015, and a higher figure means a more capable state.
What the number is: Latent estimate of state capacity (≈ −2.3 to +3.0, centred near 0); higher = a more capable state.
09Where it fits
Connections
Its part in the Country Index, the statistics whose values line up most closely with it across countries, and others on the same subject.
In the Country Index
Context, with no vote
This statistic is published in full under Governance & Institutions, but does not help decide any Country Index standing.
Moves with
Where state capacity is higher, these tend to be higher too.
- Women's Empowerment IndexUNDP Human Development Report Office and UN Women · 109 countries in commonρ 0.90
- ND-GAIN Country IndexNotre Dame Global Adaptation Initiative (ND-GAIN), University of Notre Dame · 163 countries in commonρ 0.90
- Productive Capacities IndexUNCTAD · 163 countries in commonρ 0.90
Moves against
Where state capacity is higher, these tend to be lower.
- Gender Inequality IndexUNDP Human Development Report Office · 157 countries in commonρ −0.88
- Informal Employment RateILO · 80 countries in commonρ −0.86
- Average Household SizeUN DESA Population Division · 118 countries in commonρ −0.84
Rank correlation (ρ, from −1 to 1) across countries, on each statistic’s newest edition, out of 373 statistics sharing at least 80 countries with this one. Two statistics that move together do not cause each other.
11Questions
State capacity: questions and answers
Which country has the highest state capacity?
Denmark, at 2.6970, among the 166 countries compared in 2015.
Which country has the lowest state capacity?
Somalia, at -2.0960, among the 166 countries compared in 2015.
How many countries does the State Capacity Index cover?
166 in 2015. The number measured varies from 102 to 166 between editions.
What is the world average state capacity?
This site does not calculate a world average, which would depend on how countries are weighted. In the middle country of the 166 compared in 2015, the figure was 0.4867.
Is this Jonathan K. Hanson (University of Michigan) and Rachel Sigman (Naval Postgraduate School)’s own ranking?
No. Jonathan K. Hanson (University of Michigan) and Rachel Sigman (Naval Postgraduate School) publishes the values but ranks nobody; the position on this page is derived by Nations Inquiry by ordering the published values, and equal values share a position.
How often is the State Capacity Index published?
This site holds 56 reference years, 1960–2015, all recalculated in Jonathan K. Hanson (University of Michigan) and Rachel Sigman (Naval Postgraduate School)’s 2020 report on one method — not 56 separate publications.
Where does the data come from, and can I download it?
From Jonathan K. Hanson (University of Michigan) and Rachel Sigman (Naval Postgraduate School), under CC0 1.0. From the authors' own Harvard Dataverse deposit, released in 2020 with their 2021 Journal of Politics article and dedicated to the public domain (CC0). Only the authors' estimate and its standard deviation are republished, to the four significant figures the authors deposited; the input series bundled in the same file belong to other publishers and are left out. Every edition is on this site’s Datasets pages as a full table, and downloads as a CSV file with every value unrounded.
12Method
Sources, method and citation
Source
State Capacity Index — Jonathan K. Hanson (University of Michigan) and Rachel Sigman (Naval Postgraduate School)
From the authors' own Harvard Dataverse deposit, released in 2020 with their 2021 Journal of Politics article and dedicated to the public domain (CC0). Only the authors' estimate and its standard deviation are republished, to the four significant figures the authors deposited; the input series bundled in the same file belong to other publishers and are left out.
Newest edition
Report year 2015Data year 2015
Cite the source as: Hanson, Jonathan K., and Rachel Sigman (2021). "Leviathan's Latent Dimensions: Measuring State Capacity for Comparative Political Research." The Journal of Politics 83(4): 1495–1510. https://doi.org/10.1086/715066. Data: Harvard Dataverse, doi:10.7910/DVN/IFZXQX, version 1.0.
Licence: CC0 1.0, checked 2026-10-03.
How this page reads the numbers
- Jonathan K. Hanson (University of Michigan) and Rachel Sigman (Naval Postgraduate School) ranks nobody on this measure. The position is derived by Nations Inquiry by ordering the published values; equal values share a position.
- Which end is better follows the publisher’s own reading of the measure.
- A country is named at an end only when it holds that value alone. Where several share it, the page says how many and names none first.
- Values are stored exactly as published and trimmed only for display. “The middle country” is the median of the countries measured, not a world average.
The file itself, column by column — where it came from, what each column holds, and every edition as a CSV — is on its dataset page.
Photographs
The countries at the top of this statistic, from their profiles: Wikimedia Commons, shown in greyscale, each used under the licence named.
- Denmark — User:Aconcagua, CC BY-SA 3.0
- Norway — Ximonic , Simo Räsänen, CC BY-SA 3.0
- Austria — chensiyuan, CC BY-SA 4.0
Cite this page
Nations Inquiry (2026). State capacity by country: State Capacity Index, data from Jonathan K. Hanson (University of Michigan) and Rachel Sigman (Naval Postgraduate School). https://nationsinquiry.com/statistics/state-capacity