UNDP Human Development Report Office and UN Women · Women's Empowerment Index
Women's Empowerment Index by country
How far are women able to make choices and take up opportunities in their own lives?
Of the 114 countries compared in 2022, Sweden had the highest reading, 0.828, and Yemen had the lowest reading, 0.141. In the middle country the figure was 0.615.
Share
Part ofGender & Equality
Women's Empowerment Index · 2022
Context statistic
Highest of 114Sweden
0.828012022 · values only
Who leads
The three countries at the highest end of 114 compared, the three at the other end, and the first on each continent.
 1
Photo: User:Pieter Kuiper · Public domain, greyscale
 2
Photo: Hansueli Krapf · CC BY-SA 3.0, greyscale
 3
Photo: tiimta · CC BY-SA 3.0, greyscale
02Every measured country
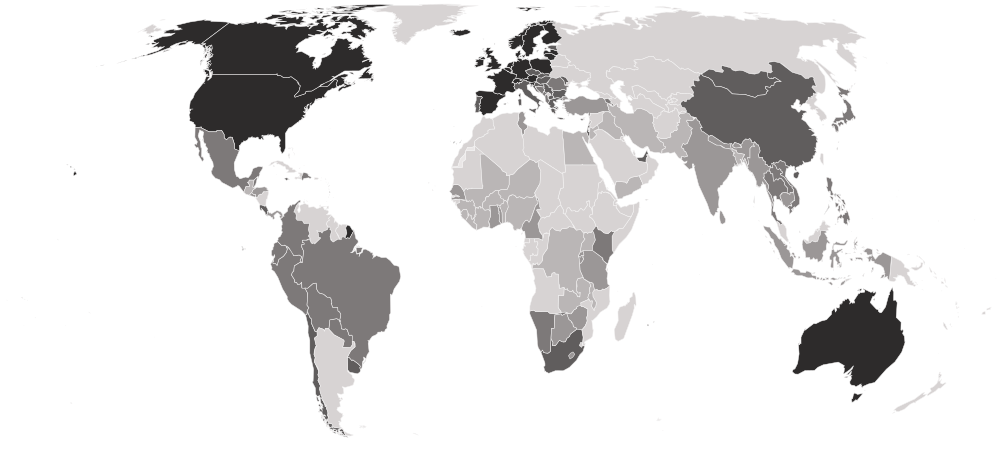
Women's Empowerment Index on a map
Each country is shaded by its value, in five groups holding the same number of countries. Hover a country for its value, or select it to open its profile. Below the map, each continent’s middle country.
Darker is a higher value — the better end.
- 0.141–0.488
- 0.491–0.568
- 0.569–0.656
- 0.664–0.750
- 0.752–0.828
- No reading in 2022
- Europe
0.753
the middle country, of 36 measured · 49 members
Sweden0.828 Bosnia and Herzegovina0.597
Highest and lowest reading in Europe.
- Americas
0.630
the middle country, of 19 measured · 48 members
 Canada0.783
 Guatemala0.482
Highest and lowest reading in Americas.
- Asia
0.565
the middle country, of 28 measured · 52 members
 Singapore0.757
 Yemen0.141
Highest and lowest reading in Asia.
- Africa
0.488
the middle country, of 30 measured · 55 members
 South Africa0.680
 Niger0.307
Highest and lowest reading in Africa.
- Oceania
1 of 21 measured — too few for a middle: Australia.
 Australia0.805
Highest and lowest reading in Oceania.
- Every region
18 sub-regions, highest middle country first
- Northern Europe
0.785
the middle country, of 10 measured · 13 members
Sweden0.828 Estonia0.750
Highest and lowest reading in Northern Europe.
- Western Europe
0.778
the middle country, of 7 measured · 9 members
 Belgium0.801
 Luxembourg0.737
Highest and lowest reading in Western Europe.
- Eastern Europe
0.701
the middle country, of 7 measured · 10 members
 Poland0.757
 Romania0.623
Highest and lowest reading in Eastern Europe.
- Southern Europe
0.698
the middle country, of 12 measured · 17 members
 Slovenia0.791Bosnia and Herzegovina0.597
Highest and lowest reading in Southern Europe.
- South America
0.635
the middle country, of 8 measured · 12 members
 Chile0.699
 Colombia0.592
Highest and lowest reading in South America.
- South-eastern Asia
0.597
the middle country, of 8 measured · 11 members
Singapore0.757 Myanmar0.518
Highest and lowest reading in South-eastern Asia.
- Central America
0.563
the middle country, of 7 measured · 8 members
 Costa Rica0.677Guatemala0.482
Highest and lowest reading in Central America.
- Eastern Africa
0.519
the middle country, of 9 measured · 19 members
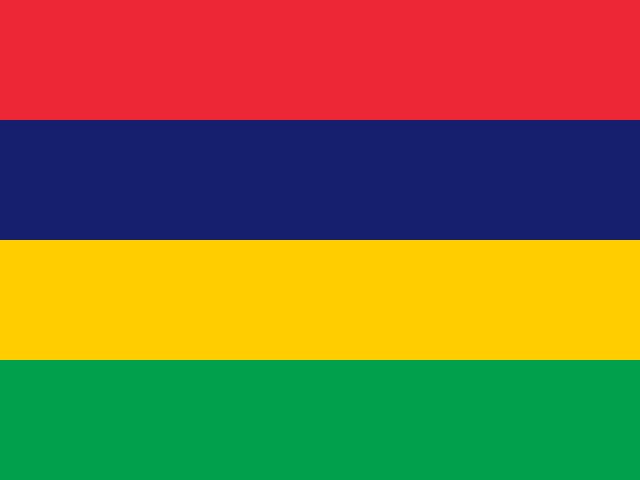 Mauritius0.613
 Zambia0.441
Highest and lowest reading in Eastern Africa.
- Southern Asia
0.505
the middle country, of 8 measured · 9 members
 Sri Lanka0.568
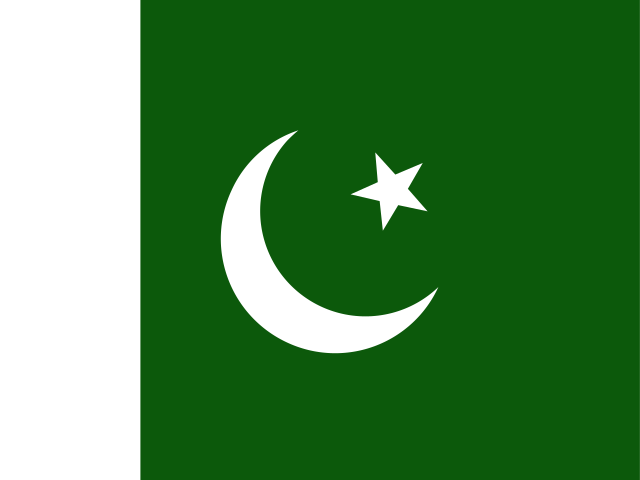 Pakistan0.337
Highest and lowest reading in Southern Asia.
- Western Asia
0.498
the middle country, of 9 measured · 19 members
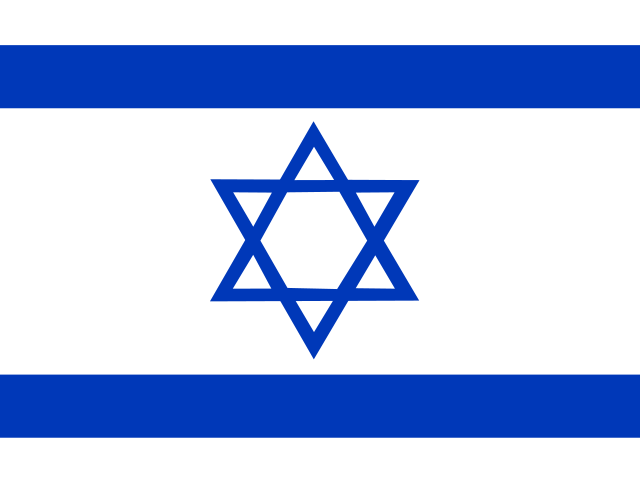 Israel0.694Yemen0.141
Highest and lowest reading in Western Asia.
- Western Africa
0.438
the middle country, of 13 measured · 16 members
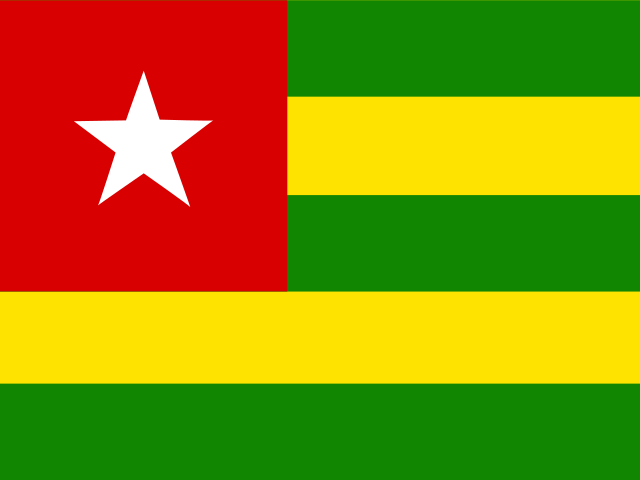 Togo0.537Niger0.307
Highest and lowest reading in Western Africa.
- Australia and New Zealand
1 of 2 measured — too few for a middle: Australia.
Australia0.805Highest and lowest reading in Australia and New Zealand.
- Caribbean
2 of 24 measured — too few for a middle: Dominican Republic, Jamaica.
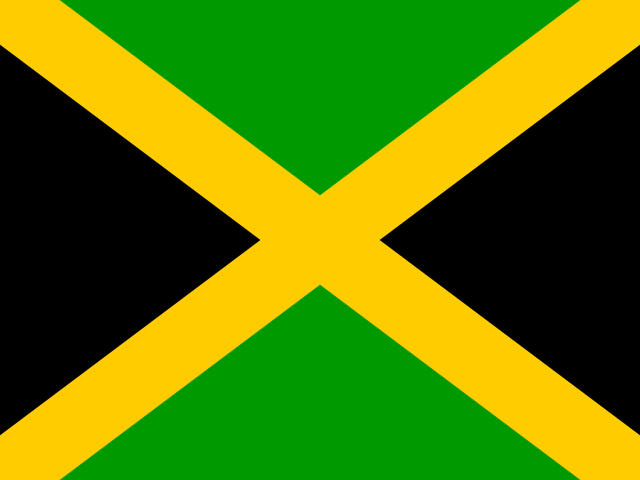 Jamaica0.694
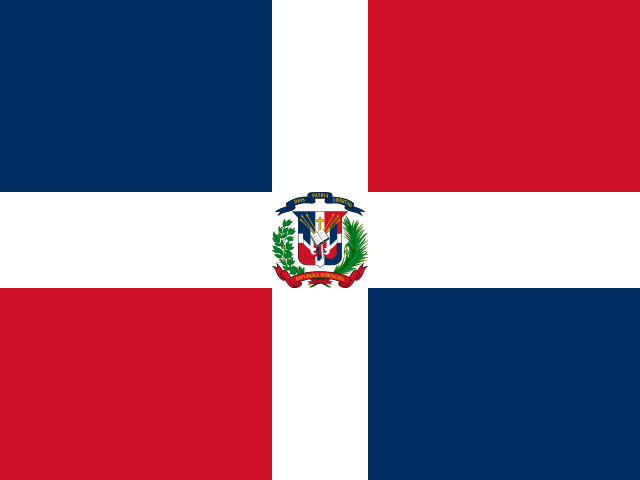 Dominican Republic0.603
Highest and lowest reading in Caribbean.
- Eastern Asia
3 of 8 measured — too few for a middle: China, Japan, Mongolia.
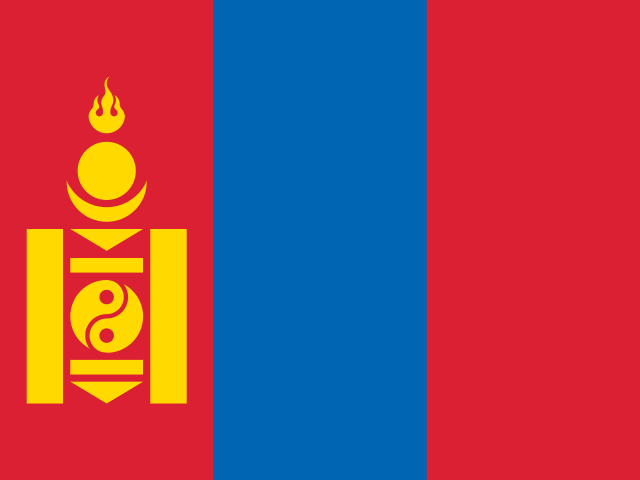 Mongolia0.670
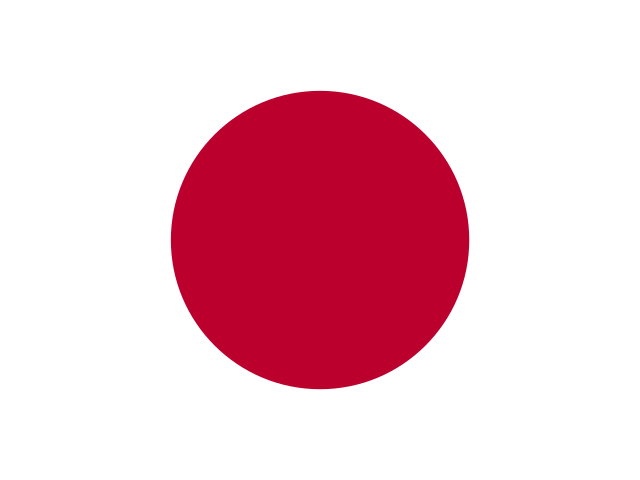 Japan0.651
Highest and lowest reading in Eastern Asia.
- Middle Africa
2 of 9 measured — too few for a middle: Cameroon, DR Congo.
 Cameroon0.520
 DR Congo0.399
Highest and lowest reading in Middle Africa.
- Northern Africa
2 of 6 measured — too few for a middle: Egypt, Tunisia.
 Tunisia0.512
 Egypt0.466
Highest and lowest reading in Northern Africa.
- Northern America
2 of 4 measured — too few for a middle: Canada, United States.
Canada0.783 United States0.752
Highest and lowest reading in Northern America.
- Southern Africa
4 of 5 measured — too few for a middle: Botswana, Lesotho, Namibia, South Africa.
South Africa0.680 Lesotho0.531
Highest and lowest reading in Southern Africa.
03The whole field at once
The spread
114 countries, one dot each, on one scale — further right is a higher value. Half the countries are above 0.615; a quarter are above 0.706, and a quarter below 0.518. The bar in each row marks that continent’s middle country.
04All 114 ever measured
Every country
In order, highest value first. No rank or position is shown: too many countries share the same value for an order to mean anything. This index looks at women's achievements on their own terms, not at how they compare with men's — so a country where men and women are equally constrained scores low here and can still score well on its twin, the Global Gender Parity Index. Many countries could not be scored for lack of data and are absent, not zero. The publishers rank no country, and neither does this page; they sort countries into four groups instead, shown beside each score.
Showing 25 of 114 countries








Values for 2022.
05In this edition
Women's Empowerment Index in records
The extremes of the statistic. A record reached by more than one country names none of them.
Highest reading
0.828
Women's Empowerment Index (0–1; higher = more empowerment)
Lowest reading
0.141
Women's Empowerment Index (0–1; higher = more empowerment)
06The measure
About Women's Empowerment Index
The Women's Empowerment Index measures how far women are able to make choices and take up opportunities in their own lives, across health, education, work and money, decision-making, and freedom from violence. It runs from 0 to 1 and was published in 2023 by UNDP and UN Women as an experimental index, alongside a twin that measures the gap between women and men.
What the number is: Women's Empowerment Index (0–1; higher = more empowerment).
Ten indicators behind the five dimensions
The index rests on ten indicators: the share of women whose need for family planning is met by modern methods and the adolescent birth rate; women with at least completed secondary schooling and young women not in education, employment or training; the labour force participation of mothers of young children living with a partner, and women's account ownership; women's shares of parliamentary seats, local government seats and managerial posts; and intimate partner violence in the past year. Each is scaled between fixed limits and averaged within its dimension, and the result is the geometric mean of the five dimension indices.
Ceilings, weak links and mixed years
Some of the limits shape the result. Parliamentary seats, local government seats and managerial posts reach the top of their scale at three quarters held by women, not at half. Because the dimensions are multiplied rather than added, one very weak dimension pulls the whole figure down, and strength elsewhere cannot fully make up for it. The publishers used the latest data available in early 2023, so the indicators behind one country's value describe different years, and gaps in the main sources were filled from others, noted country by country in their tables.
Measured through particular groups of women
Several indicators look at one group rather than at all women: women of reproductive age for family planning, partnered women and girls for violence, women aged twenty-five to fifty-four living with a partner and a child under six for paid work. The index describes conditions that shape choices, as far as countable outcomes reveal them, rather than asking women how free they feel to decide. It also leaves out things often discussed under empowerment, such as unpaid care work and ownership of land, which are not among its indicators.
07Where it fits
Connections
Its part in the Country Index, the statistics whose values line up most closely with it across countries, and others on the same subject or from the same publisher.
In the Country Index
Context, with no vote
This statistic is published in full under Gender & Equality, but does not help decide any Country Index standing.
Moves with
Where Women's Empowerment Index is higher, these tend to be higher too.
- State Capacity IndexJonathan K. Hanson (University of Michigan) and Rachel Sigman (Naval Postgraduate School) · 109 countries in commonρ 0.90
- ND-GAIN Country IndexNotre Dame Global Adaptation Initiative (ND-GAIN), University of Notre Dame · 114 countries in commonρ 0.90
- Inequality-adjusted Human Development IndexUNDP Human Development Report Office · 112 countries in commonρ 0.90
Moves against
Where Women's Empowerment Index is higher, these tend to be lower.
- Gender Inequality IndexUNDP Human Development Report Office · 114 countries in commonρ −0.91
- Average Household SizeUN DESA Population Division · 89 countries in commonρ −0.90
- Coefficient of Human InequalityUNDP Human Development Report Office · 112 countries in commonρ −0.87
Rank correlation (ρ, from −1 to 1) across countries, on each statistic’s newest edition, out of 316 statistics sharing at least 80 countries with this one. Two statistics that move together do not cause each other.
On the same subject
More from UNDP Human Development Report Office and UN Women
08Credits
Sources and citation
Source
- Publisher
- Women's Empowerment Index — UNDP Human Development Report Office and UN WomenFrom the statistical annex of The Paths to Equal (UNDP and UN Women, 2023), read from UNDP's Human Development Report Office copy and stored at the three decimals published. Only the index values are used, not the indicators from other agencies that go into them.
- Newest edition
- 2023, describing 2022
- Licence
- CC BY 3.0 IGO, checked October 3, 2026
- Editions
- 2023
- Cite the source
- UNDP and UN Women. 2023. The Paths to Equal: Twin Indices on Women's Empowerment and Gender Equality. New York: United Nations Development Programme and UN Women.
Reading this page
- No rank or position is shown: UNDP Human Development Report Office and UN Women publishes values only, and this site has not ordered them. Ranks, positions and standings
- The file, column by column, with every edition as a CSV
Cite this page
Nations Inquiry (2026). Women's Empowerment Index by country: Women's Empowerment Index, data from UNDP Human Development Report Office and UN Women. https://nationsinquiry.com/statistics/womens-empowerment-index
Photographs: Wikimedia Commons, in greyscale, the photographer and licence named beside each.