World Bank Group · Government Effectiveness
Government effectiveness by country
How good are a country's public services and policy-making?
Singapore placed first of the 209 countries compared in 2025, at 2.0921, and South Sudan last, at -2.2510. In the middle country the figure was 0.1006. Among the 182 countries measured in every edition since 1996, the middle one moved from -0.3137 to 0.0379.
Share
Part ofGovernance & Institutions
Government effectiveness · 2025
Key statistic · Governance & Institutions


Highest of 209Singapore
2.0921012025 · position · derived
Who leads
The three countries at the highest end of 209 compared, the three at the other end, and the first on each continent.
 1
Photo: Khairul Nizam . · CC BY 2.0, greyscale
 2
Photo: JurriaanH · CC BY-SA 3.0, greyscale
 3
Photo: Michal Osmenda from Brussels, Belgium · CC BY-SA 2.0, greyscale
Lowest in 2025
- 209
 South Sudan-2.2510
- 208
 Haiti-2.0409
- 207
 Afghanistan-1.9694
Positions out of 209. Where a country sits says how it compares with the others measured, and nothing about why.
Highest on each continent
- Africa
 Mauritius0.8599
- Americas
 Canada1.7571
- AsiaSingapore2.0921
- Europe
 Luxembourg1.9772
- Oceania
 New Zealand1.8728
- Every region
02Every measured country
Government effectiveness on a map
Each country is shaded by its value, in five groups holding the same number of countries. Hover a country for its value, or select it to open its profile. Below the map, each continent’s middle country.
Darker is a higher value — the better end.
- -2.2510–-0.7911
- -0.7759–-0.1932
- -0.1849–0.2550
- 0.2561–0.9959
- 1.0219–2.0921
- No reading in 2025
- Europe
1.0629
the middle country, of 44 measured · 49 members
Luxembourg1.9772 Belarus-0.7986
Highest and lowest reading in Europe.
- Americas
0.1744
the middle country, of 42 measured · 48 members
Canada1.7571Haiti-2.0409Highest and lowest reading in Americas.
- Asia
0.1113
the middle country, of 51 measured · 52 members
Singapore2.0921Afghanistan-1.9694Highest and lowest reading in Asia.
- Oceania
0.0102
the middle country, of 18 measured · 21 members
New Zealand1.8728 Solomon Islands-0.8450
Highest and lowest reading in Oceania.
- Africa
-0.7614
the middle country, of 54 measured · 55 members
Mauritius0.8599South Sudan-2.2510Highest and lowest reading in Africa.
- Every region
22 sub-regions, highest middle country first
- Western Europe
1.6355
the middle country, of 9 measured · 9 members
Luxembourg1.9772 France1.2114
Highest and lowest reading in Western Europe.
- Northern Europe
1.5880
the middle country, of 10 measured · 13 members
 Denmark1.9589
 Latvia0.8291
Highest and lowest reading in Northern Europe.
- Eastern Asia
1.3327
the middle country, of 8 measured · 8 members
 Japan2.0412
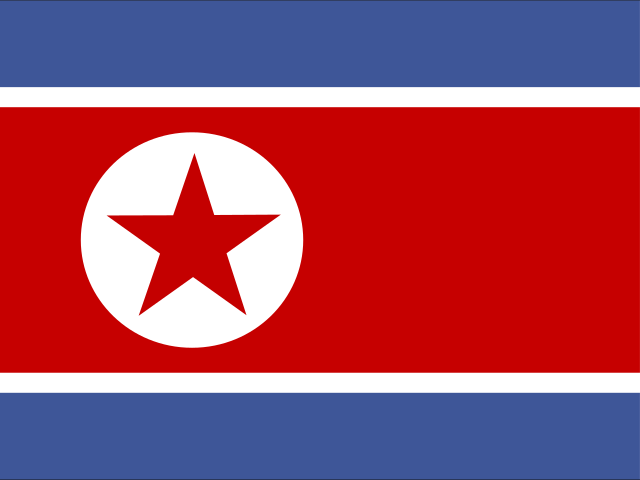 North Korea-1.3241
Highest and lowest reading in Eastern Asia.
- Southern Europe
0.7630
the middle country, of 15 measured · 17 members
 Andorra1.3794
 Bosnia and Herzegovina-0.4761
Highest and lowest reading in Southern Europe.
- Eastern Europe
0.2926
the middle country, of 10 measured · 10 members
 Czechia1.2414Belarus-0.7986
Highest and lowest reading in Eastern Europe.
- Caribbean
0.2771
the middle country, of 18 measured · 24 members
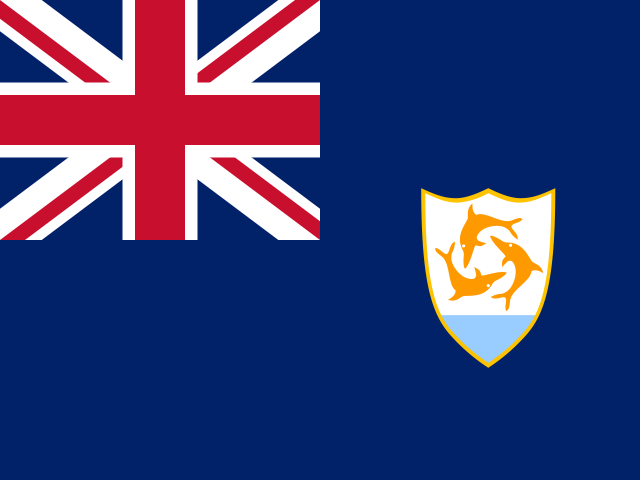 Anguilla1.1026Haiti-2.0409
Highest and lowest reading in Caribbean.
- South-eastern Asia
0.1947
the middle country, of 11 measured · 11 members
Singapore2.0921 Myanmar-1.6176
Highest and lowest reading in South-eastern Asia.
- Western Asia
0.1907
the middle country, of 18 measured · 19 members
 Israel1.1918
 Yemen-1.8719
Highest and lowest reading in Western Asia.
- Polynesia
0.0635
the middle country, of 6 measured · 7 members
 American Samoa0.8692
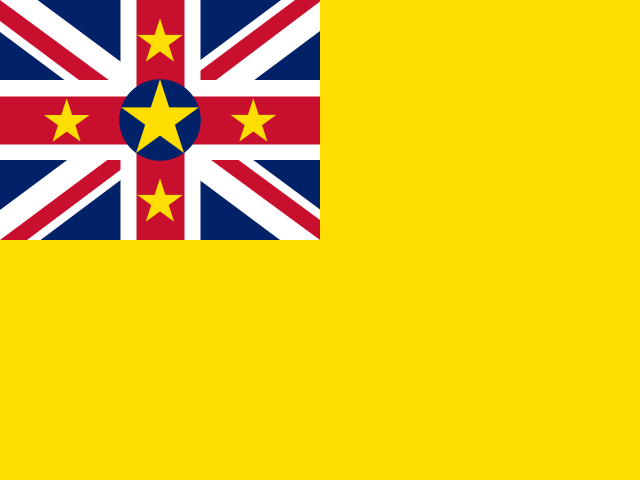 Niue-0.7072
Highest and lowest reading in Polynesia.
- Micronesia
0.0031
the middle country, of 6 measured · 7 members
 Guam1.2135
 Kiribati-0.3649
Highest and lowest reading in Micronesia.
- Southern Africa
-0.0230
the middle country, of 5 measured · 5 members
 Botswana0.4343
 Eswatini-0.8396
Highest and lowest reading in Southern Africa.
- South America
-0.0334
the middle country, of 12 measured · 12 members
 Chile1.0425
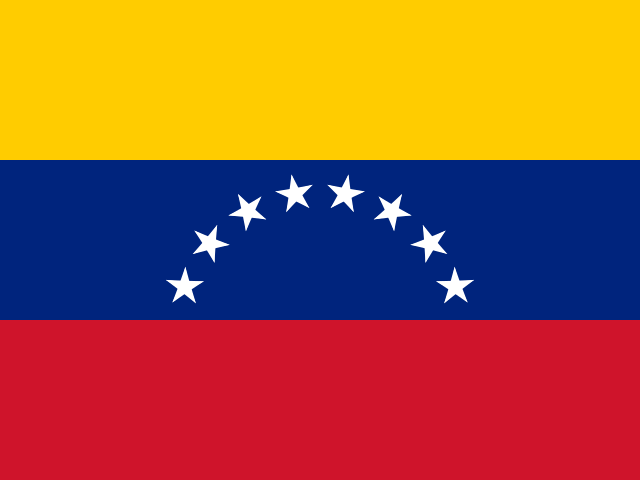 Venezuela-1.3932
Highest and lowest reading in South America.
- Central America
-0.2102
the middle country, of 8 measured · 8 members
 Costa Rica0.4111
 Nicaragua-0.8939
Highest and lowest reading in Central America.
- Northern Africa
-0.2389
the middle country, of 6 measured · 6 members
 Morocco0.1765
 Sudan-1.9536
Highest and lowest reading in Northern Africa.
- Southern Asia
-0.4447
the middle country, of 9 measured · 9 members
 Bhutan0.7057Afghanistan-1.9694
Highest and lowest reading in Southern Asia.
- Eastern Africa
-0.6094
the middle country, of 18 measured · 19 members
Mauritius0.8599South Sudan-2.2510Highest and lowest reading in Eastern Africa.
- Central Asia
-0.6865
the middle country, of 5 measured · 5 members
 Kazakhstan0.1029
 Turkmenistan-1.1548
Highest and lowest reading in Central Asia.
- Western Africa
-0.8138
the middle country, of 16 measured · 16 members
 Cabo Verde0.5124
 Guinea-Bissau-1.4703
Highest and lowest reading in Western Africa.
- Middle Africa
-1.0549
the middle country, of 9 measured · 9 members
 Gabon-0.5514
 DR Congo-1.6747
Highest and lowest reading in Middle Africa.
- Australia and New Zealand
2 of 2 measured — too few for a middle: Australia, New Zealand.
New Zealand1.8728 Australia1.7512
Highest and lowest reading in Australia and New Zealand.
- Melanesia
4 of 5 measured — too few for a middle: Fiji, Papua New Guinea, Solomon Islands, Vanuatu.
 Fiji0.5287Solomon Islands-0.8450
Highest and lowest reading in Melanesia.
- Northern America
4 of 4 measured — too few for a middle: Bermuda, Canada, Greenland, United States.
Canada1.7571 United States1.1910
Highest and lowest reading in Northern America.
03The whole field at once
The spread
209 countries, one dot each, on one scale — further right is a higher value. Half the countries are above 0.1006; a quarter are above 0.7963, and a quarter below -0.6166. The bar in each row marks that continent’s middle country.
04All 209 ever measured
Every country
In order, highest value first. “=” marks a position shared with another country. World Bank Group ranks nobody on this measure; the position is derived here by ordering the published values. The Bank’s 0–100 governance score is the estimate rescaled onto a fixed scale anchored by benchmark countries, where 100 is the best absolute performance — it is not a percentile and not a league position, so 90 means neither “above 90% of countries” nor “90th”. The other five WGI dimensions sit beside the headline as columns.
Showing 25 of 209 countries















































































































































Values for 2025. The change column compares 2025 with 2024 only; the sparkline covers the recent editions.
051996–2025 · 27 editions
Over time
Each point is one annual estimate. The scale is a z-score, so the world average is pinned at 0 every year — a country can improve in absolute terms and still slide down this line.
- the middle country
- the middle half of countries
- the middle of the 182 countries measured every time
- each continent’s middle country
The same, year by year
| Year | Countries | Middle country | Middle half | Measured every time |
|---|---|---|---|---|
| 2025 | 209 | 0.1006 | -0.6166 – 0.7963 | 0.0379 |
| 2024 | 209 | 0.0098 | -0.6765 – 0.7177 | -0.0127 |
| 2023 | 209 | -0.0408 | -0.6815 – 0.6927 | -0.0488 |
| 2022 | 209 | -0.0305 | -0.6786 – 0.7475 | -0.0378 |
| 2021 | 207 | -0.0158 | -0.6702 – 0.7313 | -0.0211 |
| 2020 | 207 | -0.0171 | -0.6519 – 0.7090 | -0.0259 |
| 2019 | 207 | 0.0150 | -0.5734 – 0.7570 | 0.0049 |
| 2018 | 207 | 0.0159 | -0.5217 – 0.7542 | -0.0131 |
| 2017 | 207 | 0.0158 | -0.5042 – 0.7180 | -0.0213 |
| 2016 | 207 | 0.0225 | -0.5133 – 0.7630 | 0.0207 |
| 2015 | 209 | 0.0038 | -0.5451 – 0.7520 | 0.0182 |
| 2014 | 207 | 0.0194 | -0.5699 – 0.7127 | 0.0331 |
| 2013 | 207 | -0.0758 | -0.6907 – 0.6873 | -0.0700 |
| 2012 | 207 | -0.0839 | -0.6603 – 0.6742 | -0.0803 |
| 2011 | 207 | -0.1221 | -0.6840 – 0.6708 | -0.0962 |
| 2010 | 206 | -0.1145 | -0.6416 – 0.6819 | -0.0813 |
| 2009 | 206 | -0.1609 | -0.6728 – 0.6716 | -0.1458 |
| 2008 | 204 | -0.2134 | -0.6666 – 0.6457 | -0.2134 |
| 2007 | 203 | -0.3260 | -0.8308 – 0.5647 | -0.3277 |
| 2006 | 202 | -0.3310 | -0.8672 – 0.5778 | -0.3608 |
| 2005 | 200 | -0.3706 | -0.9321 – 0.6035 | -0.4225 |
| 2004 | 198 | -0.3140 | -0.8627 – 0.4985 | -0.3861 |
| 2003 | 184 | -0.4369 | -1.1072 – 0.7134 | -0.4369 |
| 2002 | 184 | -0.3366 | -1.0858 – 0.7173 | -0.3511 |
| 2000 | 182 | -0.3969 | -1.1147 – 0.5471 | -0.3969 |
| 1998 | 182 | -0.3827 | -1.0356 – 0.5020 | -0.3827 |
| 1996 | 182 | -0.3137 | -1.0221 – 0.7180 | -0.3137 |
062024 → 2025
Who rose and fell
The biggest changes in value between the two newest editions. Places are shown second, because they also move when other countries do.
Improved most
before → after Suriname-0.3630 → -0.0116 · 137th → 111th+0.3514
 Aruba0.5859 → 0.9048 · 61st → 45th+0.3189
 Vietnam-0.1254 → 0.1762 · 113th → 96th+0.3017
- Andorra1.1169 → 1.3794 · 34th → 24th+0.2624
 Micronesia-0.2707 → -0.0732 · 130th → 116th+0.1975
Declined most
before → after Samoa0.3860 → 0.2026 · 75th → 90th−0.1834
 Russia-0.3647 → -0.5007 · 138th → 146th−0.1360
 Iran-0.7273 → -0.8570 · 160th → 176th−0.1296
 Burundi-1.1403 → -1.2530 · 187th → 192nd−0.1127
- United States1.3021 → 1.1910 · 25th → 33rd−0.1111
209 countries were measured in both 2024 and 2025.
07Across every edition
Government effectiveness in records
The extremes of the statistic. A record reached by more than one country names none of them.
Highest reading on record
2.3102
Governance estimate (−2.5 weak to 2.5 strong)
Lowest reading on record
-2.4859
Governance estimate (−2.5 weak to 2.5 strong)
Biggest improvement between editions
+1.2162
0.5305 → 1.7467
Biggest decline between editions
−0.9511
0.5991 → -0.3520
Most improved since first measured
+1.7135
-1.3520 → 0.3615
At the top most often
12 of 27
editions, alone at the first-listed end
08The measure
About government effectiveness
Government Effectiveness is the World Bank’s estimate of how good a country’s public services, civil service and policy-making really are, scored from −2.5 to 2.5. One of the six Worldwide Governance Indicators, it reaches back to 1996 across about 200 countries.
What the number is: Governance estimate (−2.5 weak to 2.5 strong).
What it does not measure
It is an estimate built from surveys and expert ratings, with a margin of error, and it rates delivery rather than how a government came to power or how fairly it treats its citizens.
09Where it fits
Connections
Its part in the Country Index, the statistics whose values line up most closely with it across countries, and others on the same subject.
In the Country Index
A key statistic for Governance & Institutions
“The quality of public services and the civil service that delivers them, and the credibility of a government's commitment to its own policies. Where the Corruption Perceptions Index asks whether a state is honest, this asks whether it is competent.”
- Edition used
- 2025 (data 2025)
- Countries
- 209
- Licence
- CC BY 4.0
Moves with
Where government effectiveness is higher, these tend to be higher too.
- Regulatory QualityWorld Bank Group · 209 countries in commonρ 0.94
- Control of CorruptionWorld Bank Group · 209 countries in commonρ 0.91
- Corruption Perceptions IndexKeyTransparency International · 182 countries in commonρ 0.91
Moves against
Where government effectiveness is higher, these tend to be lower.
- Gender Inequality IndexUNDP Human Development Report Office · 172 countries in commonρ −0.84
- Political Corruption IndexV-Dem Institute, University of Gothenburg · 175 countries in commonρ −0.83
- Learning PovertyWorld Bank Group and UNESCO Institute for Statistics · 108 countries in commonρ −0.82
Rank correlation (ρ, from −1 to 1) across countries, on each statistic’s newest edition, out of 385 statistics sharing at least 80 countries with this one. Two statistics that move together do not cause each other.
10Analysis
Charts and analysis on government effectiveness
11Keep reading
Explore further
The subject
The countries at either end
More from World Bank Group
12Questions
Government effectiveness: questions and answers
Which country has the highest government effectiveness?
Singapore, at 2.0921, among the 209 countries compared in 2025.
Which country has the lowest government effectiveness?
South Sudan, at -2.2510, among the 209 countries compared in 2025.
How many countries does the Government Effectiveness cover?
209 in 2025. The number measured varies from 182 to 209 between editions.
What is the world average government effectiveness?
This site does not calculate a world average, which would depend on how countries are weighted. In the middle country of the 209 compared in 2025, the figure was 0.1006.
Is this World Bank Group’s own ranking?
No. World Bank Group publishes the values but ranks nobody; the position on this page is derived by Nations Inquiry by ordering the published values, and equal values share a position.
How often is the Government Effectiveness published?
This site holds 27 editions, describing 1996 to 2025.
Where does the data come from, and can I download it?
From World Bank Group, under CC BY 4.0. From the World Bank’s Worldwide Governance Indicators. The Bank publishes no overall WGI score, so this page leads with one dimension rather than implying a total that does not exist. Fourteen dependent territories the Bank also scores are not imported; the site is country-scoped. Every edition is on this site’s Datasets pages as a full table, and downloads as a CSV file with every value unrounded.
13Method
Sources, method and citation
Source
Government Effectiveness — World Bank Group
From the World Bank’s Worldwide Governance Indicators. The Bank publishes no overall WGI score, so this page leads with one dimension rather than implying a total that does not exist. Fourteen dependent territories the Bank also scores are not imported; the site is country-scoped.
Newest edition
Report year 2025Data year 2025
Cite the source as: Kaufmann, D. and Kraay, A. Worldwide Governance Indicators. Washington, DC: World Bank Group.
Licence: CC BY 4.0, checked 2026-08-29.
How this page reads the numbers
- World Bank Group ranks nobody on this measure. The position is derived by Nations Inquiry by ordering the published values; equal values share a position.
- Which end is better follows the publisher’s own reading of the measure.
- A country is named at an end only when it holds that value alone. Where several share it, the page says how many and names none first.
- Values are stored exactly as published and trimmed only for display. “The middle country” is the median of the countries measured, not a world average.
The file itself, column by column — where it came from, what each column holds, and every edition as a CSV — is on its dataset page.
Photographs
The countries at the top of this statistic, from their profiles: Wikimedia Commons, shown in greyscale, each used under the licence named.
- Singapore — Khairul Nizam ., CC BY 2.0
- Japan — JurriaanH, CC BY-SA 3.0
- Luxembourg — Michal Osmenda from Brussels, Belgium, CC BY-SA 2.0
Cite this page
Nations Inquiry (2026). Government effectiveness by country: Government Effectiveness, data from World Bank Group. https://nationsinquiry.com/statistics/government-effectiveness