Loading…
World Bank Group · GovTech Maturity Index
GovTech maturity by country
How far has a government got with digital public services?
South Korea placed first of the 196 countries compared in 2025, at 0.99745, and North Korea last, at 0.01049. In the middle country the figure was 0.63045.
GovTech maturity · 2025
Key statistic · Digital & Technology

Highest of 196South Korea
0.99745012025 · position · derived
Who leads
The three countries at the highest end of 196 compared, the three at the other end, and the first on each continent.
 1
1Photo: Unknown author · CC BY-SA 2.0, greyscale
 2
2Photo: Mardetanha · CC BY-SA 3.0, greyscale
 3
3Photo: Andrus Uuetalu derivative work: Jjtkk · CC BY-SA 3.0 ee, greyscale
Lowest in 2025
- 196
 North Korea0.01049
 - 195
 Eritrea0.02694
 - 194
 Syria0.05275
Positions out of 196. Where a country sits says how it compares with the others measured, and nothing about why.
02Every measured country
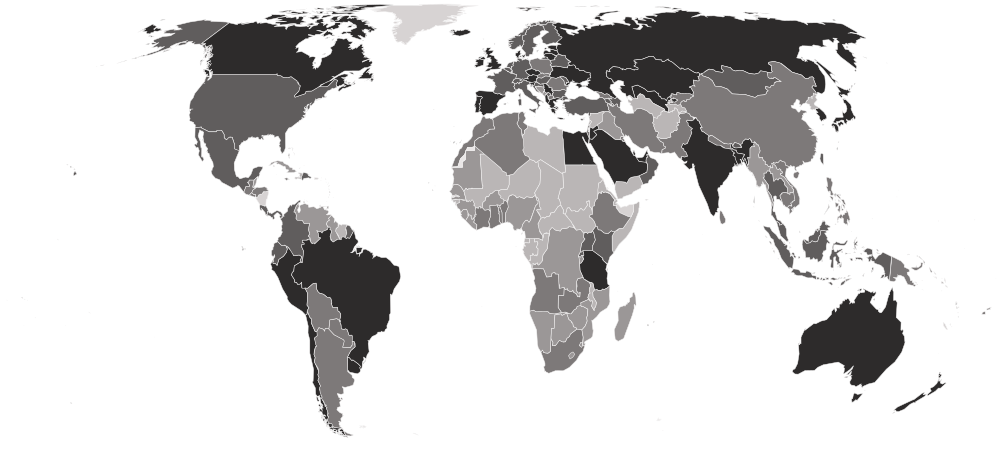
GovTech maturity on a map
Each country is shaded by its value, in five groups holding the same number of countries. Hover a country for its value, or select it to open its profile. Below the map, each continent’s middle country.
Darker is a higher value — the better end.
- 0.01049–0.32818
- 0.33885–0.51316
- 0.51614–0.75950
- 0.76150–0.85385
- 0.85795–0.99745
- No reading in 2025 (1 measured in an earlier edition)
- Europe
0.83965
the middle country, of 44 measured · 49 members
 Estonia0.99010
 San Marino0.22450
Highest and lowest reading in Europe.
- Asia
0.70052
the middle country, of 50 measured · 52 members
South Korea0.99745North Korea0.01049Highest and lowest reading in Asia.
- Americas
0.57254
the middle country, of 34 measured · 48 members
 Brazil0.98598
 Haiti0.13751
Highest and lowest reading in Americas.
- Africa
0.40295
the middle country, of 54 measured · 55 members
 Mauritius0.94359Eritrea0.02694
Highest and lowest reading in Africa.
- Oceania
0.30179
the middle country, of 14 measured · 21 members
 Australia0.98495
 Micronesia0.08635
Highest and lowest reading in Oceania.
- Every region
22 sub-regions, highest middle country first
- Northern Europe
0.89305
the middle country, of 10 measured · 13 members
Estonia0.99010 Norway0.77861
Highest and lowest reading in Northern Europe.
- Southern Europe
0.84921
the middle country, of 15 measured · 17 members
 Serbia0.97667San Marino0.22450
Highest and lowest reading in Southern Europe.
- Eastern Europe
0.82515
the middle country, of 10 measured · 10 members
 Russia0.95962
 Romania0.60240
Highest and lowest reading in Eastern Europe.
- Western Europe
0.79551
the middle country, of 9 measured · 9 members
 Austria0.92904
 Monaco0.36564
Highest and lowest reading in Western Europe.
- South America
0.78481
the middle country, of 12 measured · 12 members
Brazil0.98598 Suriname0.32509
Highest and lowest reading in South America.
- Western Asia
0.76901
the middle country, of 17 measured · 19 members
 Saudi Arabia0.99642Syria0.05275
Highest and lowest reading in Western Asia.
- South-eastern Asia
0.71542
the middle country, of 11 measured · 11 members
 Singapore0.92654
 Laos0.40371
Highest and lowest reading in South-eastern Asia.
- Eastern Asia
0.71402
the middle country, of 8 measured · 8 members
South Korea0.99745North Korea0.01049Highest and lowest reading in Eastern Asia.
- Central America
0.70434
the middle country, of 7 measured · 8 members
 Mexico0.82486
 Belize0.33885
Highest and lowest reading in Central America.
- Southern Asia
0.67885
the middle country, of 9 measured · 9 members
 India0.96925
 Afghanistan0.12101
Highest and lowest reading in Southern Asia.
- Central Asia
0.62637
the middle country, of 5 measured · 5 members
 Uzbekistan0.95768
 Turkmenistan0.14622
Highest and lowest reading in Central Asia.
- Northern Africa
0.53551
the middle country, of 6 measured · 6 members
 Egypt0.91089
 Sudan0.14272
Highest and lowest reading in Northern Africa.
- Southern Africa
0.45920
the middle country, of 5 measured · 5 members
 South Africa0.62256
 Lesotho0.34260
Highest and lowest reading in Southern Africa.
- Western Africa
0.43358
the middle country, of 16 measured · 16 members
 Cabo Verde0.77413
 Niger0.14685
Highest and lowest reading in Western Africa.
- Eastern Africa
0.40295
the middle country, of 18 measured · 19 members
Mauritius0.94359Eritrea0.02694Highest and lowest reading in Eastern Africa.
- Caribbean
0.33894
the middle country, of 13 measured · 24 members
 Dominican Republic0.82336Haiti0.13751
Highest and lowest reading in Caribbean.
- Middle Africa
0.18741
the middle country, of 9 measured · 9 members
 Angola0.59294
 Chad0.10637
Highest and lowest reading in Middle Africa.
- Micronesia
0.13849
the middle country, of 5 measured · 7 members
 Kiribati0.25412Micronesia0.08635
Highest and lowest reading in Micronesia.
- Australia and New Zealand
2 of 2 measured — too few for a middle: Australia, New Zealand.
Australia0.98495 New Zealand0.87802
Highest and lowest reading in Australia and New Zealand.
- Melanesia
4 of 5 measured — too few for a middle: Fiji, Papua New Guinea, Solomon Islands, Vanuatu.
 Fiji0.56294
 Solomon Islands0.26060
Highest and lowest reading in Melanesia.
- Northern America
2 of 4 measured — too few for a middle: Canada, United States.
 Canada0.94898
 United States0.77075
Highest and lowest reading in Northern America.
- Polynesia
3 of 7 measured — too few for a middle: Samoa, Tonga, Tuvalu.
 Samoa0.35204
 Tuvalu0.12358
Highest and lowest reading in Polynesia.
03The whole field at once
The spread
196 countries, one dot each, on one scale — further right is a higher value. Half the countries are above 0.63045; a quarter are above 0.83068, and a quarter below 0.35971. The bar in each row marks that continent’s middle country.
04All 197 ever measured
Every country
In order, highest value first. “=” marks a position shared with another country. World Bank Group ranks nobody on this measure; the position is derived here by ordering the published values. The four focus areas beside the overall score are the Bank's own components. A country can score well on core systems while lagging badly on citizen engagement, and the split says which.
Showing 25 of 197 countries

















































































































































Values for 2025. The change column compares 2025 with 2022 only; the sparkline covers the recent editions.
052022 → 2025
Who rose and fell
The biggest changes in value between the two newest editions. Places are shown second, because they also move when other countries do.
Improved most
before → after Belarus0.40666 → 0.79671 · 126th → 62nd+0.39005
 Ireland0.52336 → 0.89745 · 109th → 27th+0.37409
 Guinea0.14727 → 0.51048 · 186th → 120th+0.36321
 Liechtenstein0.28627 → 0.55442 · 154th → 112th+0.26814
 Costa Rica0.51172 → 0.77003 · 111th → 73rd+0.25831
Declined most
before → after- Afghanistan0.35361 → 0.12101 · 136th → 188th−0.23260
- Syria0.27339 → 0.05275 · 159th → 194th−0.22063
 Burkina Faso0.63900 → 0.43343 · 89th → 129th−0.20557
 Somalia0.26514 → 0.10235 · 162nd → 191st−0.16280
 Antigua and Barbuda0.34800 → 0.19383 · 138th → 173rd−0.15417
196 countries were measured in both 2022 and 2025. The field changed from 197 to 196 countries, so a place can move for reasons that have nothing to do with the country itself.
06Across every edition
GovTech maturity in records
The extremes of the statistic. A record reached by more than one country names none of them.
Highest reading on record
0.99745
GTMI score (0–1)
Lowest reading on record
0.01049
GTMI score (0–1)
Biggest improvement between editions
+0.39005
0.40666 → 0.79671
Biggest decline between editions
−0.23260
0.35361 → 0.12101
Most improved since first measured
+0.39005
0.40666 → 0.79671
At the top most often
2 of 2
editions, alone at the first-listed end
07The parts of the index
Inside the number
World Bank Group publishes the parts the headline is built from. Each part’s highest and lowest country, and its middle value.
| Part | Highest | Lowest | Middle country |
|---|---|---|---|
| Core government systems196 countries | South Korea0.99959 | North Korea0.00869 | 0.66336 |
| Public service delivery196 countries | South Korea1.00000 | Eritrea0.00000 | 0.75073 |
| Digital citizen engagement196 countries | South Korea0.9951 | 2 countries share 0.0000 | 0.4521 |
| GovTech enablers196 countries | Australia0.9979 | Eritrea0.0195 | 0.6847 |
08The measure
About govTech maturity
The GovTech Maturity Index is the World Bank's own survey of how far governments have got with digital public services — 48 indicators covering the systems a state runs, what it delivers online, how citizens engage with it, and the skills and rules behind all three.
What the number is: GTMI score (0–1).
What it does not measure
It measures what a government has built, not what it delivers or whether anyone uses it — a state can run a modern platform that few of its citizens can reach. It is also silent on how many people are online, which no publisher licenses for reuse worldwide.
09Where it fits
Connections
Its part in the Country Index, the statistics whose values line up most closely with it across countries, and others on the same subject.
In the Country Index
A key statistic for Digital & Technology
“How far a state has actually got with digital government — the systems it runs and the services it delivers, where AI readiness measures what it is equipped to adopt next.”
- Edition used
- 2025 (data 2025)
- Countries
- 196
- Licence
- CC BY 4.0
Moves with
Where govTech maturity is higher, these tend to be higher too.
- Government AI Readiness IndexKeyOxford Insights · 193 countries in commonρ 0.87
- Statistical Performance IndicatorsKeyWorld Bank Group · 186 countries in commonρ 0.79
- Open Data InventoryOpen Data Watch · 165 countries in commonρ 0.67
Moves against
Where govTech maturity is higher, these tend to be lower.
- Gender Inequality IndexUNDP Human Development Report Office · 171 countries in commonρ −0.67
- Climate Vulnerability (ND-GAIN)KeyNotre Dame Global Adaptation Initiative (ND-GAIN), University of Notre Dame · 189 countries in commonρ −0.62
- Prevalence of UndernourishmentFAO · 163 countries in commonρ −0.61
Rank correlation (ρ, from −1 to 1) across countries, on each statistic’s newest edition, out of 189 statistics sharing at least 80 countries with this one. Two statistics that move together do not cause each other.
10Keep reading
Explore further
The data, edition by edition
The countries at either end
More from World Bank Group
- Access to Electricity
- Account Ownership at a Financial Institution
- Adjusted Net Savings
- Agriculture, Forestry and Fishing Value Added (% of GDP)
- Average Time to Clear Exports Through Customs
- Business Ready: Operational Efficiency
- Business Ready: Public Services
- Business Ready: Regulatory Framework
- All statistics
11Questions
GovTech maturity: questions and answers
Which country has the highest govTech maturity?
South Korea, at 0.99745, among the 196 countries compared in 2025.
Which country has the lowest govTech maturity?
North Korea, at 0.01049, among the 196 countries compared in 2025.
How many countries does the GovTech Maturity Index cover?
196 in 2025, and 197 at least once across all editions. The number measured varies from 196 to 197 between editions.
What is the world average govTech maturity?
This site does not calculate a world average, which would depend on how countries are weighted. In the middle country of the 196 compared in 2025, the figure was 0.63045.
Is this World Bank Group’s own ranking?
No. World Bank Group publishes the values but ranks nobody; the position on this page is derived by Nations Inquiry by ordering the published values, and equal values share a position.
How often is the GovTech Maturity Index published?
This site holds 2 editions, describing 2022 to 2025.
Where does the data come from, and can I download it?
From World Bank Group, under CC BY 4.0. From World Bank Data360, the Bank's own dissemination of its own survey. This is the Bank measuring, not the Bank redistributing somebody else's measurement — which is why its CC BY 4.0 grant reaches it. Every edition is on this site’s Datasets pages as a full table, and downloads as a CSV file with every value unrounded.
12Method
Sources, method and citation
Source
GovTech Maturity Index — World Bank Group
From World Bank Data360, the Bank's own dissemination of its own survey. This is the Bank measuring, not the Bank redistributing somebody else's measurement — which is why its CC BY 4.0 grant reaches it.
Newest edition
Report year 2025Data year 2025
Cite the source as: World Bank. GovTech Maturity Index (GTMI). Washington, DC: World Bank Group.
Licence: CC BY 4.0, checked 2026-09-25.
How this page reads the numbers
- World Bank Group ranks nobody on this measure. The position is derived by Nations Inquiry by ordering the published values; equal values share a position.
- Which end is better follows the publisher’s own reading of the measure.
- A country is named at an end only when it holds that value alone. Where several share it, the page says how many and names none first.
- Values are stored exactly as published and trimmed only for display. “The middle country” is the median of the countries measured, not a world average.
The file itself, column by column — where it came from, what each column holds, and every edition as a CSV — is on its dataset page.
Photographs
The countries at the top of this statistic, from their profiles: Wikimedia Commons, shown in greyscale, each used under the licence named.
- South Korea — Unknown author, CC BY-SA 2.0
- Saudi Arabia — Mardetanha, CC BY-SA 3.0
- Estonia — Andrus Uuetalu derivative work: Jjtkk, CC BY-SA 3.0 ee
Cite this page
Nations Inquiry (2026). GovTech maturity by country: GovTech Maturity Index, data from World Bank Group. https://nationsinquiry.com/statistics/govtech-maturity