V-Dem Institute, University of Gothenburg · Mass Mobilization
Mass mobilization by country
How often, and in what numbers, did people take to the streets this year?
Of the 172 countries compared in 2025, Madagascar had the highest reading, 3.847, and Eritrea had the lowest reading, -3.318. In the middle country the figure was 0.191. Among the 163 countries measured in every edition since 1990, the middle one moved from 0.062 to 0.192.
Part ofDemocracy & Civil Liberties
Mass mobilization · 2025
Context statistic

Highest of 172Madagascar
3.847012025 · values only
The highest and the lowest
The three countries with the highest values of 172 compared, the three with the lowest, and the highest on each continent. This statistic has no better end, so no country is shown as leading.
- 1
- 2

- 3

Lowest in 2025
 Eritrea-3.318
 Nicaragua-3.141
 United Arab Emirates-3.068
This statistic has no better end: the two ends describe size, not success.
Highest on each continent
- AfricaMadagascar3.847
- Americas
 Argentina2.598
 - Asia
 South Korea3.129
 - EuropeSerbia3.791
- Oceania
 New Zealand0.190
 - Every region
02Every measured country
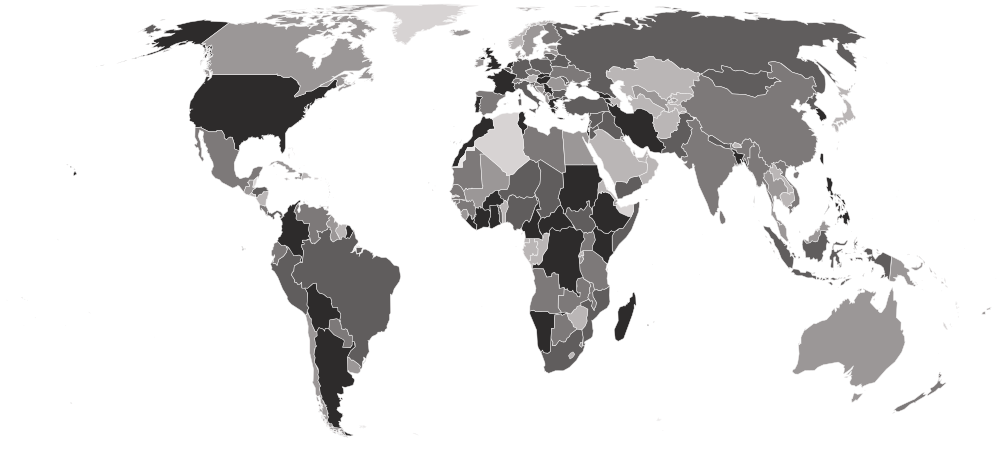
Mass mobilization on a map
Each country is shaded by its value, in five groups holding the same number of countries. Hover a country for its value, or select it to open its profile. Below the map, each continent’s middle country.
Darker is a higher value. This statistic has no better end, so the shades describe size, not success.
- -3.318–-1.143
- -1.140–-0.182
- -0.176–0.467
- 0.473–1.316
- 1.319–3.847
- No reading in 2025 (4 measured in an earlier edition)
- Europe
0.355
the middle country, of 40 measured · 49 members
Serbia3.791 Norway-1.722
Highest and lowest reading in Europe.
- Africa
0.245
the middle country, of 53 measured · 55 members
Madagascar3.847Eritrea-3.318Highest and lowest reading in Africa.
- Asia
-0.022
the middle country, of 48 measured · 52 members
South Korea3.129United Arab Emirates-3.068Highest and lowest reading in Asia.
- Americas
-0.077
the middle country, of 26 measured · 48 members
Argentina2.598Nicaragua-3.141Highest and lowest reading in Americas.
- Oceania
-0.607
the middle country, of 5 measured · 21 members
New Zealand0.190 Solomon Islands-1.617
Highest and lowest reading in Oceania.
- Every region
20 sub-regions, highest middle country first
- Northern Africa
1.466
the middle country, of 5 measured · 6 members
 Morocco1.588
 Egypt-1.042
Highest and lowest reading in Northern Africa.
- Eastern Asia
1.078
the middle country, of 7 measured · 8 members
South Korea3.129 Japan-2.132
Highest and lowest reading in Eastern Asia.
- Western Europe
1.035
the middle country, of 7 measured · 9 members
 Netherlands3.179
 Austria-1.266
Highest and lowest reading in Western Europe.
- Eastern Europe
0.911
the middle country, of 10 measured · 10 members
 Hungary2.680
 Romania-0.300
Highest and lowest reading in Eastern Europe.
- Western Asia
0.473
the middle country, of 17 measured · 19 members
 Israel2.939United Arab Emirates-3.068
Highest and lowest reading in Western Asia.
- South America
0.461
the middle country, of 12 measured · 12 members
Argentina2.598 Suriname-1.230
Highest and lowest reading in South America.
- Southern Africa
0.455
the middle country, of 5 measured · 5 members
 Namibia1.374
 Lesotho-1.150
Highest and lowest reading in Southern Africa.
- Southern Europe
0.408
the middle country, of 13 measured · 17 members
Serbia3.791 Bosnia and Herzegovina-0.665
Highest and lowest reading in Southern Europe.
- Southern Asia
0.341
the middle country, of 9 measured · 9 members
 Bangladesh2.233
 Afghanistan-2.557
Highest and lowest reading in Southern Asia.
- Middle Africa
0.245
the middle country, of 9 measured · 9 members
 Cameroon1.922
 Equatorial Guinea-1.916
Highest and lowest reading in Middle Africa.
- Western Africa
0.139
the middle country, of 16 measured · 16 members
 Liberia2.958
 Gambia-2.336
Highest and lowest reading in Western Africa.
- Eastern Africa
0.002
the middle country, of 18 measured · 19 members
Madagascar3.847Eritrea-3.318Highest and lowest reading in Eastern Africa.
- Central America
-0.176
the middle country, of 7 measured · 8 members
 Panama0.978Nicaragua-3.141
Highest and lowest reading in Central America.
- South-eastern Asia
-0.278
the middle country, of 10 measured · 11 members
 Philippines2.073
 Singapore-1.939
Highest and lowest reading in South-eastern Asia.
- Northern Europe
-0.675
the middle country, of 10 measured · 13 members
United Kingdom3.783Norway-1.722Highest and lowest reading in Northern Europe.
- Central Asia
-1.439
the middle country, of 5 measured · 5 members
 Uzbekistan-0.996
 Turkmenistan-2.244
Highest and lowest reading in Central Asia.
- Caribbean
-1.505
the middle country, of 5 measured · 24 members
 Haiti0.023
 Trinidad and Tobago-2.471
Highest and lowest reading in Caribbean.
- Australia and New Zealand
2 of 2 measured — too few for a middle: Australia, New Zealand.
New Zealand0.190 Australia-0.418
Highest and lowest reading in Australia and New Zealand.
- Melanesia
3 of 5 measured — too few for a middle: Fiji, Papua New Guinea, Solomon Islands.
 Papua New Guinea-0.607Solomon Islands-1.617
Highest and lowest reading in Melanesia.
- Northern America
2 of 4 measured — too few for a middle: Canada, United States.
 United States2.481
 Canada-0.453
Highest and lowest reading in Northern America.
03The whole field at once
The spread
172 countries, one dot each, on one scale — further right is a higher value. Half the countries are above 0.191; a quarter are above 1.085, and a quarter below -0.994. The bar in each row marks that continent’s middle country.
04All 176 ever measured
Every country
In order, highest value first. No rank or position is shown: too many countries share the same value for an order to mean anything. Neither end is better, so no position is given. A high figure can mean a free society whose people march or one in upheaval; a low figure can mean calm or a ban on gathering. Rallies staged by a government count as mobilization too.
Showing 25 of 176 countries

































































































































Values for 2025. The change column compares 2025 with 2024 only; the sparkline covers the recent editions.
051990–2025 · 36 reference years
Over time
Each point is one year from 1990, all of them re-estimated together in V-Dem's v16 release. A single year says more about that year's events — an election, an uprising, an economic shock — than about a country's character, so read the series as a record rather than a trend.
- the middle country
- the middle half of countries
- the middle of the 163 countries measured every time
- each continent’s middle country
The same, year by year
| Year | Countries | Middle country | Middle half | Measured every time |
|---|---|---|---|---|
| 2025 | 172 | 0.191 | -0.994 – 1.085 | 0.192 |
| 2024 | 175 | 0.113 | -0.994 – 1.002 | 0.135 |
| 2023 | 176 | 0.130 | -0.910 – 1.055 | 0.170 |
| 2022 | 176 | 0.154 | -0.941 – 1.071 | 0.195 |
| 2021 | 176 | -0.078 | -0.944 – 0.823 | -0.048 |
| 2020 | 176 | -0.120 | -1.014 – 0.931 | -0.049 |
| 2019 | 176 | 0.369 | -0.718 – 1.337 | 0.396 |
| 2018 | 176 | 0.262 | -0.814 – 1.201 | 0.307 |
| 2017 | 176 | 0.313 | -0.919 – 1.077 | 0.345 |
| 2016 | 176 | 0.201 | -0.915 – 1.071 | 0.275 |
| 2015 | 176 | 0.182 | -1.008 – 1.066 | 0.200 |
| 2014 | 176 | 0.178 | -0.954 – 1.052 | 0.170 |
| 2013 | 176 | 0.163 | -0.919 – 1.110 | 0.177 |
| 2012 | 176 | 0.154 | -0.894 – 1.225 | 0.149 |
| 2011 | 176 | 0.144 | -0.849 – 1.085 | 0.173 |
| 2010 | 175 | -0.044 | -0.880 – 0.880 | -0.017 |
| 2009 | 175 | 0.101 | -1.054 – 0.819 | 0.062 |
| 2008 | 175 | -0.067 | -1.158 – 0.825 | -0.067 |
| 2007 | 175 | -0.090 | -1.242 – 0.800 | -0.048 |
| 2006 | 175 | -0.239 | -1.178 – 0.879 | -0.239 |
| 2005 | 175 | -0.131 | -1.175 – 0.820 | -0.131 |
| 2004 | 174 | -0.242 | -1.176 – 0.744 | -0.287 |
| 2003 | 174 | -0.249 | -1.170 – 0.811 | -0.253 |
| 2002 | 174 | -0.287 | -1.241 – 0.799 | -0.300 |
| 2001 | 174 | -0.342 | -1.175 – 0.768 | -0.354 |
| 2000 | 174 | -0.175 | -1.167 – 0.791 | -0.197 |
| 1999 | 173 | -0.197 | -1.186 – 0.704 | -0.217 |
| 1998 | 172 | -0.196 | -1.179 – 0.659 | -0.250 |
| 1997 | 171 | -0.197 | -1.270 – 0.768 | -0.197 |
| 1996 | 171 | -0.145 | -1.305 – 0.702 | -0.145 |
| 1995 | 171 | -0.197 | -1.193 – 0.691 | -0.197 |
| 1994 | 171 | -0.145 | -1.118 – 0.740 | -0.145 |
| 1993 | 171 | -0.145 | -1.165 – 0.724 | -0.128 |
| 1992 | 170 | -0.084 | -0.950 – 0.890 | -0.094 |
| 1991 | 169 | 0.132 | -0.854 – 0.921 | 0.114 |
| 1990 | 166 | 0.055 | -0.947 – 1.056 | 0.062 |
062024 → 2025
Who rose and fell
The biggest changes in value between the two newest editions — reference years recalculated in one report, not two separate publications. Places are shown second, because they also move when other countries do.
Rose most
before → after- Madagascar0.960 → 3.847+2.887
 Lithuania-1.488 → 1.213+2.701
 Togo-1.669 → 0.521+2.190
 Côte d’Ivoire0.596 → 2.620+2.024
- Hungary0.699 → 2.680+1.981
Fell most
before → after Sri Lanka2.159 → 0.277−1.882
 El Salvador0.203 → -1.599−1.802
 Maldives1.264 → -0.512−1.776
- Gambia-0.873 → -2.336−1.463
- Eritrea-1.989 → -3.318−1.329
172 countries were measured in both 2024 and 2025. The field changed from 175 to 172 countries, so a place can move for reasons that have nothing to do with the country itself.
07Across every edition
Mass mobilization in records
The extremes of the statistic. A record reached by more than one country names none of them.
Highest reading on record
4.023
Original latent estimate (≈ −3.6 to +4); higher = more and larger events
Lowest reading on record
-3.566
Original latent estimate (≈ −3.6 to +4); higher = more and larger events
Biggest rise between editions
+4.537
-0.566 → 3.971
Biggest fall between editions
−4.811
3.951 → -0.860
Biggest change since first measured
+4.612
-0.765 → 3.847
Highest most often
4 of 36
editions, alone at the first-listed end
08The measure
About mass mobilization
V-Dem's measure of mass mobilization asks how often, and on what scale, people took part in demonstrations, strikes, sit-ins and similar mass events during the year — including rallies organised by the state itself. It is an expert-coded estimate on an open-ended scale centred near zero, and a higher figure means more and larger events.
What the number is: Original latent estimate (≈ −3.6 to +4); higher = more and larger events.
09Where it fits
Connections
Its part in the Country Index, the statistics whose values line up most closely with it across countries, and others on the same subject.
In the Country Index
Context, with no vote
This statistic is published in full under Democracy & Civil Liberties, but does not help decide any Country Index standing.
Moves with
Where mass mobilization is higher, these tend to be higher too.
No statistic lines up this closely.
Moves against
Where mass mobilization is higher, these tend to be lower.
No statistic lines up this closely.
Rank correlation (ρ, from −1 to 1) across countries, on each statistic’s newest edition, out of 308 statistics sharing at least 80 countries with this one. Two statistics that move together do not cause each other.
10Keep reading
Explore further
The subject
The countries at either end
More from V-Dem Institute, University of Gothenburg
11Questions
Mass mobilization: questions and answers
Which country has the highest mass mobilization?
Madagascar, at 3.847, among the 172 countries compared in 2025.
Which country has the lowest mass mobilization?
Eritrea, at -3.318, among the 172 countries compared in 2025.
How many countries does the Mass Mobilization cover?
172 in 2025, and 176 at least once across all editions. The number measured varies from 166 to 176 between editions.
What is the world average mass mobilization?
This site does not calculate a world average, which would depend on how countries are weighted. In the middle country of the 172 compared in 2025, the figure was 0.191.
Is this V-Dem Institute, University of Gothenburg’s own ranking?
No ranking is shown. V-Dem Institute, University of Gothenburg publishes values only, and too many countries share the same value for an ordering to mean anything, so none is derived.
How often is the Mass Mobilization published?
This site holds 36 reference years, 1990–2025, all recalculated in V-Dem Institute, University of Gothenburg’s 2026 report on one method — not 36 separate publications.
Where does the data come from, and can I download it?
From V-Dem Institute, University of Gothenburg, under CC BY-SA 4.0. From the V-Dem Institute's Country-Year Full+Others dataset (v16), University of Gothenburg — this indicator is not in the smaller Core file — published under CC BY-SA 4.0. V-Dem's data runs back to 1900 for this question; the series here starts in 1990 so that every row belongs to a present-day country. Stored as the measurement model's original estimate, not V-Dem's 0–4 rescaling. Every edition is on this site’s Datasets pages as a full table, and downloads as a CSV file with every value unrounded.
12Method
Sources, method and citation
Source
Mass Mobilization — V-Dem Institute, University of Gothenburg
From the V-Dem Institute's Country-Year Full+Others dataset (v16), University of Gothenburg — this indicator is not in the smaller Core file — published under CC BY-SA 4.0. V-Dem's data runs back to 1900 for this question; the series here starts in 1990 so that every row belongs to a present-day country. Stored as the measurement model's original estimate, not V-Dem's 0–4 rescaling.
Newest edition
Report year 2025Data year 2025
Cite the source as: Coppedge, M. et al. V-Dem Country-Year Dataset v16. Varieties of Democracy (V-Dem) Project, University of Gothenburg.
Licence: CC BY-SA 4.0, checked 2026-09-29.
How this page reads the numbers
- No rank or position is shown: V-Dem Institute, University of Gothenburg publishes values only, and too many countries share the same value for an ordering to mean anything.
- This statistic has no better end, so the page describes higher and lower values and never calls a country a leader.
- A country is named at an end only when it holds that value alone. Where several share it, the page says how many and names none first.
- Values are stored exactly as published and trimmed only for display. “The middle country” is the median of the countries measured, not a world average.
The file itself, column by column — where it came from, what each column holds, and every edition as a CSV — is on its dataset page.
Cite this page
Nations Inquiry (2026). Mass mobilization by country: Mass Mobilization, data from V-Dem Institute, University of Gothenburg. https://nationsinquiry.com/statistics/mass-mobilization