V-Dem Institute, University of Gothenburg · Equal Protection Index
Equal protection of rights by country
Does the state protect the rights and freedoms of every social group and class equally?
Luxembourg placed first of the 176 countries compared in 2025, at 0.986, and Afghanistan last, at 0.027. In the middle country the figure was 0.651. Among the 168 countries measured in every edition since 1990, the middle one moved from 0.635 to 0.651.
Share
Equal protection of rights · 2025
Context statistic

Highest of 176Luxembourg
0.986012025 · position · derived
Who leads
The three countries at the highest end of 176 compared, the three at the other end, and the first on each continent.
 1
1Photo: Michal Osmenda from Brussels, Belgium · CC BY-SA 2.0, greyscale
 2
2Photo: User:Aconcagua · CC BY-SA 3.0, greyscale
 3
3Photo: JurriaanH · CC BY-SA 3.0, greyscale
Lowest in 2025
- 176
 Afghanistan0.027
 - 175
 South Sudan0.057
 - 174
 Cambodia0.067
Positions out of 176. Where a country sits says how it compares with the others measured, and nothing about why.
Highest on each continent
- Africa
 Seychelles0.914
 - Americas
 Costa Rica0.917
 - Asia
 Japan0.978
 - EuropeLuxembourg0.986
- Oceania
 New Zealand0.884
 - Every region
02Every measured country
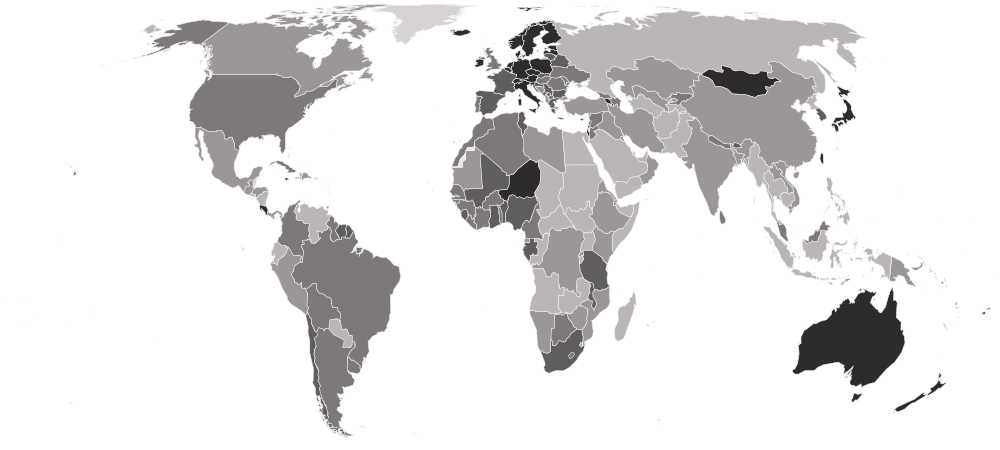
Equal protection of rights on a map
Each country is shaded by its value, in five groups holding the same number of countries. Hover a country for its value, or select it to open its profile. Below the map, each continent’s middle country.
Darker is a higher value — the better end.
- 0.027–0.336
- 0.363–0.596
- 0.602–0.706
- 0.711–0.824
- 0.827–0.986
- No reading in 2025
- Europe
0.819
the middle country, of 40 measured · 49 members
Luxembourg0.986 Russia0.312
Highest and lowest reading in Europe.
- Oceania
0.793
the middle country, of 6 measured · 21 members
New Zealand0.884 Papua New Guinea0.504
Highest and lowest reading in Oceania.
- Africa
0.627
the middle country, of 55 measured · 55 members
Seychelles0.914South Sudan0.057Highest and lowest reading in Africa.
- Americas
0.604
the middle country, of 27 measured · 48 members
Costa Rica0.917 Haiti0.069
Highest and lowest reading in Americas.
- Asia
0.541
the middle country, of 48 measured · 52 members
Japan0.978Afghanistan0.027Highest and lowest reading in Asia.
- Every region
20 sub-regions, highest middle country first
- Western Europe
0.955
the middle country, of 7 measured · 9 members
Luxembourg0.986 France0.772
Highest and lowest reading in Western Europe.
- Northern Europe
0.916
the middle country, of 10 measured · 13 members
 Denmark0.980
 United Kingdom0.706
Highest and lowest reading in Northern Europe.
- Eastern Asia
0.817
the middle country, of 7 measured · 8 members
Japan0.978 North Korea0.099
Highest and lowest reading in Eastern Asia.
- Southern Europe
0.743
the middle country, of 13 measured · 17 members
 Italy0.929
 Bosnia and Herzegovina0.572
Highest and lowest reading in Southern Europe.
- Caribbean
0.717
the middle country, of 6 measured · 24 members
 Jamaica0.837Haiti0.069
Highest and lowest reading in Caribbean.
- Eastern Europe
0.709
the middle country, of 10 measured · 10 members
 Czechia0.955Russia0.312
Highest and lowest reading in Eastern Europe.
- Western Africa
0.708
the middle country, of 16 measured · 16 members
 Niger0.879
 Mauritania0.452
Highest and lowest reading in Western Africa.
- Southern Africa
0.651
the middle country, of 5 measured · 5 members
 South Africa0.740
 Eswatini0.178
Highest and lowest reading in Southern Africa.
- South America
0.623
the middle country, of 12 measured · 12 members
 Chile0.789
 Venezuela0.177
Highest and lowest reading in South America.
- Western Asia
0.596
the middle country, of 17 measured · 19 members
 Cyprus0.907
 Yemen0.086
Highest and lowest reading in Western Asia.
- Southern Asia
0.560
the middle country, of 9 measured · 9 members
 Bhutan0.772Afghanistan0.027
Highest and lowest reading in Southern Asia.
- Northern Africa
0.549
the middle country, of 6 measured · 6 members
 Tunisia0.782
 Egypt0.229
Highest and lowest reading in Northern Africa.
- Eastern Africa
0.505
the middle country, of 19 measured · 19 members
Seychelles0.914South Sudan0.057Highest and lowest reading in Eastern Africa.
- Central Asia
0.402
the middle country, of 5 measured · 5 members
 Kyrgyzstan0.638
 Tajikistan0.098
Highest and lowest reading in Central Asia.
- Middle Africa
0.402
the middle country, of 9 measured · 9 members
 São Tomé and Príncipe0.746
 Angola0.076
Highest and lowest reading in Middle Africa.
- Central America
0.371
the middle country, of 7 measured · 8 members
Costa Rica0.917 El Salvador0.197
Highest and lowest reading in Central America.
- South-eastern Asia
0.358
the middle country, of 10 measured · 11 members
 Singapore0.858Cambodia0.067
Highest and lowest reading in South-eastern Asia.
- Australia and New Zealand
2 of 2 measured — too few for a middle: Australia, New Zealand.
New Zealand0.884 Australia0.859
Highest and lowest reading in Australia and New Zealand.
- Melanesia
4 of 5 measured — too few for a middle: Fiji, Papua New Guinea, Solomon Islands, Vanuatu.
 Vanuatu0.829Papua New Guinea0.504
Highest and lowest reading in Melanesia.
- Northern America
2 of 4 measured — too few for a middle: Canada, United States.
 United States0.608
 Canada0.456
Highest and lowest reading in Northern America.
03The whole field at once
The spread
176 countries, one dot each, on one scale — further right is a higher value. Half the countries are above 0.651; a quarter are above 0.775, and a quarter below 0.413. The bar in each row marks that continent’s middle country.
04All 176 ever measured
Every country
In order, highest value first. “=” marks a position shared with another country. V-Dem Institute, University of Gothenburg ranks nobody on this measure; the position is derived here by ordering the published values. Higher is better. It rates practice rather than law: a country whose statutes treat everyone alike, but whose officials, police or courts do not, reads low. It is about civil liberties, not about how equally income or political power are shared, which V-Dem measures separately.
Showing 25 of 176 countries






























































































































Values for 2025. The change column compares 2025 with 2024 only; the sparkline covers the recent editions.
051990–2025 · 36 reference years
Over time
Each point is one year from 1990, all of them re-estimated together in V-Dem's v16 release, so a later release can shift the whole line slightly. A sustained change over several years says more than one year's move.
- the middle country
- the middle half of countries
- the middle of the 168 countries measured every time
- each continent’s middle country
The same, year by year
| Year | Countries | Middle country | Middle half | Measured every time |
|---|---|---|---|---|
| 2025 | 176 | 0.651 | 0.413 – 0.775 | 0.651 |
| 2024 | 176 | 0.673 | 0.454 – 0.784 | 0.673 |
| 2023 | 176 | 0.677 | 0.438 – 0.789 | 0.677 |
| 2022 | 176 | 0.677 | 0.455 – 0.812 | 0.677 |
| 2021 | 176 | 0.690 | 0.456 – 0.804 | 0.690 |
| 2020 | 176 | 0.684 | 0.479 – 0.818 | 0.682 |
| 2019 | 176 | 0.686 | 0.486 – 0.823 | 0.686 |
| 2018 | 176 | 0.686 | 0.487 – 0.817 | 0.684 |
| 2017 | 176 | 0.698 | 0.488 – 0.825 | 0.698 |
| 2016 | 176 | 0.690 | 0.499 – 0.828 | 0.690 |
| 2015 | 176 | 0.702 | 0.502 – 0.830 | 0.702 |
| 2014 | 176 | 0.701 | 0.509 – 0.831 | 0.701 |
| 2013 | 176 | 0.702 | 0.504 – 0.831 | 0.702 |
| 2012 | 176 | 0.698 | 0.537 – 0.838 | 0.696 |
| 2011 | 176 | 0.698 | 0.530 – 0.839 | 0.698 |
| 2010 | 175 | 0.699 | 0.534 – 0.839 | 0.698 |
| 2009 | 175 | 0.694 | 0.531 – 0.838 | 0.688 |
| 2008 | 175 | 0.694 | 0.529 – 0.845 | 0.693 |
| 2007 | 175 | 0.690 | 0.525 – 0.840 | 0.689 |
| 2006 | 175 | 0.691 | 0.525 – 0.839 | 0.690 |
| 2005 | 175 | 0.688 | 0.525 – 0.835 | 0.686 |
| 2004 | 175 | 0.695 | 0.525 – 0.833 | 0.692 |
| 2003 | 175 | 0.690 | 0.519 – 0.833 | 0.690 |
| 2002 | 175 | 0.690 | 0.511 – 0.833 | 0.690 |
| 2001 | 175 | 0.693 | 0.515 – 0.831 | 0.692 |
| 2000 | 175 | 0.690 | 0.513 – 0.831 | 0.690 |
| 1999 | 175 | 0.680 | 0.493 – 0.824 | 0.681 |
| 1998 | 174 | 0.677 | 0.472 – 0.826 | 0.679 |
| 1997 | 173 | 0.679 | 0.461 – 0.821 | 0.683 |
| 1996 | 173 | 0.678 | 0.462 – 0.825 | 0.679 |
| 1995 | 173 | 0.678 | 0.462 – 0.825 | 0.679 |
| 1994 | 173 | 0.669 | 0.462 – 0.821 | 0.672 |
| 1993 | 173 | 0.668 | 0.444 – 0.821 | 0.669 |
| 1992 | 172 | 0.667 | 0.443 – 0.820 | 0.667 |
| 1991 | 171 | 0.666 | 0.435 – 0.819 | 0.665 |
| 1990 | 168 | 0.635 | 0.421 – 0.825 | 0.635 |
062024 → 2025
Who rose and fell
The biggest changes in value between the two newest editions — reference years recalculated in one report, not two separate publications. Places are shown second, because they also move when other countries do.
Improved most
before → after Syria0.417 → 0.631 · 135th → 96th+0.214
 Sudan0.163 → 0.238 · 165th → 152nd+0.075
 Nigeria0.678 → 0.741 · 84th → 59th+0.063
 Eritrea0.390 → 0.449 · 138th → 129th+0.059
- El Salvador0.152 → 0.197 · 166th → 161st+0.045
Declined most
before → after Uganda0.588 → 0.267 · 109th → 149th−0.321
 Zambia0.499 → 0.209 · 122nd → 158th−0.290
 Portugal0.810 → 0.614 · 38th → 101st−0.196
 Indonesia0.496 → 0.300 · 124th → 146th−0.196
 Republic of the Congo0.276 → 0.084 · 150th → 170th−0.192
176 countries were measured in both 2024 and 2025.
07Across every edition
Equal protection of rights in records
The extremes of the statistic. A record reached by more than one country names none of them.
Highest reading on record
0.986
Equal protection index (0–1); higher = rights and freedoms protected more equally across social groups and classes
Lowest reading on record
0.013
Equal protection index (0–1); higher = rights and freedoms protected more equally across social groups and classes
Biggest improvement between editions
+0.681
0.038 → 0.719
Biggest decline between editions
−0.340
0.745 → 0.405
Most improved since first measured
+0.702
0.038 → 0.740
At the top most often
34 of 36
editions, alone at the first-listed end
08The measure
About equal protection of rights
V-Dem's Equal Protection Index asks how evenly a state protects the rights and freedoms of everyone it governs — whether people of every social class and every social group enjoy the same civil liberties in practice, or some are left with weaker ones. It runs from 0 to 1, and a higher figure means more equal protection.
What the number is: Equal protection index (0–1); higher = rights and freedoms protected more equally across social groups and classes.
What it does not measure
It rates how evenly rights are protected in practice, not what the law says on paper, and it says nothing about how equally income or political power are shared.
09Where it fits
Connections
Its part in the Country Index, the statistics whose values line up most closely with it across countries, and others on the same subject.
In the Country Index
Context, with no vote
This statistic is published in full under Governance & Institutions and Democracy & Civil Liberties, but does not help decide any Country Index standing.
Governance & InstitutionsDemocracy & Civil LibertiesWhich statistics vote, and why
Moves with
Where equal protection of rights is higher, these tend to be higher too.
- Egalitarian Democracy IndexV-Dem Institute, University of Gothenburg · 176 countries in commonρ 0.84
- Physical Violence IndexKeyV-Dem Institute, University of Gothenburg · 176 countries in commonρ 0.77
- Women's Political Empowerment IndexKeyV-Dem Institute, University of Gothenburg · 176 countries in commonρ 0.75
Moves against
Where equal protection of rights is higher, these tend to be lower.
- Exclusion by Socio-Economic GroupV-Dem Institute, University of Gothenburg · 174 countries in commonρ −0.79
- Neopatrimonial Rule IndexV-Dem Institute, University of Gothenburg · 176 countries in commonρ −0.75
- Political Corruption IndexV-Dem Institute, University of Gothenburg · 176 countries in commonρ −0.70
Rank correlation (ρ, from −1 to 1) across countries, on each statistic’s newest edition, out of 379 statistics sharing at least 80 countries with this one. Two statistics that move together do not cause each other.
10Keep reading
Explore further
The countries at either end
More from V-Dem Institute, University of Gothenburg
11Questions
Equal protection of rights: questions and answers
Which country has the highest equal protection of rights?
Luxembourg, at 0.986, among the 176 countries compared in 2025.
Which country has the lowest equal protection of rights?
Afghanistan, at 0.027, among the 176 countries compared in 2025.
How many countries does the Equal Protection Index cover?
176 in 2025. The number measured varies from 168 to 176 between editions.
What is the world average equal protection of rights?
This site does not calculate a world average, which would depend on how countries are weighted. In the middle country of the 176 compared in 2025, the figure was 0.651.
Is this V-Dem Institute, University of Gothenburg’s own ranking?
No. V-Dem Institute, University of Gothenburg publishes the values but ranks nobody; the position on this page is derived by Nations Inquiry by ordering the published values, and equal values share a position.
How often is the Equal Protection Index published?
This site holds 36 reference years, 1990–2025, all recalculated in V-Dem Institute, University of Gothenburg’s 2026 report on one method — not 36 separate publications.
Where does the data come from, and can I download it?
From V-Dem Institute, University of Gothenburg, under CC BY-SA 4.0. From the V-Dem Institute's Country-Year Core dataset (v16), University of Gothenburg, published under CC BY-SA 4.0. V-Dem's data runs back to 1789; the series here starts in 1990 so that every row belongs to a present-day country. Every edition is on this site’s Datasets pages as a full table, and downloads as a CSV file with every value unrounded.
12Method
Sources, method and citation
Source
Equal Protection Index — V-Dem Institute, University of Gothenburg
From the V-Dem Institute's Country-Year Core dataset (v16), University of Gothenburg, published under CC BY-SA 4.0. V-Dem's data runs back to 1789; the series here starts in 1990 so that every row belongs to a present-day country.
Newest edition
Report year 2025Data year 2025
Cite the source as: Coppedge, M. et al. V-Dem Country-Year Dataset v16. Varieties of Democracy (V-Dem) Project, University of Gothenburg.
Licence: CC BY-SA 4.0, checked 2026-10-03.
How this page reads the numbers
- V-Dem Institute, University of Gothenburg ranks nobody on this measure. The position is derived by Nations Inquiry by ordering the published values; equal values share a position.
- Which end is better follows the publisher’s own reading of the measure.
- A country is named at an end only when it holds that value alone. Where several share it, the page says how many and names none first.
- Values are stored exactly as published and trimmed only for display. “The middle country” is the median of the countries measured, not a world average.
The file itself, column by column — where it came from, what each column holds, and every edition as a CSV — is on its dataset page.
Photographs
The countries at the top of this statistic, from their profiles: Wikimedia Commons, shown in greyscale, each used under the licence named.
- Luxembourg — Michal Osmenda from Brussels, Belgium, CC BY-SA 2.0
- Denmark — User:Aconcagua, CC BY-SA 3.0
- Japan — JurriaanH, CC BY-SA 3.0
Cite this page
Nations Inquiry (2026). Equal protection of rights by country: Equal Protection Index, data from V-Dem Institute, University of Gothenburg. https://nationsinquiry.com/statistics/equal-protection