Ariel Karlinsky and Dmitry Kobak (World Mortality Dataset) · Excess Mortality During the COVID-19 Pandemic
Excess mortality during COVID-19 by country
How many more people died from 2020 to 2023 than earlier trends predicted?
Of the 122 countries compared in the 2026 edition, Greenland had the lowest reading, -264.9, and Serbia had the highest reading, 1,012.8. In the middle country the figure was 272.4.
Share
Part ofHealth & Wellbeing
Excess mortality during COVID-19 · the 2026 edition
Context statistic

Lowest of 122Greenland
-264.901the 2026 edition · values only
Who leads
The three countries at the lowest end of 122 compared, the three at the other end, and the first on each continent.
 1
1Photo: Kim Hansen derivative work: Jjtkk · CC BY-SA 3.0, greyscale
 2
2Photo: Entropy1963 · CC0, greyscale
 3
3Photo: Unknown author · CC BY-SA 3.0, greyscale
Lowest on each continent
- Africa
 Seychelles-82.5
 - AmericasGreenland-264.9
- Asia
 Mongolia5.3
 - Europe
 Gibraltar-243.2
 - Oceania
 New Zealand11.3
 - Every region
02Every measured country
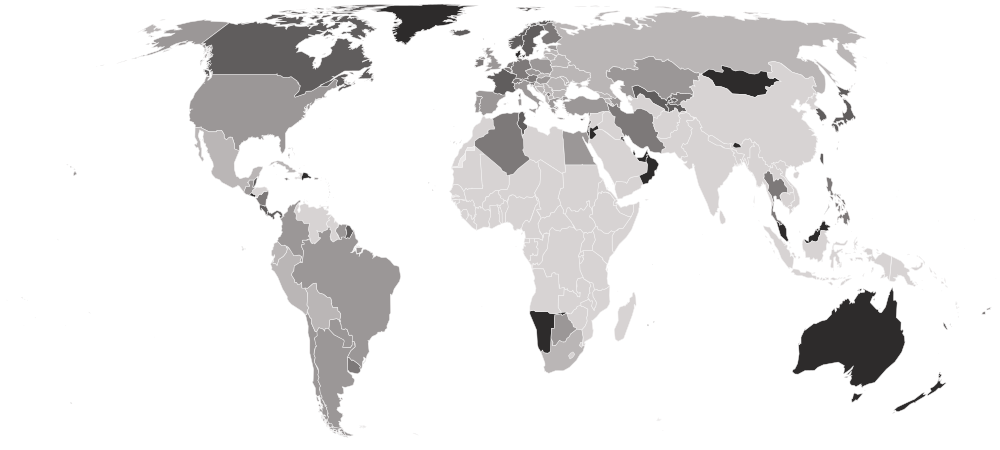
Excess mortality during COVID-19 on a map
Each country is shaded by its value, in five groups holding the same number of countries. Hover a country for its value, or select it to open its profile. Below the map, each continent’s middle country.
Darker is a lower value — the better end.
- 478.3–1,012.8
- 327.3–452.7
- 211.0–324.8
- 146.6–206.9
- -264.9–145.1
- No reading in the 2026 edition
- Oceania
150.9
the middle country, of 5 measured · 21 members
New Zealand11.3 Fiji216.7
Lowest and highest reading in Oceania.
- Asia
178.2
the middle country, of 31 measured · 52 members
Mongolia5.3 Georgia685.2
Lowest and highest reading in Asia.
- Africa
204.2
the middle country, of 9 measured · 55 members
Seychelles-82.5 South Africa523.6
Lowest and highest reading in Africa.
- Americas
327.3
the middle country, of 31 measured · 48 members
Greenland-264.9 Saint Kitts and Nevis759.1
Lowest and highest reading in Americas.
- Europe
363.1
the middle country, of 46 measured · 49 members
Gibraltar-243.2 Serbia1,012.8
Lowest and highest reading in Europe.
- Every region
20 sub-regions, lowest middle country first
- South-eastern Asia
153.5
the middle country, of 5 measured · 11 members
 Brunei132.2
 Thailand276.0
Lowest and highest reading in South-eastern Asia.
- Eastern Asia
171.6
the middle country, of 6 measured · 8 members
Mongolia5.3 Hong Kong266.3
Lowest and highest reading in Eastern Asia.
- Western Asia
173.4
the middle country, of 13 measured · 19 members
 Qatar66.9Georgia685.2
Lowest and highest reading in Western Asia.
- Central America
188.1
the middle country, of 7 measured · 8 members
 El Salvador75.2
 Mexico517.0
Lowest and highest reading in Central America.
- Northern Europe
239.0
the middle country, of 11 measured · 13 members
 Faroe Islands-66.1
 Lithuania942.9
Lowest and highest reading in Northern Europe.
- Caribbean
247.1
the middle country, of 10 measured · 24 members
 Antigua and Barbuda-59.3Saint Kitts and Nevis759.1
Lowest and highest reading in Caribbean.
- Western Europe
276.9
the middle country, of 9 measured · 9 members
 Luxembourg-52.4
 Monaco616.8
Lowest and highest reading in Western Europe.
- Southern Europe
399.5
the middle country, of 16 measured · 17 members
Gibraltar-243.2Serbia1,012.8Lowest and highest reading in Southern Europe.
- South America
426.7
the middle country, of 10 measured · 12 members
 Uruguay215.7
 Peru608.4
Lowest and highest reading in South America.
- Eastern Europe
532.1
the middle country, of 10 measured · 10 members
 Poland420.8
 Belarus944.5
Lowest and highest reading in Eastern Europe.
- Australia and New Zealand
2 of 2 measured — too few for a middle: Australia, New Zealand.
New Zealand11.3 Australia145.1
Lowest and highest reading in Australia and New Zealand.
- Central Asia
4 of 5 measured — too few for a middle: Kazakhstan, Kyrgyzstan, Tajikistan, Uzbekistan.
 Tajikistan154.8
 Kazakhstan418.8
Lowest and highest reading in Central Asia.
- Eastern Africa
2 of 19 measured — too few for a middle: Mauritius, Seychelles.
Seychelles-82.5 Mauritius100.5
Lowest and highest reading in Eastern Africa.
- Melanesia
2 of 5 measured — too few for a middle: Fiji, New Caledonia.
 New Caledonia183.6Fiji216.7
Lowest and highest reading in Melanesia.
- Northern Africa
3 of 6 measured — too few for a middle: Algeria, Egypt, Tunisia.
 Tunisia204.2
 Egypt335.1
Lowest and highest reading in Northern Africa.
- Northern America
4 of 4 measured — too few for a middle: Bermuda, Canada, Greenland, United States.
Greenland-264.9 United States405.5
Lowest and highest reading in Northern America.
- Polynesia
1 of 7 measured — too few for a middle: French Polynesia.
 French Polynesia150.9
Lowest and highest reading in Polynesia.
- Southern Africa
3 of 5 measured — too few for a middle: Botswana, Namibia, South Africa.
 Namibia120.8South Africa523.6
Lowest and highest reading in Southern Africa.
- Southern Asia
3 of 9 measured — too few for a middle: Bhutan, Iran, Maldives.
 Bhutan71.5
 Iran313.6
Lowest and highest reading in Southern Asia.
- Western Africa
1 of 16 measured — too few for a middle: Cabo Verde.
 Cabo Verde146.8
Lowest and highest reading in Western Africa.
03The whole field at once
The spread
122 countries, one dot each, on one scale — further right is a higher value. Half the countries are above 272.4; a quarter are above 424.9, and a quarter below 165.2. The bar in each row marks that continent’s middle country.
04All 122 ever measured
Every country
In order, lowest value first. No rank or position is shown: too many countries share the same value for an order to mean anything. Read the years beside each country: most run to the end of 2023, but some stop in 2020, 2021 or 2022 because their statistics office stopped sending data, and a shorter window means a smaller total. A negative figure is real — fewer deaths than expected. Only countries that publish deaths by week or month appear, which leaves out most of Africa and South Asia; a missing country is not a country with no excess deaths.
Showing 25 of 122 countries




















































































Values for the 2026 edition.
05In this edition
Excess mortality during COVID-19 in records
The extremes of the statistic. A record reached by more than one country names none of them.
Highest reading
1,012.8
Excess deaths per 100,000 people, March 2020 to the end of each country's data (at most December 2023)
Ariel Karlinsky and Dmitry Kobak (World Mortality Dataset) · 2026
Lowest reading
-264.9
Excess deaths per 100,000 people, March 2020 to the end of each country's data (at most December 2023)
Ariel Karlinsky and Dmitry Kobak (World Mortality Dataset) · 2026
06The measure
About Excess mortality during COVID-19
Excess mortality counts how many more people died from all causes during the COVID-19 pandemic than the trend of earlier years predicted, per 100,000 people. Because it does not depend on how deaths were attributed, it is the most comparable measure of the pandemic's full toll — including deaths from COVID-19 that were never recorded as such and deaths from disrupted health care.
What the number is: Excess deaths per 100,000 people, March 2020 to the end of each country's data (at most December 2023).
07Where it fits
Connections
Its part in the Country Index, the statistics whose values line up most closely with it across countries, and others on the same subject.
In the Country Index
Context, with no vote
This statistic is published in full under Health & Wellbeing, but does not help decide any Country Index standing.
Moves with
Where Excess mortality during COVID-19 is higher, these tend to be higher too.
- Crude Death RateUN DESA Population Division · 122 countries in commonρ 0.50
- Arable Land per PersonFAO · 116 countries in commonρ 0.49
- Political PolarizationV-Dem Institute, University of Gothenburg · 100 countries in commonρ 0.48
Moves against
Where Excess mortality during COVID-19 is higher, these tend to be lower.
- Sex Ratio of the Total PopulationUN DESA Population Division · 122 countries in commonρ −0.59
- Livestock DensityFAO · 106 countries in commonρ −0.51
- Cereal Import Dependency RatioFAO · 101 countries in commonρ −0.50
Rank correlation (ρ, from −1 to 1) across countries, on each statistic’s newest edition, out of 306 statistics sharing at least 80 countries with this one. Two statistics that move together do not cause each other.
08Keep reading
Explore further
The subject
The data, edition by edition
09Questions
Excess mortality during COVID-19: questions and answers
Which country has the lowest Excess mortality during COVID-19?
Greenland, at -264.9, among the 122 countries compared in the 2026 edition.
Which country has the highest Excess mortality during COVID-19?
Serbia, at 1,012.8, among the 122 countries compared in the 2026 edition.
How many countries does the Excess Mortality During the COVID-19 Pandemic cover?
122 in the 2026 edition.
What is the world average Excess mortality during COVID-19?
This site does not calculate a world average, which would depend on how countries are weighted. In the middle country of the 122 compared in the 2026 edition, the figure was 272.4.
Is this Ariel Karlinsky and Dmitry Kobak (World Mortality Dataset)’s own ranking?
No ranking is shown. Ariel Karlinsky and Dmitry Kobak (World Mortality Dataset) publishes values only, and too many countries share the same value for an ordering to mean anything, so none is derived.
How often is the Excess Mortality During the COVID-19 Pandemic published?
This site holds one edition, describing 2026.
Where does the data come from, and can I download it?
From Ariel Karlinsky and Dmitry Kobak (World Mortality Dataset), under GNU GPL-3.0. From the table published by Ariel Karlinsky and Dmitry Kobak, who compiled the World Mortality Dataset from national statistical offices and computed each country's baseline; stored as they publish it, with the reported COVID-19 death counts and the model's uncertainty left out. Every edition is on this site’s Datasets pages as a full table, and downloads as a CSV file with every value unrounded.
10Method
Sources, method and citation
Source
Excess Mortality During the COVID-19 Pandemic — Ariel Karlinsky and Dmitry Kobak (World Mortality Dataset)
From the table published by Ariel Karlinsky and Dmitry Kobak, who compiled the World Mortality Dataset from national statistical offices and computed each country's baseline; stored as they publish it, with the reported COVID-19 death counts and the model's uncertainty left out.
Newest edition
Report year 2026Data year not recorded
Cite the source as: Karlinsky, A. and Kobak, D. (2021). Tracking excess mortality across countries during the COVID-19 pandemic with the World Mortality Dataset. eLife 10:e69336. Data: github.com/dkobak/excess-mortality (excess-mortality.csv).
Licence: GNU GPL-3.0, checked 2026-10-03.
How this page reads the numbers
- No rank or position is shown: Ariel Karlinsky and Dmitry Kobak (World Mortality Dataset) publishes values only, and too many countries share the same value for an ordering to mean anything.
- Which end is better follows the publisher’s own reading of the measure.
- A country is named at an end only when it holds that value alone. Where several share it, the page says how many and names none first.
- The file gives each country’s most recent reading, so the rows are from different years. Readings from before 2016 are listed but left out of every comparison on this page.
- Values are stored exactly as published and trimmed only for display. “The middle country” is the median of the countries measured, not a world average.
The file itself, column by column — where it came from, what each column holds, and every edition as a CSV — is on its dataset page.
Photographs
The countries at the top of this statistic, from their profiles: Wikimedia Commons, shown in greyscale, each used under the licence named.
- Greenland — Kim Hansen derivative work: Jjtkk, CC BY-SA 3.0
- Gibraltar — Entropy1963, CC0
- Seychelles — Unknown author, CC BY-SA 3.0
Cite this page
Nations Inquiry (2026). Excess mortality during COVID-19 by country: Excess Mortality During the COVID-19 Pandemic, data from Ariel Karlinsky and Dmitry Kobak (World Mortality Dataset). https://nationsinquiry.com/statistics/excess-mortality