FAO · Dietary Energy Supply
Dietary energy supply by country
How many calories a day does the food supply provide per person?
United States placed first of the 155 countries compared in 2024, at 3,962, and Somalia last, at 1,757. In the middle country the figure was 2,982. Among the 154 countries measured in every edition since 2001, the middle one moved from 2,633 to 2,991.
Share
Dietary energy supply · 2024
Key statistic · Food & Agriculture

Highest of 155United States
3,962012024 · position · derived
Who leads
The three countries at the highest end of 155 compared, the three at the other end, and the first on each continent.
 1
Photo: Stefano Brivio · CC BY 2.0, greyscale
 2
Photo: Gf uip · CC BY-SA 3.0, greyscale
 3
Photo: derivative work: Jjtkk · CC BY-SA 2.0, greyscale
Lowest in 2024
- 155
 Somalia1,757
- 154
 Madagascar1,957
- 153
 Haiti1,998
Positions out of 155. Where a country sits says how it compares with the others measured, and nothing about why.
02Every measured country
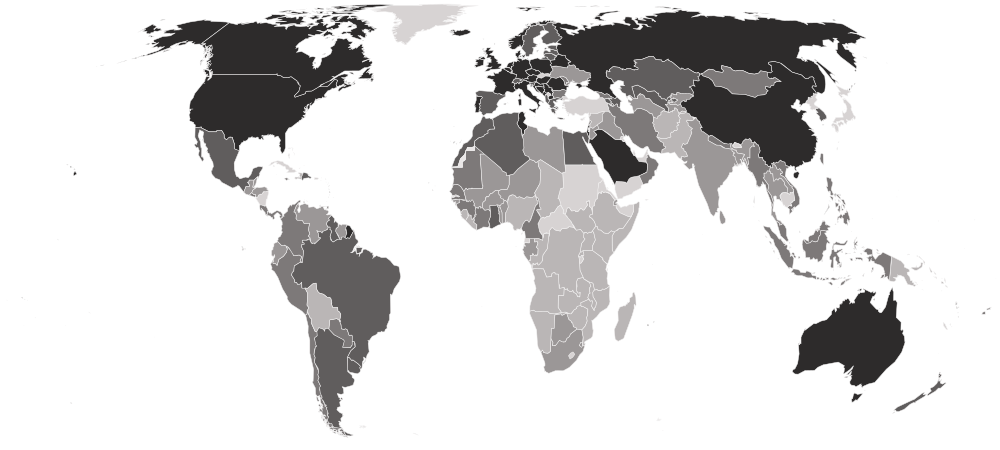
Dietary energy supply on a map
Each country is shaded by its value, in five groups holding the same number of countries. Hover a country for its value, or select it to open its profile. Below the map, each continent’s middle country.
Darker is a higher value — the better end.
- 1,757–2,539
- 2,545–2,846
- 2,851–3,129
- 3,141–3,419
- 3,430–3,962
- No reading in 2024 (3 measured in an earlier edition)
- Europe
3,489
the middle country, of 38 measured · 49 members
 Belgium3,958
 Ukraine2,715
Highest and lowest reading in Europe.
- Americas
3,070
the middle country, of 28 measured · 48 members
United States3,962Haiti1,998Highest and lowest reading in Americas.
- Oceania
3,062
the middle country, of 8 measured · 21 members
 Australia3,540
 Papua New Guinea2,162
Highest and lowest reading in Oceania.
- Asia
2,896
the middle country, of 34 measured · 52 members
 Israel3,774
 Syria2,230
Highest and lowest reading in Asia.
- Africa
2,589
the middle country, of 47 measured · 55 members
 Tunisia3,435Somalia1,757
Highest and lowest reading in Africa.
- Every region
22 sub-regions, highest middle country first
- Western Europe
3,524
the middle country, of 7 measured · 9 members
Belgium3,958 Switzerland3,410
Highest and lowest reading in Western Europe.
- Southern Europe
3,499
the middle country, of 12 measured · 17 members
 Serbia3,905
 Albania3,235
Highest and lowest reading in Southern Europe.
- Eastern Europe
3,453
the middle country, of 9 measured · 10 members
 Poland3,801Ukraine2,715
Highest and lowest reading in Eastern Europe.
- Northern Europe
3,417
the middle country, of 10 measured · 13 members
 Ireland3,923
 Lithuania3,343
Highest and lowest reading in Northern Europe.
- Northern Africa
3,335
the middle country, of 5 measured · 6 members
Tunisia3,435 Libya2,800
Highest and lowest reading in Northern Africa.
- South America
3,084
the middle country, of 12 measured · 12 members
 Brazil3,396
 Bolivia2,344
Highest and lowest reading in South America.
- Caribbean
3,069
the middle country, of 7 measured · 24 members
 Dominican Republic3,367Haiti1,998
Highest and lowest reading in Caribbean.
- Western Asia
3,024
the middle country, of 10 measured · 19 members
Israel3,774Syria2,230Highest and lowest reading in Western Asia.
- Central America
2,925
the middle country, of 7 measured · 8 members
 Mexico3,302
 Honduras2,621
Highest and lowest reading in Central America.
- South-eastern Asia
2,892
the middle country, of 8 measured · 11 members
 Vietnam3,015
 Timor-Leste2,258
Highest and lowest reading in South-eastern Asia.
- Central Asia
2,837
the middle country, of 5 measured · 5 members
 Uzbekistan3,316
 Kyrgyzstan2,762
Highest and lowest reading in Central Asia.
- Western Africa
2,812
the middle country, of 16 measured · 16 members
 Ghana3,151
 Liberia2,125
Highest and lowest reading in Western Africa.
- Southern Asia
2,705
the middle country, of 7 measured · 9 members
 Nepal2,935
 Afghanistan2,313
Highest and lowest reading in Southern Asia.
- Eastern Africa
2,434
the middle country, of 15 measured · 19 members
 Mauritius3,319Somalia1,757
Highest and lowest reading in Eastern Africa.
- Middle Africa
2,279
the middle country, of 7 measured · 9 members
 Cameroon2,851
 DR Congo2,069
Highest and lowest reading in Middle Africa.
- Australia and New Zealand
2 of 2 measured — too few for a middle: Australia, New Zealand.
Australia3,540 New Zealand3,262
Highest and lowest reading in Australia and New Zealand.
- Eastern Asia
4 of 8 measured — too few for a middle: China, Mongolia, South Korea, Taiwan.
 China3,504
 Taiwan2,974
Highest and lowest reading in Eastern Asia.
- Melanesia
4 of 5 measured — too few for a middle: Fiji, Papua New Guinea, Solomon Islands, Vanuatu.
 Vanuatu2,982Papua New Guinea2,162
Highest and lowest reading in Melanesia.
- Micronesia
1 of 7 measured — too few for a middle: Kiribati.
 Kiribati3,141
Highest and lowest reading in Micronesia.
- Northern America
2 of 4 measured — too few for a middle: Canada, United States.
United States3,962 Canada3,576
Highest and lowest reading in Northern America.
- Polynesia
1 of 7 measured — too few for a middle: Samoa.
 Samoa3,216
Highest and lowest reading in Polynesia.
- Southern Africa
4 of 5 measured — too few for a middle: Botswana, Eswatini, Namibia, South Africa.
 Botswana2,715
 Namibia2,512
Highest and lowest reading in Southern Africa.
03The whole field at once
The spread
155 countries, one dot each, on one scale — further right is a higher value. Half the countries are above 2,982; a quarter are above 3,394, and a quarter below 2,643. The bar in each row marks that continent’s middle country.
04All 158 ever measured
Every country
In order, highest value first. “=” marks a position shared with another country. Food and Agriculture Organization of the United Nations (FAO) ranks nobody on this measure; the position is derived here by ordering the published values. This is what is available, not what is eaten: it measures food at retail, before waste and before any question of how it is shared out within a country. A country can sit comfortably here and still have widespread hunger. And more is not always better — a supply far above requirement is over-nutrition.
Showing 25 of 158 countries













































































































Values for 2024. The change column compares 2024 with 2023 only; the sparkline covers the recent editions.
052001–2024 · 24 reference years
Over time
Each point is a three-year average, labelled by the middle year of its window.
- the middle country
- the middle half of countries
- the middle of the 154 countries measured every time
- each continent’s middle country
The same, year by year
| Year | Countries | Middle country | Middle half | Measured every time |
|---|---|---|---|---|
| 2024 | 155 | 2,982 | 2,643 – 3,394 | 2,991 |
| 2023 | 155 | 2,969 | 2,621 – 3,363 | 2,977 |
| 2022 | 156 | 2,963 | 2,618 – 3,354 | 2,968 |
| 2021 | 157 | 2,967 | 2,626 – 3,337 | 2,972 |
| 2020 | 157 | 2,934 | 2,613 – 3,338 | 2,952 |
| 2019 | 156 | 2,913 | 2,619 – 3,326 | 2,916 |
| 2018 | 157 | 2,893 | 2,583 – 3,284 | 2,909 |
| 2017 | 157 | 2,886 | 2,583 – 3,257 | 2,890 |
| 2016 | 157 | 2,863 | 2,566 – 3,235 | 2,875 |
| 2015 | 157 | 2,835 | 2,573 – 3,222 | 2,840 |
| 2014 | 157 | 2,844 | 2,561 – 3,223 | 2,847 |
| 2013 | 157 | 2,856 | 2,531 – 3,219 | 2,858 |
| 2012 | 156 | 2,838 | 2,508 – 3,209 | 2,861 |
| 2011 | 156 | 2,828 | 2,507 – 3,204 | 2,835 |
| 2010 | 156 | 2,808 | 2,478 – 3,187 | 2,815 |
| 2009 | 156 | 2,818 | 2,490 – 3,174 | 2,826 |
| 2008 | 156 | 2,811 | 2,450 – 3,175 | 2,819 |
| 2007 | 156 | 2,811 | 2,423 – 3,140 | 2,817 |
| 2006 | 156 | 2,772 | 2,391 – 3,108 | 2,791 |
| 2005 | 156 | 2,741 | 2,367 – 3,104 | 2,744 |
| 2004 | 156 | 2,713 | 2,334 – 3,086 | 2,724 |
| 2003 | 156 | 2,685 | 2,302 – 3,048 | 2,694 |
| 2002 | 156 | 2,667 | 2,285 – 3,032 | 2,671 |
| 2001 | 156 | 2,628 | 2,272 – 3,037 | 2,633 |
062023 → 2024
Who rose and fell
The biggest changes in value between the two newest editions — reference years recalculated in one report, not two separate publications. Places are shown second, because they also move when other countries do.
Improved most
before → after- New Zealand3,172 → 3,262 · 55th → 53rd+90
 Sri Lanka2,677 → 2,760 · 112th → 107th+83
- Mauritius3,253 → 3,319 · 52nd → 49th+66
 Latvia3,342 → 3,404 · 43rd → 36th+62
 Guinea-Bissau2,533 → 2,593 · 126th → 121st+60
155 countries were measured in both 2023 and 2024.
07Across every edition
Dietary energy supply in records
The extremes of the statistic. A record reached by more than one country names none of them.
Highest reading on record
3,962
Dietary energy supply (kcal per person per day)
Lowest reading on record
1,530
Dietary energy supply (kcal per person per day)
Biggest improvement between editions
+188
2,182 → 2,370
Biggest decline between editions
−201
2,774 → 2,573
Most improved since first measured
+1,133
2,772 → 3,905
At the top most often
11 of 24
editions, alone at the first-listed end
08The measure
About dietary energy supply
This is how many calories a day are available per person in a country's food supply, with protein availability beside it. Unlike a hunger count it applies everywhere, so it describes rich and poor countries on the same scale.
What the number is: Dietary energy supply (kcal per person per day).
What it does not measure
It measures the food available across the whole country, not what each person eats; an adequate average can hide people who go hungry, and it says nothing about diet quality.
09Where it fits
Connections
Its part in the Country Index, the statistics whose values line up most closely with it across countries, and others on the same subject.
In the Country Index
A key statistic for Food & Agriculture
“Whether the food a country produces and imports covers what its population needs to eat, measured before anyone has eaten it.”
- Edition used
- 2024 (data 2024)
- Countries
- 155
- Licence
- CC BY 4.0
Moves with
Where dietary energy supply is higher, these tend to be higher too.
- GNI per Capita (PPP)World Bank Group · 90 countries in commonρ 0.85
- Actual Individual Consumption per Capita (PPP)World Bank Group · 141 countries in commonρ 0.85
- GDP per Capita (PPP)KeyWorld Bank Group · 149 countries in commonρ 0.84
Moves against
Where dietary energy supply is higher, these tend to be lower.
- Prevalence of UndernourishmentFAO · 153 countries in commonρ −0.91
- Informal Employment RateILO · 80 countries in commonρ −0.86
- Gender Inequality IndexUNDP Human Development Report Office · 148 countries in commonρ −0.82
Rank correlation (ρ, from −1 to 1) across countries, on each statistic’s newest edition, out of 365 statistics sharing at least 80 countries with this one. Two statistics that move together do not cause each other.
10Keep reading
Explore further
The subject
The countries at either end
11Questions
Dietary energy supply: questions and answers
Which country has the highest dietary energy supply?
United States, at 3,962, among the 155 countries compared in 2024.
Which country has the lowest dietary energy supply?
Somalia, at 1,757, among the 155 countries compared in 2024.
How many countries does the Dietary Energy Supply cover?
155 in 2024, and 158 at least once across all editions. The number measured varies from 155 to 157 between editions.
What is the world average dietary energy supply?
This site does not calculate a world average, which would depend on how countries are weighted. In the middle country of the 155 compared in 2024, the figure was 2,982.
Is this Food and Agriculture Organization of the United Nations (FAO)’s own ranking?
No. Food and Agriculture Organization of the United Nations (FAO) publishes the values but ranks nobody; the position on this page is derived by Nations Inquiry by ordering the published values, and equal values share a position.
How often is the Dietary Energy Supply published?
This site holds 24 reference years, 2001–2024, all recalculated in Food and Agriculture Organization of the United Nations (FAO)’s 2026 report on one method — not 24 separate publications.
Where does the data come from, and can I download it?
From Food and Agriculture Organization of the United Nations (FAO), under CC BY 4.0. FAOSTAT's Suite of Food Security Indicators, read from the FAO's own bulk download. Every edition is on this site’s Datasets pages as a full table, and downloads as a CSV file with every value unrounded.
12Method
Sources, method and citation
Source
Dietary Energy Supply — Food and Agriculture Organization of the United Nations (FAO)
FAOSTAT's Suite of Food Security Indicators, read from the FAO's own bulk download.
Newest edition
Report year 2024Data year 2024
Cite the source as: FAO. FAOSTAT. Rome: Food and Agriculture Organization of the United Nations.
Licence: CC BY 4.0, checked 2026-09-11.
How this page reads the numbers
- Food and Agriculture Organization of the United Nations (FAO) ranks nobody on this measure. The position is derived by Nations Inquiry by ordering the published values; equal values share a position.
- Which end is better follows the publisher’s own reading of the measure.
- A country is named at an end only when it holds that value alone. Where several share it, the page says how many and names none first.
- Values are stored exactly as published and trimmed only for display. “The middle country” is the median of the countries measured, not a world average.
The file itself, column by column — where it came from, what each column holds, and every edition as a CSV — is on its dataset page.
Photographs
The countries at the top of this statistic, from their profiles: Wikimedia Commons, shown in greyscale, each used under the licence named.
- United States — Stefano Brivio, CC BY 2.0
- Belgium — Gf uip, CC BY-SA 3.0
- Ireland — derivative work: Jjtkk, CC BY-SA 2.0
Cite this page
Nations Inquiry (2026). Dietary energy supply by country: Dietary Energy Supply, data from Food and Agriculture Organization of the United Nations (FAO). https://nationsinquiry.com/statistics/dietary-energy-supply