Loading…
UN DESA Population Division · Crude Death Rate
Death rate by country
How many people die each year for every 1,000 people?
Of the 222 countries compared in 2023, Vatican City had the highest reading, 25.580, and Qatar had the lowest reading, 0.930. In the middle country the figure was 7.303. Among the 222 countries measured in every edition since 1950, the middle one moved from 18.830 to 7.303.
Part ofPeople & Population
Death rate · 2023
Context statistic

Highest of 222Vatican City
25.580012023 · values only
The highest and the lowest
The three countries with the highest values of 222 compared, the three with the lowest, and the highest on each continent. This statistic has no better end, so no country is shown as leading.
- 1
- 2

- 3

Lowest in 2023
 Qatar0.930
 United Arab Emirates0.932
 Kuwait1.782
This statistic has no better end: the two ends describe size, not success.
Highest on each continent
- Africa
 Nigeria11.740
 - Americas
- Asia
 Japan12.257
 - EuropeVatican City25.580
- Oceania
 Niue14.721
 - Every region
02Every measured country
Death rate on a map
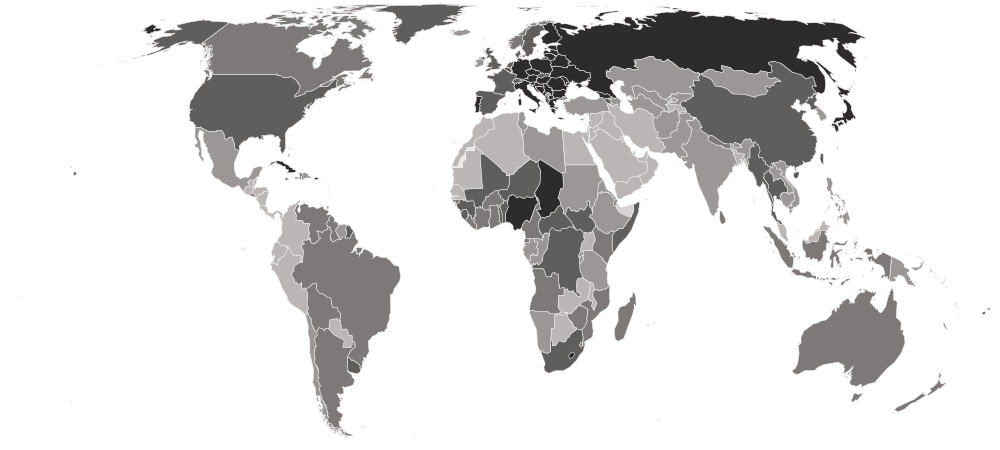
Each country is shaded by its value, in five groups holding the same number of countries. Hover a country for its value, or select it to open its profile. Below the map, each continent’s middle country.
Darker is a higher value. This statistic has no better end, so the shades describe size, not success.
- 0.930–5.724
- 5.781–6.868
- 6.893–8.071
- 8.076–9.854
- 9.942–25.580
- No reading in 2023
- Europe
10.489
the middle country, of 48 measured · 49 members
Vatican City25.580 Kosovo5.871
Highest and lowest reading in Europe.
- Americas
7.614
the middle country, of 48 measured · 48 members
United States Virgin Islands15.411 Honduras4.478
Highest and lowest reading in Americas.
- Africa
7.101
the middle country, of 54 measured · 55 members
Nigeria11.740 Algeria4.641
Highest and lowest reading in Africa.
- Oceania
6.968
the middle country, of 21 measured · 21 members
Niue14.721 French Polynesia3.649
Highest and lowest reading in Oceania.
- Asia
6.206
the middle country, of 51 measured · 52 members
Japan12.257Qatar0.930Highest and lowest reading in Asia.
- Every region
22 sub-regions, highest middle country first
- Eastern Europe
13.176
the middle country, of 10 measured · 10 members
 Bulgaria15.153
 Slovakia9.816
Highest and lowest reading in Eastern Europe.
- Southern Europe
10.844
the middle country, of 17 measured · 17 members
Vatican City25.580Kosovo5.871Highest and lowest reading in Southern Europe.
- Northern Europe
9.968
the middle country, of 12 measured · 13 members
 Latvia14.670
 Iceland6.739
Highest and lowest reading in Northern Europe.
- Western Europe
9.273
the middle country, of 9 measured · 9 members
Monaco20.971 Luxembourg6.980
Highest and lowest reading in Western Europe.
- Caribbean
8.786
the middle country, of 24 measured · 24 members
United States Virgin Islands15.411 Cayman Islands4.801
Highest and lowest reading in Caribbean.
- Western Africa
8.018
the middle country, of 16 measured · 16 members
Nigeria11.740 Cabo Verde5.059
Highest and lowest reading in Western Africa.
- Eastern Asia
7.948
the middle country, of 8 measured · 8 members
Japan12.257 Macau4.795
Highest and lowest reading in Eastern Asia.
- Southern Africa
7.700
the middle country, of 5 measured · 5 members
 Lesotho10.648
 Botswana5.724
Highest and lowest reading in Southern Africa.
- Middle Africa
7.151
the middle country, of 9 measured · 9 members
 Chad11.032
 São Tomé and Príncipe5.572
Highest and lowest reading in Middle Africa.
- Eastern Africa
7.099
the middle country, of 18 measured · 19 members
 Somalia9.835
 Uganda4.842
Highest and lowest reading in Eastern Africa.
- Micronesia
7.046
the middle country, of 7 measured · 7 members
 Palau11.495
 Northern Mariana Islands4.704
Highest and lowest reading in Micronesia.
- Polynesia
7.021
the middle country, of 7 measured · 7 members
Niue14.721French Polynesia3.649Highest and lowest reading in Polynesia.
- South America
6.863
the middle country, of 12 measured · 12 members
 Uruguay9.783
 Ecuador5.128
Highest and lowest reading in South America.
- South-eastern Asia
6.390
the middle country, of 11 measured · 11 members
 Myanmar9.153
 Singapore4.790
Highest and lowest reading in South-eastern Asia.
- Melanesia
6.271
the middle country, of 5 measured · 5 members
 Fiji9.255
 Vanuatu5.083
Highest and lowest reading in Melanesia.
- Southern Asia
6.110
the middle country, of 9 measured · 9 members
 Sri Lanka7.072
 Maldives2.338
Highest and lowest reading in Southern Asia.
- Central Asia
5.966
the middle country, of 5 measured · 5 members
 Kazakhstan6.709
 Tajikistan4.581
Highest and lowest reading in Central Asia.
- Northern Africa
5.855
the middle country, of 6 measured · 6 members
 Libya6.654Algeria4.641
Highest and lowest reading in Northern Africa.
- Western Asia
4.916
the middle country, of 18 measured · 19 members
 Georgia11.839Qatar0.930
Highest and lowest reading in Western Asia.
- Central America
4.877
the middle country, of 8 measured · 8 members
 El Salvador7.519Honduras4.478
Highest and lowest reading in Central America.
- Australia and New Zealand
2 of 2 measured — too few for a middle: Australia, New Zealand.
 New Zealand7.285
 Australia6.953
Highest and lowest reading in Australia and New Zealand.
- Northern America
4 of 4 measured — too few for a middle: Bermuda, Canada, Greenland, United States.
 Greenland9.854
 Canada7.935
Highest and lowest reading in Northern America.
03The whole field at once
The spread
222 countries, one dot each, on one scale — further right is a higher value. Half the countries are above 7.303; a quarter are above 9.362, and a quarter below 6.053. The bar in each row marks that continent’s middle country.
04All 222 ever measured
Every country
In order, highest value first. No rank or position is shown: too many countries share the same value for an order to mean anything. Neither end is better, and the top of this table is the trap. The highest readings belong largely to ageing, long-lived populations and to very small states with unusual age structures; the lowest belong to young ones, including Gulf states whose populations are mostly working-age migrants. For how long people live, read life expectancy.
Showing 25 of 222 countries











































































































































































Values for 2023. The change column compares 2023 with 2022 only; the sparkline covers the recent editions.
051950–2023 · 74 reference years
Over time
Each point is one year's estimate, 1950 to 2023, as restated by the 2024 revision. In most countries the line fell for decades as mortality at every age dropped, and in many it is now rising again for a different reason — the population is older, not less healthy.
- the middle country
- the middle half of countries
- the middle of the 222 countries measured every time
- each continent’s middle country
The same, year by year
| Year | Countries | Middle country | Middle half | Measured every time |
|---|---|---|---|---|
| 2023 | 222 | 7.303 | 6.053 – 9.362 | 7.303 |
| 2022 | 222 | 7.541 | 6.096 – 9.576 | 7.541 |
| 2021 | 222 | 8.338 | 6.681 – 10.267 | 8.338 |
| 2020 | 222 | 7.711 | 6.417 – 9.666 | 7.711 |
| 2019 | 222 | 7.408 | 6.121 – 9.363 | 7.408 |
| 2018 | 222 | 7.371 | 6.115 – 9.528 | 7.371 |
| 2017 | 222 | 7.360 | 6.067 – 9.485 | 7.360 |
| 2016 | 222 | 7.322 | 6.049 – 9.439 | 7.322 |
| 2015 | 222 | 7.455 | 6.018 – 9.539 | 7.455 |
| 2014 | 222 | 7.446 | 5.990 – 9.566 | 7.446 |
| 2013 | 222 | 7.508 | 5.925 – 9.576 | 7.508 |
| 2012 | 222 | 7.546 | 5.923 – 9.792 | 7.546 |
| 2011 | 222 | 7.529 | 5.877 – 9.765 | 7.529 |
| 2010 | 222 | 7.648 | 5.822 – 9.757 | 7.648 |
| 2009 | 222 | 7.768 | 5.897 – 9.762 | 7.768 |
| 2008 | 222 | 7.837 | 5.890 – 9.903 | 7.837 |
| 2007 | 222 | 7.961 | 5.907 – 9.986 | 7.961 |
| 2006 | 222 | 7.918 | 5.888 – 10.011 | 7.918 |
| 2005 | 222 | 8.034 | 5.904 – 10.159 | 8.034 |
| 2004 | 222 | 8.053 | 5.953 – 10.266 | 8.053 |
| 2003 | 222 | 7.951 | 5.969 – 10.388 | 7.951 |
| 2002 | 222 | 7.949 | 5.983 – 10.611 | 7.949 |
| 2001 | 222 | 8.081 | 6.106 – 10.794 | 8.081 |
| 2000 | 222 | 8.200 | 6.176 – 10.785 | 8.200 |
| 1999 | 222 | 8.390 | 6.249 – 11.088 | 8.390 |
| 1998 | 222 | 8.470 | 6.356 – 11.096 | 8.470 |
| 1997 | 222 | 8.516 | 6.147 – 11.257 | 8.516 |
| 1996 | 222 | 8.593 | 6.152 – 11.175 | 8.593 |
| 1995 | 222 | 8.625 | 6.252 – 11.335 | 8.625 |
| 1994 | 222 | 8.549 | 6.320 – 11.286 | 8.549 |
| 1993 | 222 | 8.459 | 6.378 – 11.449 | 8.459 |
| 1992 | 222 | 8.499 | 6.488 – 11.372 | 8.499 |
| 1991 | 222 | 8.541 | 6.583 – 11.347 | 8.541 |
| 1990 | 222 | 8.587 | 6.754 – 11.307 | 8.587 |
| 1989 | 222 | 8.610 | 6.769 – 11.560 | 8.610 |
| 1988 | 222 | 8.739 | 6.768 – 11.668 | 8.739 |
| 1987 | 222 | 8.752 | 6.791 – 11.768 | 8.752 |
| 1986 | 222 | 8.900 | 6.897 – 11.897 | 8.900 |
| 1985 | 222 | 9.082 | 6.935 – 12.161 | 9.082 |
| 1984 | 222 | 9.198 | 6.940 – 12.438 | 9.198 |
| 1983 | 222 | 9.450 | 7.069 – 12.454 | 9.450 |
| 1982 | 222 | 9.388 | 7.264 – 12.628 | 9.388 |
| 1981 | 222 | 9.612 | 7.309 – 12.705 | 9.612 |
| 1980 | 222 | 9.701 | 7.308 – 13.027 | 9.701 |
| 1979 | 222 | 9.750 | 7.295 – 13.010 | 9.750 |
| 1978 | 222 | 9.768 | 7.365 – 13.063 | 9.768 |
| 1977 | 222 | 9.822 | 7.486 – 13.243 | 9.822 |
| 1976 | 222 | 9.939 | 7.731 – 13.892 | 9.939 |
| 1975 | 222 | 10.141 | 7.608 – 13.884 | 10.141 |
| 1974 | 222 | 10.250 | 7.687 – 14.372 | 10.250 |
| 1973 | 222 | 10.258 | 7.919 – 14.424 | 10.258 |
| 1972 | 222 | 10.339 | 8.041 – 15.087 | 10.339 |
| 1971 | 222 | 10.526 | 8.149 – 15.429 | 10.526 |
| 1970 | 222 | 10.721 | 8.357 – 16.013 | 10.721 |
| 1969 | 222 | 11.175 | 8.320 – 16.190 | 11.175 |
| 1968 | 222 | 11.145 | 8.364 – 16.480 | 11.145 |
| 1967 | 222 | 11.206 | 8.444 – 16.752 | 11.206 |
| 1966 | 222 | 11.624 | 8.628 – 17.138 | 11.624 |
| 1965 | 222 | 11.884 | 8.731 – 17.776 | 11.884 |
| 1964 | 222 | 12.130 | 8.918 – 17.895 | 12.130 |
| 1963 | 222 | 12.657 | 9.261 – 18.605 | 12.657 |
| 1962 | 222 | 12.803 | 9.378 – 18.950 | 12.803 |
| 1961 | 222 | 13.320 | 9.431 – 19.419 | 13.320 |
| 1960 | 222 | 13.749 | 9.760 – 19.926 | 13.749 |
| 1959 | 222 | 14.136 | 9.980 – 20.327 | 14.136 |
| 1958 | 222 | 14.523 | 9.988 – 20.632 | 14.523 |
| 1957 | 222 | 14.875 | 10.488 – 21.192 | 14.875 |
| 1956 | 222 | 15.331 | 10.792 – 21.540 | 15.331 |
| 1955 | 222 | 15.744 | 11.048 – 22.160 | 15.744 |
| 1954 | 222 | 16.273 | 11.201 – 22.816 | 16.273 |
| 1953 | 222 | 17.009 | 11.673 – 23.352 | 17.009 |
| 1952 | 222 | 17.582 | 11.955 – 23.911 | 17.582 |
| 1951 | 222 | 18.167 | 12.295 – 24.367 | 18.167 |
| 1950 | 222 | 18.830 | 12.380 – 24.410 | 18.830 |
062022 → 2023
Who rose and fell
The biggest changes in value between the two newest editions — reference years recalculated in one report, not two separate publications. Places are shown second, because they also move when other countries do.
Rose most
before → after Palestine2.992 → 7.198+4.206
- Libya4.808 → 6.654+1.846
- Vatican City23.953 → 25.580+1.627
 Moldova13.070 → 13.606+0.536
 China7.717 → 8.213+0.496
Fell most
before → after Central African Republic55.126 → 9.419−45.707
- Somalia12.812 → 9.835−2.977
- Monaco23.496 → 20.971−2.525
 Serbia15.850 → 13.868−1.982
- Bulgaria16.924 → 15.153−1.771
222 countries were measured in both 2022 and 2023.
07Across every edition
Death rate in records
The extremes of the statistic. A record reached by more than one country names none of them.
Highest reading on record
153.963
Deaths per 1,000 population
Lowest reading on record
0.841
Deaths per 1,000 population
Biggest rise between editions
+135.466
18.497 → 153.963
Biggest fall between editions
−135.795
153.963 → 18.168
Biggest change since first measured
+20.429
5.151 → 25.580
Highest most often
26 of 74
editions, alone at the first-listed end
08The measure
About death rate
The crude death rate is the number of people who die in a year for every 1,000 people living in a country. It is not a measure of how healthy a country is: because it takes no account of age, an old population records more deaths per head than a young one even where each person's chance of dying is lower.
What the number is: Deaths per 1,000 population.
What it does not measure
It is not a measure of health. It rises as a population grows older, so a long-lived country can have a higher death rate than a country where people die younger.
09Where it fits
Connections
Its part in the Country Index, the statistics whose values line up most closely with it across countries, and others on the same subject.
In the Country Index
Context, with no vote
This statistic is published in full under People & Population, but does not help decide any Country Index standing.
Moves with
Where death rate is higher, these tend to be higher too.
- Population Aged 65 and OverUN DESA Population Division · 222 countries in commonρ 0.56
- Upper Secondary AttainmentUIS · 95 countries in commonρ 0.53
- Median Age of the PopulationUN DESA Population Division · 222 countries in commonρ 0.49
Moves against
Where death rate is higher, these tend to be lower.
- Population Growth RateUN DESA Population Division · 222 countries in commonρ −0.52
- Gender Social Norms IndexUNDP Human Development Report Office · 80 countries in commonρ −0.51
- Informal Employment RateILO · 97 countries in commonρ −0.48
Rank correlation (ρ, from −1 to 1) across countries, on each statistic’s newest edition, out of 190 statistics sharing at least 80 countries with this one. Two statistics that move together do not cause each other.
10Keep reading
Explore further
The subject
The countries at either end
11Questions
Death rate: questions and answers
Which country has the highest death rate?
Vatican City, at 25.580, among the 222 countries compared in 2023.
Which country has the lowest death rate?
Qatar, at 0.930, among the 222 countries compared in 2023.
How many countries does the Crude Death Rate cover?
222 in 2023.
What is the world average death rate?
This site does not calculate a world average, which would depend on how countries are weighted. In the middle country of the 222 compared in 2023, the figure was 7.303.
Is this UN DESA Population Division’s own ranking?
No ranking is shown. UN DESA Population Division publishes values only, and too many countries share the same value for an ordering to mean anything, so none is derived.
How often is the Crude Death Rate published?
This site holds 74 reference years, 1950–2023, all recalculated in UN DESA Population Division’s 2024 report on one method — not 74 separate publications.
Where does the data come from, and can I download it?
From UN DESA Population Division, under CC BY 3.0 IGO. From World Population Prospects 2024, read from the Population Division's own CSV download. Projections are excluded. Every edition is on this site’s Datasets pages as a full table, and downloads as a CSV file with every value unrounded.
12Method
Sources, method and citation
Source
Crude Death Rate — UN DESA Population Division
From World Population Prospects 2024, read from the Population Division's own CSV download. Projections are excluded.
Newest edition
Report year 2023Data year 2023
Cite the source as: United Nations, Department of Economic and Social Affairs, Population Division. World Population Prospects 2024. New York: United Nations.
Licence: CC BY 3.0 IGO, checked 2026-09-26.
How this page reads the numbers
- No rank or position is shown: UN DESA Population Division publishes values only, and too many countries share the same value for an ordering to mean anything.
- This statistic has no better end, so the page describes higher and lower values and never calls a country a leader.
- A country is named at an end only when it holds that value alone. Where several share it, the page says how many and names none first.
- Values are stored exactly as published and trimmed only for display. “The middle country” is the median of the countries measured, not a world average.
The file itself, column by column — where it came from, what each column holds, and every edition as a CSV — is on its dataset page.
Cite this page
Nations Inquiry (2026). Death rate by country: Crude Death Rate, data from UN DESA Population Division. https://nationsinquiry.com/statistics/crude-death-rate