Lenka Dražanová, European University Institute (Migration Policy Centre) · Historical Index of Ethnic Fractionalization
Ethnic diversity by country
How likely are two people chosen at random to belong to different ethnic groups?
Of the 156 countries compared in 2013, Liberia had the highest reading, 0.889, and Japan had the lowest reading, 0.019. In the middle country the figure was 0.444. Among the 63 countries measured in every edition since 1945, the middle one moved from 0.227 to 0.367.
Share
Part ofPeople & Population
Ethnic diversity · 2013
Context statistic

Highest of 156Liberia
0.889012013 · values only
The highest and the lowest
The three countries with the highest values of 156 compared, the three with the lowest, and the highest on each continent. This statistic has no better end, so no country is shown as leading.
- 1
- 2

- 3

Lowest in 2013
 Japan0.019
 North Korea0.020
 Bangladesh0.025
This statistic has no better end: the two ends describe size, not success.
02Every measured country
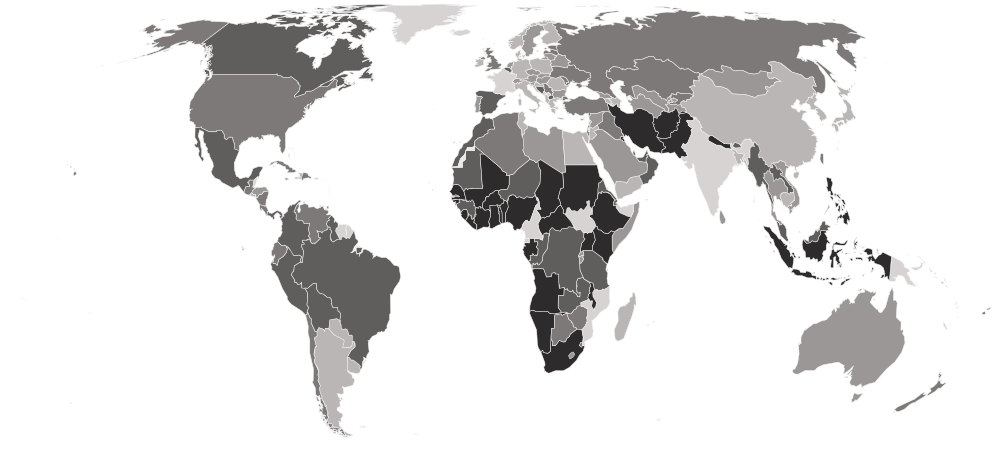
Ethnic diversity on a map
Each country is shaded by its value, in five groups holding the same number of countries. Hover a country for its value, or select it to open its profile. Below the map, each continent’s middle country.
Darker is a higher value. This statistic has no better end, so the shades describe size, not success.
- 0.019–0.207
- 0.210–0.367
- 0.370–0.547
- 0.559–0.730
- 0.731–0.889
- No reading in 2013
- Africa
0.720
the middle country, of 48 measured · 55 members
Liberia0.889 Tunisia0.034
Highest and lowest reading in Africa.
- Americas
0.520
the middle country, of 25 measured · 48 members
 Canada0.730
 Haiti0.105
Highest and lowest reading in Americas.
- Asia
0.373
the middle country, of 45 measured · 52 members
 Nepal0.860Japan0.019
Highest and lowest reading in Asia.
- Europe
0.260
the middle country, of 34 measured · 49 members
 Spain0.669
 Poland0.069
Highest and lowest reading in Europe.
- Oceania
4 of 21 measured — too few for a middle: Australia, Fiji, New Zealand, Solomon Islands.
 Fiji0.528
 Solomon Islands0.097
Highest and lowest reading in Oceania.
- Every region
20 sub-regions, highest middle country first
- Middle Africa
0.784
the middle country, of 6 measured · 9 members
 Chad0.855
 DR Congo0.700
Highest and lowest reading in Middle Africa.
- Western Africa
0.763
the middle country, of 16 measured · 16 members
Liberia0.889 Cabo Verde0.442
Highest and lowest reading in Western Africa.
- Southern Asia
0.743
the middle country, of 7 measured · 9 members
Nepal0.860Bangladesh0.025Highest and lowest reading in Southern Asia.
- Eastern Africa
0.591
the middle country, of 15 measured · 19 members
Uganda0.883 Comoros0.054
Highest and lowest reading in Eastern Africa.
- South-eastern Asia
0.580
the middle country, of 10 measured · 11 members
 Philippines0.807
 Cambodia0.158
Highest and lowest reading in South-eastern Asia.
- South America
0.528
the middle country, of 11 measured · 12 members
 Guyana0.695
 Argentina0.158
Highest and lowest reading in South America.
- Central America
0.511
the middle country, of 7 measured · 8 members
 Panama0.612
 El Salvador0.165
Highest and lowest reading in Central America.
- Caribbean
0.453
the middle country, of 5 measured · 24 members
 Trinidad and Tobago0.655Haiti0.105
Highest and lowest reading in Caribbean.
- Southern Africa
0.395
the middle country, of 5 measured · 5 members
 South Africa0.856
 Lesotho0.313
Highest and lowest reading in Southern Africa.
- Central Asia
0.367
the middle country, of 5 measured · 5 members
 Kazakhstan0.538
 Turkmenistan0.255
Highest and lowest reading in Central Asia.
- Western Asia
0.367
the middle country, of 17 measured · 19 members
 Kuwait0.765
 Jordan0.044
Highest and lowest reading in Western Asia.
- Western Europe
0.354
the middle country, of 5 measured · 9 members
 Belgium0.592
 Germany0.189
Highest and lowest reading in Western Europe.
- Northern Africa
0.316
the middle country, of 6 measured · 6 members
 Sudan0.746Tunisia0.034
Highest and lowest reading in Northern Africa.
- Eastern Europe
0.275
the middle country, of 10 measured · 10 members
 Moldova0.427Poland0.069
Highest and lowest reading in Eastern Europe.
- Southern Europe
0.239
the middle country, of 10 measured · 17 members
Spain0.669 Italy0.110
Highest and lowest reading in Southern Europe.
- Northern Europe
0.219
the middle country, of 9 measured · 13 members
 Latvia0.547
 Finland0.138
Highest and lowest reading in Northern Europe.
- Eastern Asia
0.143
the middle country, of 6 measured · 8 members
 Taiwan0.373Japan0.019
Highest and lowest reading in Eastern Asia.
- Australia and New Zealand
2 of 2 measured — too few for a middle: Australia, New Zealand.
 New Zealand0.485
 Australia0.276
Highest and lowest reading in Australia and New Zealand.
- Melanesia
2 of 5 measured — too few for a middle: Fiji, Solomon Islands.
Fiji0.528Solomon Islands0.097Highest and lowest reading in Melanesia.
- Northern America
2 of 4 measured — too few for a middle: Canada, United States.
Canada0.730 United States0.527
Highest and lowest reading in Northern America.
03The whole field at once
The spread
156 countries, one dot each, on one scale — further right is a higher value. Half the countries are above 0.444; a quarter are above 0.687, and a quarter below 0.231. The bar in each row marks that continent’s middle country.
04All 156 ever measured
Every country
In order, highest value first. No rank or position is shown: too many countries share the same value for an order to mean anything. Neither end is better: a high figure means many groups and a low one a population mostly of one group, and neither is a success or a failure. Groups are counted by ethnicity as the sources recorded it — a definition that differs between countries and has changed over time.
Showing 25 of 156 countries











































































































Values for 2013. The change column compares 2013 with 2012 only; the sparkline covers the recent editions.
051945–2013 · 69 reference years
Over time
Each point is one year from 1945 to 2013. The author's group shares are interpolated between sources, so the line moves smoothly and rarely steps, even when borders changed, and the series has not been extended past 2013.
- the middle country
- the middle half of countries
- the middle of the 63 countries measured every time
- each continent’s middle country
The same, year by year
| Year | Countries | Middle country | Middle half | Measured every time |
|---|---|---|---|---|
| 2013 | 156 | 0.444 | 0.231 – 0.687 | 0.367 |
| 2012 | 156 | 0.444 | 0.227 – 0.688 | 0.364 |
| 2011 | 156 | 0.443 | 0.225 – 0.689 | 0.361 |
| 2010 | 156 | 0.446 | 0.223 – 0.689 | 0.358 |
| 2009 | 156 | 0.447 | 0.221 – 0.690 | 0.355 |
| 2008 | 156 | 0.448 | 0.220 – 0.689 | 0.355 |
| 2007 | 156 | 0.444 | 0.216 – 0.689 | 0.356 |
| 2006 | 156 | 0.443 | 0.215 – 0.688 | 0.357 |
| 2005 | 156 | 0.442 | 0.216 – 0.687 | 0.358 |
| 2004 | 156 | 0.444 | 0.215 – 0.686 | 0.358 |
| 2003 | 156 | 0.441 | 0.212 – 0.685 | 0.359 |
| 2002 | 156 | 0.440 | 0.211 – 0.683 | 0.360 |
| 2001 | 155 | 0.444 | 0.210 – 0.677 | 0.361 |
| 2000 | 155 | 0.442 | 0.209 – 0.677 | 0.358 |
| 1999 | 155 | 0.440 | 0.208 – 0.676 | 0.356 |
| 1998 | 155 | 0.439 | 0.212 – 0.676 | 0.354 |
| 1997 | 155 | 0.438 | 0.211 – 0.675 | 0.351 |
| 1996 | 155 | 0.437 | 0.211 – 0.674 | 0.349 |
| 1995 | 155 | 0.436 | 0.210 – 0.671 | 0.347 |
| 1994 | 155 | 0.441 | 0.209 – 0.670 | 0.345 |
| 1993 | 155 | 0.445 | 0.208 – 0.670 | 0.342 |
| 1992 | 152 | 0.455 | 0.203 – 0.671 | 0.335 |
| 1991 | 151 | 0.462 | 0.201 – 0.671 | 0.328 |
| 1990 | 130 | 0.461 | 0.190 – 0.707 | 0.322 |
| 1989 | 129 | 0.455 | 0.190 – 0.706 | 0.315 |
| 1988 | 129 | 0.458 | 0.189 – 0.705 | 0.309 |
| 1987 | 129 | 0.460 | 0.188 – 0.705 | 0.303 |
| 1986 | 129 | 0.463 | 0.188 – 0.704 | 0.296 |
| 1985 | 129 | 0.465 | 0.189 – 0.703 | 0.290 |
| 1984 | 129 | 0.462 | 0.184 – 0.703 | 0.287 |
| 1983 | 129 | 0.457 | 0.184 – 0.702 | 0.285 |
| 1982 | 129 | 0.452 | 0.184 – 0.701 | 0.282 |
| 1981 | 129 | 0.447 | 0.182 – 0.701 | 0.280 |
| 1980 | 129 | 0.442 | 0.180 – 0.700 | 0.277 |
| 1979 | 129 | 0.437 | 0.178 – 0.699 | 0.275 |
| 1978 | 129 | 0.431 | 0.176 – 0.699 | 0.272 |
| 1977 | 128 | 0.445 | 0.185 – 0.700 | 0.269 |
| 1976 | 127 | 0.426 | 0.181 – 0.701 | 0.261 |
| 1975 | 126 | 0.444 | 0.176 – 0.703 | 0.259 |
| 1974 | 123 | 0.458 | 0.180 – 0.700 | 0.258 |
| 1973 | 122 | 0.438 | 0.174 – 0.694 | 0.257 |
| 1972 | 122 | 0.438 | 0.173 – 0.695 | 0.257 |
| 1971 | 122 | 0.439 | 0.170 – 0.697 | 0.255 |
| 1970 | 118 | 0.440 | 0.168 – 0.700 | 0.253 |
| 1969 | 117 | 0.429 | 0.164 – 0.704 | 0.251 |
| 1968 | 117 | 0.431 | 0.163 – 0.703 | 0.248 |
| 1967 | 115 | 0.434 | 0.162 – 0.707 | 0.246 |
| 1966 | 115 | 0.436 | 0.158 – 0.709 | 0.244 |
| 1965 | 112 | 0.425 | 0.151 – 0.719 | 0.241 |
| 1964 | 110 | 0.425 | 0.147 – 0.716 | 0.239 |
| 1963 | 108 | 0.399 | 0.137 – 0.689 | 0.237 |
| 1962 | 107 | 0.393 | 0.131 – 0.683 | 0.234 |
| 1961 | 103 | 0.406 | 0.122 – 0.683 | 0.234 |
| 1960 | 100 | 0.394 | 0.117 – 0.659 | 0.236 |
| 1959 | 81 | 0.256 | 0.104 – 0.570 | 0.238 |
| 1958 | 81 | 0.253 | 0.105 – 0.569 | 0.241 |
| 1957 | 80 | 0.249 | 0.106 – 0.559 | 0.243 |
| 1956 | 78 | 0.247 | 0.103 – 0.531 | 0.246 |
| 1955 | 75 | 0.245 | 0.099 – 0.528 | 0.245 |
| 1954 | 75 | 0.243 | 0.098 – 0.528 | 0.242 |
| 1953 | 74 | 0.242 | 0.097 – 0.518 | 0.239 |
| 1952 | 73 | 0.237 | 0.095 – 0.524 | 0.237 |
| 1951 | 73 | 0.238 | 0.095 – 0.526 | 0.238 |
| 1950 | 72 | 0.240 | 0.087 – 0.528 | 0.238 |
| 1949 | 72 | 0.239 | 0.086 – 0.528 | 0.235 |
| 1948 | 70 | 0.238 | 0.072 – 0.529 | 0.233 |
| 1947 | 65 | 0.242 | 0.092 – 0.556 | 0.231 |
| 1946 | 64 | 0.236 | 0.084 – 0.538 | 0.229 |
| 1945 | 63 | 0.227 | 0.077 – 0.528 | 0.227 |
062012 → 2013
Who rose and fell
The biggest changes in value between the two newest editions — reference years recalculated in one report, not two separate publications. Places are shown second, because they also move when other countries do.
Rose most
before → after Portugal0.202 → 0.220+0.018
 Netherlands0.338 → 0.354+0.016
- Australia0.264 → 0.276+0.012
 Madagascar0.183 → 0.194+0.011
 South Korea0.084 → 0.095+0.011
Fell most
before → after Timor-Leste0.814 → 0.802−0.012
- Kazakhstan0.547 → 0.538−0.009
 Kyrgyzstan0.496 → 0.487−0.009
 Tajikistan0.376 → 0.367−0.009
- Turkmenistan0.263 → 0.255−0.008
156 countries were measured in both 2012 and 2013.
07Across every edition
Ethnic diversity in records
The extremes of the statistic. A record reached by more than one country names none of them.
Highest reading on record
0.890
Ethnic fractionalization index (0–1): the probability that two randomly drawn people belong to different ethnic groups
Lenka Dražanová, European University Institute (Migration Policy Centre) · 1975
Lowest reading on record
Reached 45 times by 2 countries — shared, so no holder is named
0.000
Ethnic fractionalization index (0–1): the probability that two randomly drawn people belong to different ethnic groups
Biggest rise between editions
+0.018
0.202 → 0.220
Lenka Dražanová, European University Institute (Migration Policy Centre) · 2012 → 2013
Biggest fall between editions
−0.016
0.495 → 0.479
Lenka Dražanová, European University Institute (Migration Policy Centre) · 1998 → 1999
Biggest change since first measured
+0.508
0.089 → 0.597
Lenka Dražanová, European University Institute (Migration Policy Centre) · 1945 → 2013
Highest most often
64 of 69
editions, alone at the first-listed end
Lenka Dražanová, European University Institute (Migration Policy Centre) · 1945–2013
08The measure
About ethnic diversity
The Historical Index of Ethnic Fractionalization measures how ethnically diverse a country's population is: the chance that two people chosen at random belong to different ethnic groups. Compiled by Lenka Dražanová at the European University Institute, it runs from 0, where everyone belongs to one group, towards 1, where the population is split among many small groups, year by year from 1945 to 2013.
What the number is: Ethnic fractionalization index (0–1): the probability that two randomly drawn people belong to different ethnic groups.
09Where it fits
Connections
Its part in the Country Index, the statistics whose values line up most closely with it across countries, and others on the same subject.
In the Country Index
Context, with no vote
This statistic is published in full under People & Population, but does not help decide any Country Index standing.
Moves with
Where ethnic diversity is higher, these tend to be higher too.
- Multidimensional Poverty MeasureWorld Bank Group · 118 countries in commonρ 0.57
- Global Multidimensional Poverty IndexOPHI · 86 countries in commonρ 0.52
- Coefficient of Human InequalityUNDP Human Development Report Office · 141 countries in commonρ 0.51
Moves against
Where ethnic diversity is higher, these tend to be lower.
- Planetary pressures-adjusted HDIUNDP Human Development Report Office · 142 countries in commonρ −0.55
- Completeness of Birth RegistrationUNICEF · 138 countries in commonρ −0.51
- Population Aged 65 and OverUN DESA Population Division · 156 countries in commonρ −0.50
Rank correlation (ρ, from −1 to 1) across countries, on each statistic’s newest edition, out of 367 statistics sharing at least 80 countries with this one. Two statistics that move together do not cause each other.
10Keep reading
Explore further
The subject
The countries at either end
11Questions
Ethnic diversity: questions and answers
Which country has the highest ethnic diversity?
Liberia, at 0.889, among the 156 countries compared in 2013.
Which country has the lowest ethnic diversity?
Japan, at 0.019, among the 156 countries compared in 2013.
How many countries does the Historical Index of Ethnic Fractionalization cover?
156 in 2013. The number measured varies from 63 to 156 between editions.
What is the world average ethnic diversity?
This site does not calculate a world average, which would depend on how countries are weighted. In the middle country of the 156 compared in 2013, the figure was 0.444.
Is this Lenka Dražanová, European University Institute (Migration Policy Centre)’s own ranking?
No ranking is shown. Lenka Dražanová, European University Institute (Migration Policy Centre) publishes values only, and too many countries share the same value for an ordering to mean anything, so none is derived.
How often is the Historical Index of Ethnic Fractionalization published?
This site holds 69 reference years, 1945–2013, all recalculated in Lenka Dražanová, European University Institute (Migration Policy Centre)’s 2020 report on one method — not 69 separate publications.
Where does the data come from, and can I download it?
From Lenka Dražanová, European University Institute (Migration Policy Centre), under CC0 1.0. From the author's own Harvard Dataverse deposit, released in 2020 and dedicated to the public domain (CC0). The index is the author's, computed from group shares compiled by the Cline Center's Composition of Religious and Ethnic Groups project at the University of Illinois; the group shares themselves are not republished here. Every edition is on this site’s Datasets pages as a full table, and downloads as a CSV file with every value unrounded.
12Method
Sources, method and citation
Source
Historical Index of Ethnic Fractionalization — Lenka Dražanová, European University Institute (Migration Policy Centre)
From the author's own Harvard Dataverse deposit, released in 2020 and dedicated to the public domain (CC0). The index is the author's, computed from group shares compiled by the Cline Center's Composition of Religious and Ethnic Groups project at the University of Illinois; the group shares themselves are not republished here.
Newest edition
Report year 2013Data year 2013
Cite the source as: Dražanová, Lenka (2020). "Introducing the Historical Index of Ethnic Fractionalization (HIEF) Dataset: Accounting for Longitudinal Changes in Ethnic Diversity." Journal of Open Humanities Data 6: 6. https://doi.org/10.5334/johd.16. Data: Harvard Dataverse, doi:10.7910/DVN/4JQRCL, version 2.0.
Licence: CC0 1.0, checked 2026-10-03.
How this page reads the numbers
- No rank or position is shown: Lenka Dražanová, European University Institute (Migration Policy Centre) publishes values only, and too many countries share the same value for an ordering to mean anything.
- This statistic has no better end, so the page describes higher and lower values and never calls a country a leader.
- A country is named at an end only when it holds that value alone. Where several share it, the page says how many and names none first.
- Values are stored exactly as published and trimmed only for display. “The middle country” is the median of the countries measured, not a world average.
The file itself, column by column — where it came from, what each column holds, and every edition as a CSV — is on its dataset page.
Cite this page
Nations Inquiry (2026). Ethnic diversity by country: Historical Index of Ethnic Fractionalization, data from Lenka Dražanová, European University Institute (Migration Policy Centre). https://nationsinquiry.com/statistics/ethnic-fractionalization