OPHI · Global Multidimensional Poverty Index
Multidimensional Poverty Index by country
How many people are deprived in health, education and living standards at once?
Of the 103 countries compared in the 2025 edition, Serbia had the lowest reading, 0.00043, and Chad had the highest reading, 0.51701. In the middle country the figure was 0.04792. Among the 84 countries measured in every edition since 2018, the middle one moved from 0.14030 to 0.07643. 6 readings from before 2015 are listed but not compared.
Share
Part ofHealth & WellbeingDevelopment & Human CapitalPoverty & Inequality
Multidimensional Poverty Index · the 2025 edition
Context statistic

Lowest of 103Serbia
0.0004301the 2025 edition · position · derived
Who leads
The three countries at the lowest end of 103 compared, the three at the other end, and the first on each continent.
 1
Photo: Lošmi derivative work: Jjtkk · CC BY-SA 3.0, greyscale
 2
Photo: * Original : Matthew Hadley (nickname diff_sky) derivative work: Ximonic , Simo Räsänen derivative work: Inkey · CC BY 1.0, greyscale
 3
Photo: Alexander Naumov derivative work: Inkey · CC BY 3.0, greyscale
Highest in the 2025 edition
 Chad0.51701
 Niger0.47032
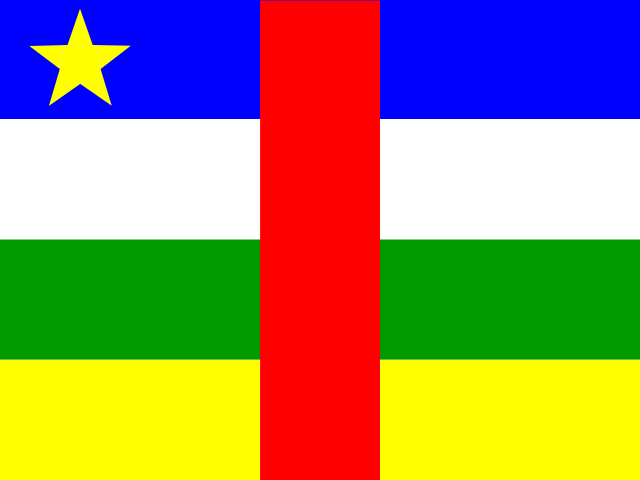 Central African Republic0.46135
Where a country sits says how it compares with the others measured, and nothing about why.
Lowest on each continent
- Africa
 Seychelles0.00296
- Americas
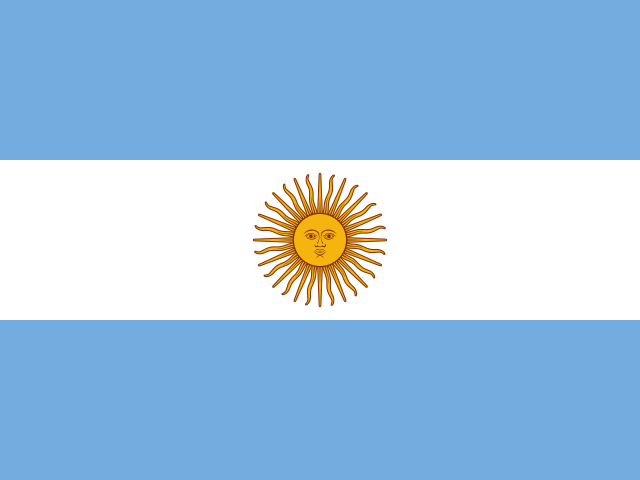 Argentina0.00147
- Asia
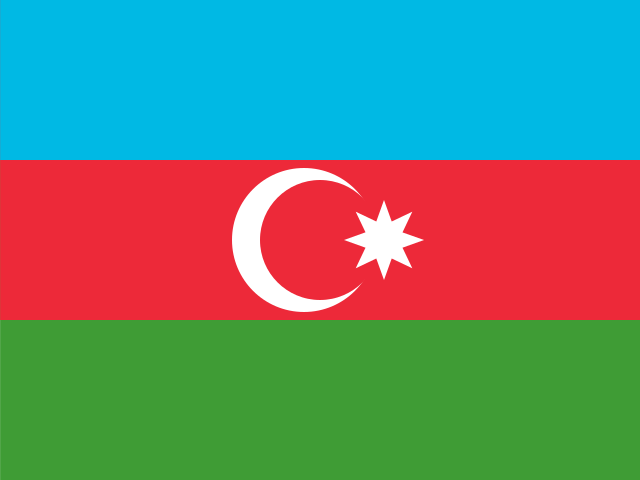 Azerbaijan0.00066
- EuropeSerbia0.00043
4 of 49 measured
- Oceania
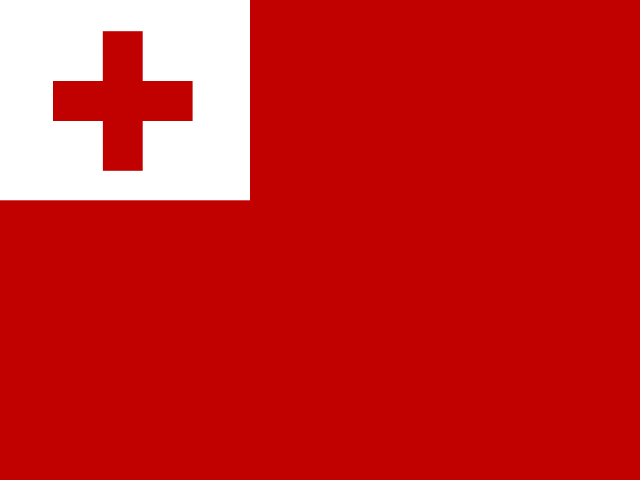 Tonga0.00334
- Every region
02Every measured country
Multidimensional Poverty Index on a map
Each country is shaded by its value, in five groups holding the same number of countries. Hover a country for its value, or select it to open its profile. Below the map, each continent’s middle country.
Darker is a lower value — the better end.
- 0.23206–0.51701
- 0.10605–0.23169
- 0.02317–0.08520
- 0.00490–0.02190
- 0.00043–0.00344
- Hatched: a reading from before 2015, listed but not compared (6)
- No reading in the 2025 edition (10 measured in an earlier edition)
- Asia
0.01579
the middle country, of 29 measured · 52 members
Azerbaijan0.00066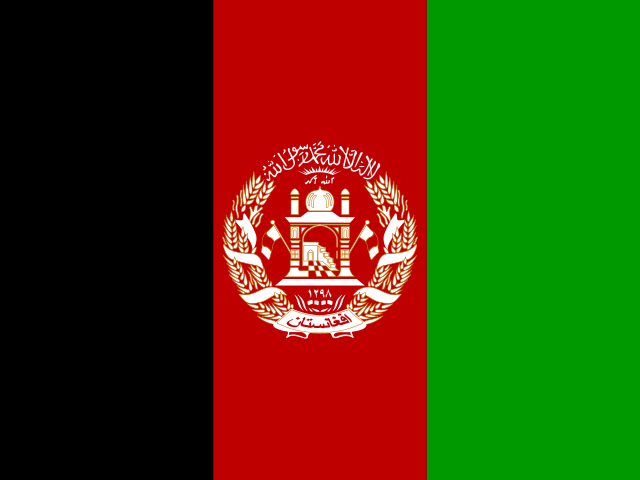 Afghanistan0.36031
Lowest and highest reading in Asia.
- Americas
0.01635
the middle country, of 19 measured · 48 members
Argentina0.00147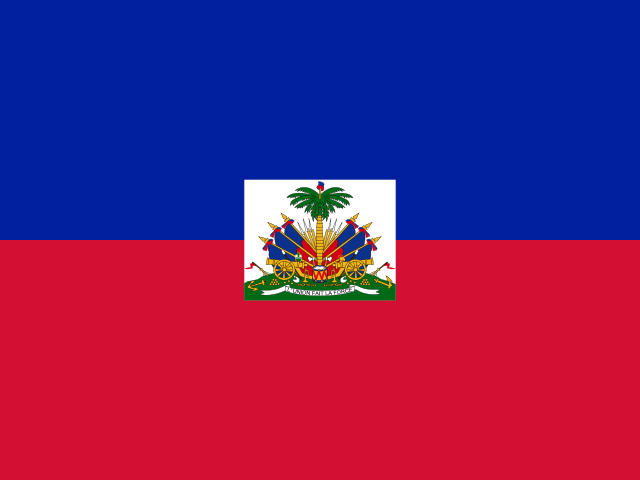 Haiti0.19959
Lowest and highest reading in Americas.
- Oceania
0.02584
the middle country, of 8 measured · 21 members
Tonga0.00334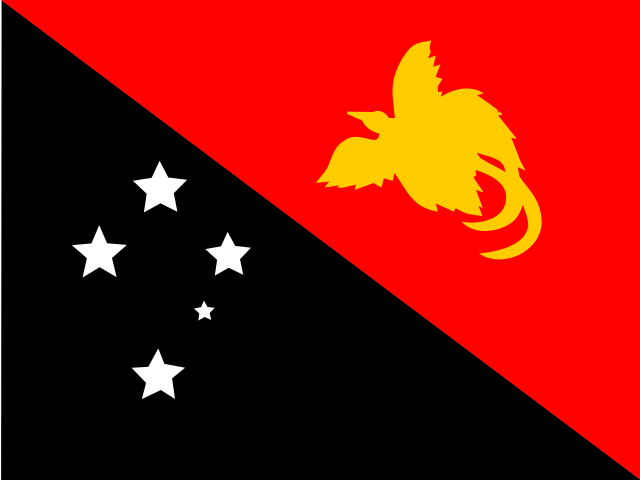 Papua New Guinea0.26329
Lowest and highest reading in Oceania.
- Africa
0.23100
the middle country, of 43 measured · 55 members
Seychelles0.00296Chad0.51701Lowest and highest reading in Africa.
- Europe
4 of 49 measured — too few for a middle: Albania, Montenegro, North Macedonia, Serbia.
Serbia0.00043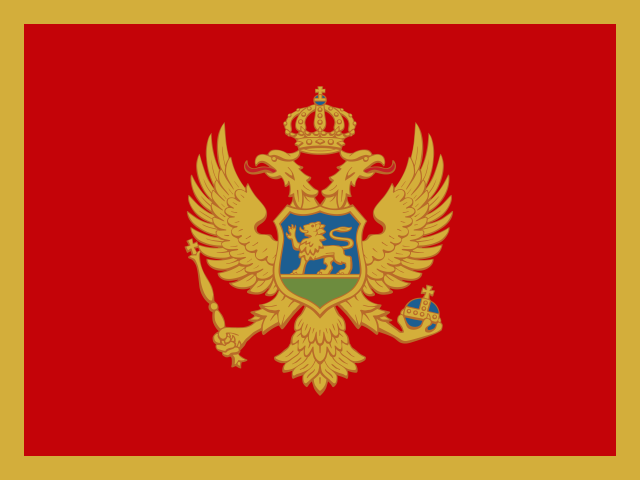 Montenegro0.00490
Lowest and highest reading in Europe.
- Every region
17 sub-regions, lowest middle country first
- Western Asia
0.00198
the middle country, of 7 measured · 19 members
Azerbaijan0.00066 Yemen0.18784
Lowest and highest reading in Western Asia.
- Central Asia
0.00342
the middle country, of 5 measured · 5 members
 Turkmenistan0.00085
 Tajikistan0.02901
Lowest and highest reading in Central Asia.
- Caribbean
0.00879
the middle country, of 5 measured · 24 members
 Trinidad and Tobago0.00207Haiti0.19959
Lowest and highest reading in Caribbean.
- South America
0.01635
the middle country, of 9 measured · 12 members
Argentina0.00147 Bolivia0.02317
Lowest and highest reading in South America.
- Central America
0.01989
the middle country, of 5 measured · 8 members
 Costa Rica0.00201
 Guatemala0.13352
Lowest and highest reading in Central America.
- South-eastern Asia
0.04308
the middle country, of 8 measured · 11 members
 Thailand0.00182
 Timor-Leste0.22151
Lowest and highest reading in South-eastern Asia.
- Southern Asia
0.06766
the middle country, of 8 measured · 9 members
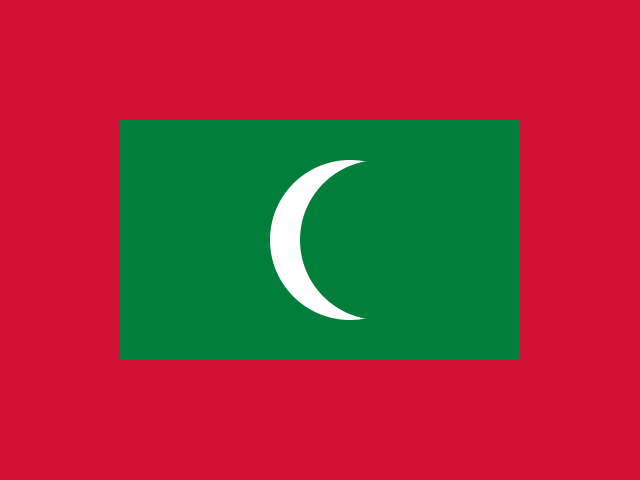 Maldives0.00265Afghanistan0.36031
Lowest and highest reading in Southern Asia.
- Eastern Africa
0.23110
the middle country, of 13 measured · 19 members
Seychelles0.00296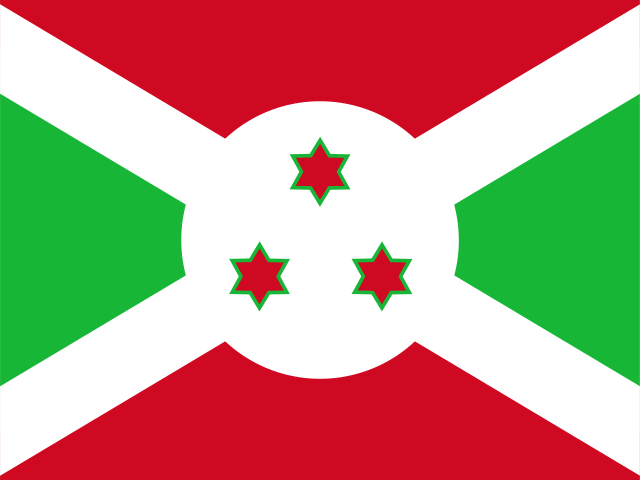 Burundi0.40886
Lowest and highest reading in Eastern Africa.
- Middle Africa
0.25725
the middle country, of 8 measured · 9 members
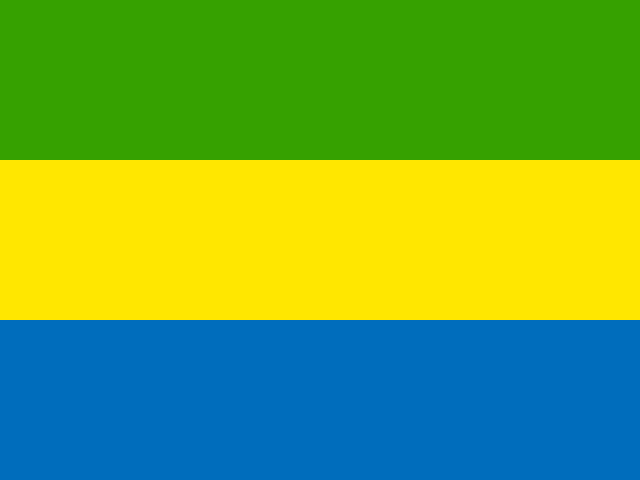 Gabon0.03666Chad0.51701
Lowest and highest reading in Middle Africa.
- Western Africa
0.28951
the middle country, of 15 measured · 16 members
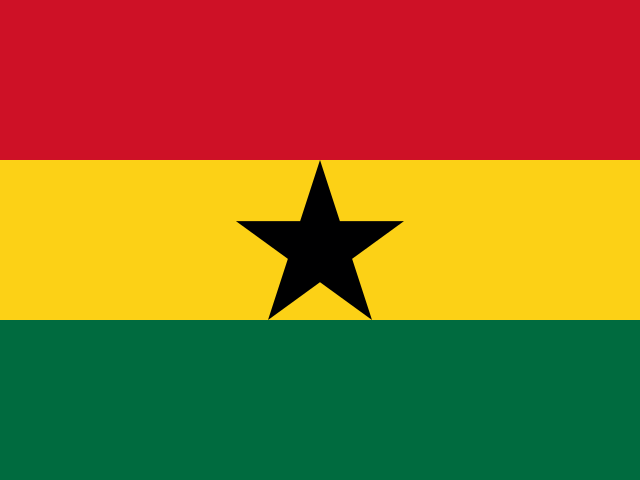 Ghana0.11278Niger0.47032
Lowest and highest reading in Western Africa.
- Eastern Asia
1 of 8 measured — too few for a middle: Mongolia.
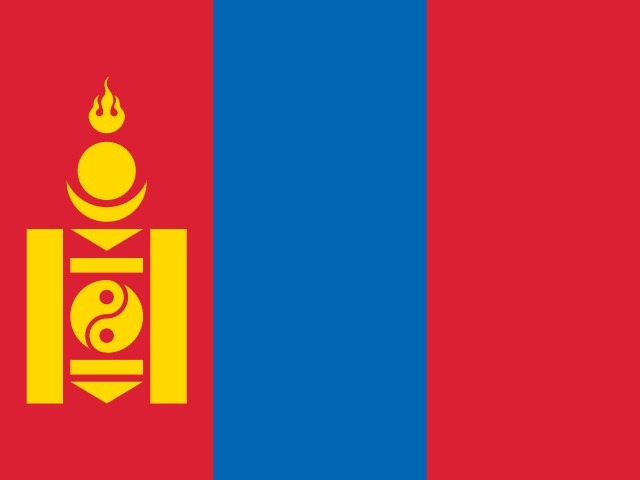 Mongolia0.02813
Lowest and highest reading in Eastern Asia.
- Melanesia
3 of 5 measured — too few for a middle: Fiji, Papua New Guinea, Vanuatu.
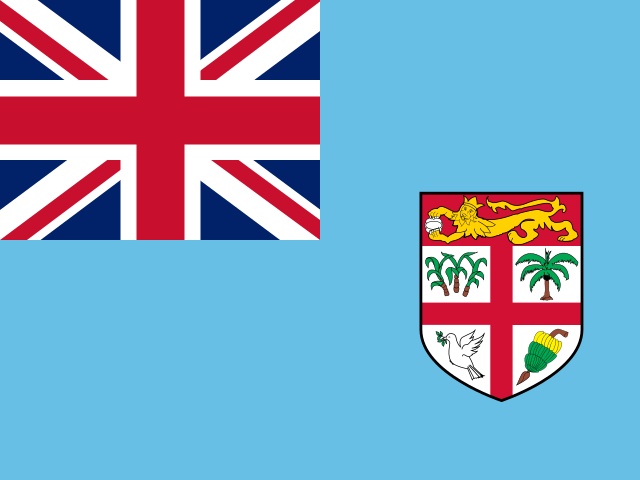 Fiji0.00576Papua New Guinea0.26329
Lowest and highest reading in Melanesia.
- Micronesia
2 of 7 measured — too few for a middle: Kiribati, Nauru.
 Nauru0.02708
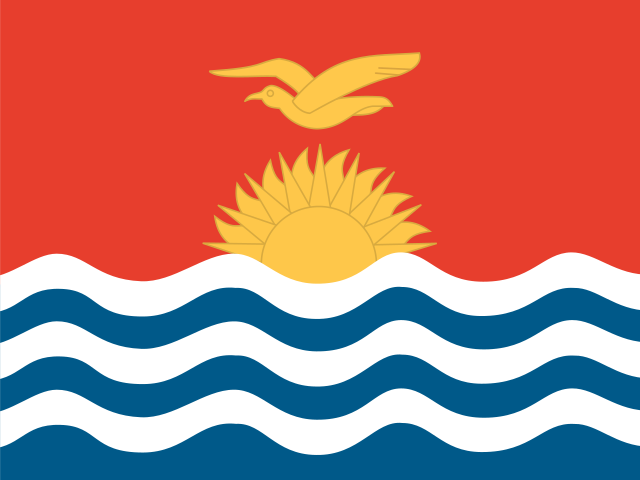 Kiribati0.08016
Lowest and highest reading in Micronesia.
- Northern Africa
3 of 6 measured — too few for a middle: Algeria, Morocco, Tunisia.
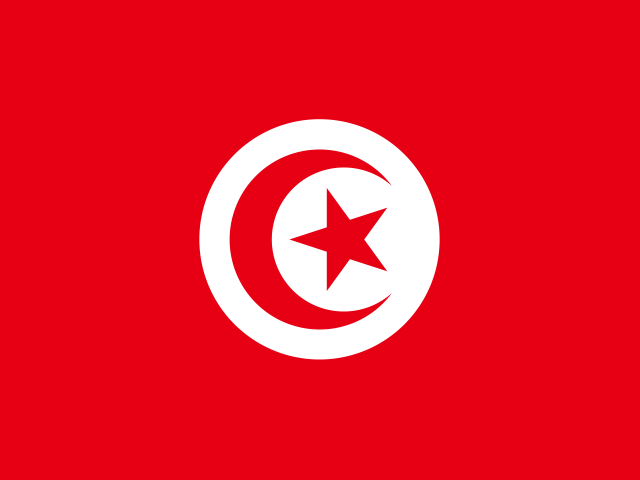 Tunisia0.00344
 Morocco0.02670
Lowest and highest reading in Northern Africa.
- Polynesia
3 of 7 measured — too few for a middle: Samoa, Tonga, Tuvalu.
Tonga0.00334 Samoa0.02460
Lowest and highest reading in Polynesia.
- Southern Africa
4 of 5 measured — too few for a middle: Botswana, Eswatini, Lesotho, South Africa.
 South Africa0.02489
 Lesotho0.10605
Lowest and highest reading in Southern Africa.
- Southern Europe
4 of 17 measured — too few for a middle: Albania, Montenegro, North Macedonia, Serbia.
Serbia0.00043Montenegro0.00490Lowest and highest reading in Southern Europe.
03The whole field at once
The spread
103 countries, one dot each, on one scale — further right is a higher value. Half the countries are above 0.04792; a quarter are above 0.22143, and a quarter below 0.00783. The bar in each row marks that continent’s middle country.
Log scale: each gridline is ten times the one before, so countries of very different sizes can be seen on one line.
04All 119 ever measured
Every country
In order, highest value first — position 1 is the highest value, the way OPHI’s own tables read. “=” marks a position shared with another country. Oxford Poverty and Human Development Initiative (OPHI) ranks nobody on this measure; the position is derived here by ordering the published values. Because the rows do not share a year, each carries its own survey period — and for the same reason this indicator stays out of the Country Index, which needs a stated data year. Position 1 is the POOREST country here; OPHI prints its own table least-poor first, so the two do not open on the same country.
Showing 25 of 119 countries


















Values for the 2025 edition. The change column compares the 2025 edition with 2024 only; the sparkline covers the recent editions.
052018–2025 · 8 editions
Over time
Each point is one published edition. There is no data year: every country’s figure comes from its own most recent household survey, so the 2025 edition mixes surveys run between 2013 and 2024.
- the middle country
- the middle half of countries
- the middle of the 84 countries measured every time
- each continent’s middle country
The same, year by year
| Year | Countries | Middle country | Middle half | Measured every time |
|---|---|---|---|---|
| 2025 | 103 | 0.04792 | 0.00783 – 0.22143 | 0.07643 |
| 2024 | 112 | 0.03721 | 0.00765 – 0.21300 | 0.08433 |
| 2023 | 110 | 0.04284 | 0.00750 – 0.22863 | 0.08282 |
| 2022 | 111 | 0.06881 | 0.00801 – 0.23187 | 0.09421 |
| 2021 | 109 | 0.07440 | 0.01118 – 0.24517 | 0.10620 |
| 2020 | 107 | 0.08497 | 0.01404 – 0.24292 | 0.10914 |
| 2019 | 101 | 0.10833 | 0.01711 – 0.26064 | 0.12809 |
| 2018 | 105 | 0.12076 | 0.01732 – 0.26226 | 0.14030 |
062024 → 2025
Who rose and fell
The biggest changes in value between the two newest editions. Places are shown second, because they also move when other countries do.
Improved most
before → after- Niger0.60128 → 0.47032 · 1st → 2nd−0.13096
 Bangladesh0.10406 → 0.06651 · 44th → 52nd−0.03755
 Senegal0.26286 → 0.22622 · 21st → 26th−0.03665
 Laos0.10833 → 0.08249 · 43rd → 47th−0.02585
- Bolivia0.03775 → 0.02317 · 56th → 66th−0.01459
Worsened most
before → after- Lesotho0.08436 → 0.10605 · 46th → 44th+0.02169
 Kyrgyzstan0.00143 → 0.00342 · 106th → 91st+0.00199
 Jordan0.00153 → 0.00277 · 104th → 94th+0.00125
- Central African Republic0.46135 → 0.46135 · 3rd → 3rd+0.00000
 Côte d’Ivoire0.21022 → 0.21022 · 29th → 29th+0.00000
100 countries were measured in both 2024 and 2025. The field changed from 112 to 109 countries, so a place can move for reasons that have nothing to do with the country itself.
07Across every edition
Multidimensional Poverty Index in records
The extremes of the statistic. A record reached by more than one country names none of them.
Highest reading on record
0.60128
MPI (0–1)
Lowest reading on record
0.00043
MPI (0–1)
Biggest improvement between editions
−0.13096
0.60128 → 0.47032
Biggest decline between editions
+0.08858
0.27172 → 0.36031
Most improved since first measured
−0.17734
0.52023 → 0.34289
At the top most often
5 of 8
editions, alone at the first-listed end
08The parts of the index
Inside the number
Oxford Poverty and Human Development Initiative (OPHI) publishes the parts the headline is built from. Each part’s highest and lowest country, and its middle value.
| Part | Highest | Lowest | Middle country |
|---|---|---|---|
| Population in poverty (%)103 countries | Chad84.175 | Serbia0.114 | 11.712 |
| Intensity of deprivation (%)103 countries | Chad61.421 | Argentina33.986 | 41.978 |
09The measure
About Multidimensional Poverty Index
The Global Multidimensional Poverty Index counts poverty as overlapping deprivations in health, education and living standards rather than as a shortfall of income. Oxford’s OPHI computes it as the share of people who are poor multiplied by how intensely they are deprived — both stored here beside it.
What the number is: MPI (0–1).
10Where it fits
Connections
Its part in the Country Index, the statistics whose values line up most closely with it across countries, and others on the same subject.
In the Country Index
Context, with no vote
This statistic is published in full under Health & Wellbeing and Development & Human Capital and Poverty & Inequality, but does not help decide any Country Index standing.
Health & WellbeingDevelopment & Human CapitalPoverty & InequalityWhich statistics vote, and why
Moves with
Where Multidimensional Poverty Index is higher, these tend to be higher too.
- Multidimensional Poverty MeasureWorld Bank Group · 81 countries in commonρ 0.90
- Coefficient of Human InequalityUNDP Human Development Report Office · 96 countries in commonρ 0.86
- Maternal Mortality RatioKeyMMEIG · 103 countries in commonρ 0.86
Moves against
Where Multidimensional Poverty Index is higher, these tend to be lower.
- Inequality-adjusted Human Development IndexUNDP Human Development Report Office · 96 countries in commonρ −0.94
- Human Development IndexKeyUNDP Human Development Report Office · 103 countries in commonρ −0.93
- Planetary pressures-adjusted HDIUNDP Human Development Report Office · 84 countries in commonρ −0.91
Rank correlation (ρ, from −1 to 1) across countries, on each statistic’s newest edition, out of 284 statistics sharing at least 80 countries with this one. Two statistics that move together do not cause each other.
11Keep reading
Explore further
The countries at either end
12Questions
Multidimensional Poverty Index: questions and answers
Which country has the lowest Multidimensional Poverty Index?
Serbia, at 0.00043, among the 103 countries compared in the 2025 edition.
Which country has the highest Multidimensional Poverty Index?
Chad, at 0.51701, among the 103 countries compared in the 2025 edition.
How many countries does the Global Multidimensional Poverty Index cover?
103 in the 2025 edition, and 119 at least once across all editions. The number measured varies from 101 to 112 between editions.
What is the world average Multidimensional Poverty Index?
This site does not calculate a world average, which would depend on how countries are weighted. In the middle country of the 103 compared in the 2025 edition, the figure was 0.04792.
Is this Oxford Poverty and Human Development Initiative (OPHI)’s own ranking?
No. Oxford Poverty and Human Development Initiative (OPHI) publishes the values but ranks nobody; the position on this page is derived by Nations Inquiry by ordering the published values, and equal values share a position.
How often is the Global Multidimensional Poverty Index published?
This site holds 8 editions, describing 2018 to 2025.
Where does the data come from, and can I download it?
From Oxford Poverty and Human Development Initiative (OPHI), under Public domain. From OPHI’s published Global MPI tables, survey year included as its own column because many are two-year fieldwork periods. Every edition is on this site’s Datasets pages as a full table, and downloads as a CSV file with every value unrounded.
13Method
Sources, method and citation
Source
Global Multidimensional Poverty Index — Oxford Poverty and Human Development Initiative (OPHI)
From OPHI’s published Global MPI tables, survey year included as its own column because many are two-year fieldwork periods.
Newest edition
Report year 2025Data year not recorded
Cite the source as: Oxford Poverty and Human Development Initiative and UNDP. Global Multidimensional Poverty Index. Oxford: University of Oxford.
Licence: Public domain, checked 2026-09-05.
How this page reads the numbers
- Oxford Poverty and Human Development Initiative (OPHI) ranks nobody on this measure. The position is derived by Nations Inquiry by ordering the published values; equal values share a position.
- Which end is better follows the publisher’s own reading of the measure.
- A country is named at an end only when it holds that value alone. Where several share it, the page says how many and names none first.
- The file gives each country’s most recent reading, so the rows are from different years. Readings from before 2015 are listed but left out of every comparison on this page.
- Values are stored exactly as published and trimmed only for display. “The middle country” is the median of the countries measured, not a world average.
The file itself, column by column — where it came from, what each column holds, and every edition as a CSV — is on its dataset page.
Photographs
The countries at the top of this statistic, from their profiles: Wikimedia Commons, shown in greyscale, each used under the licence named.
Cite this page
Nations Inquiry (2026). Multidimensional Poverty Index by country: Global Multidimensional Poverty Index, data from Oxford Poverty and Human Development Initiative (OPHI). https://nationsinquiry.com/statistics/global-mpi