Data for 2011
Historical Index of Ethnic Fractionalization, 2011
2011, as Lenka Dražanová’s 2020 release gives it · stored as published, never rewritten
The Historical Index of Ethnic Fractionalization measures how ethnically diverse a country's population is: the chance that two people chosen at random belong to different ethnic groups. Compiled by Lenka Dražanová at the European University Institute, it runs from 0, where everyone belongs to one group, towards 1, where the population is split among many small groups, year by year from 1945 to 2013.
Historical Index of Ethnic Fractionalization, 2011 covers 156 countries. Liberia is highest, at 0.889; North Korea is lowest, at 0.017. The middle country reads 0.443. Against 2010, 115 values changed (68 up, 47 down), the same countries are covered.
Historical Index of Ethnic Fractionalization · Data for 2011

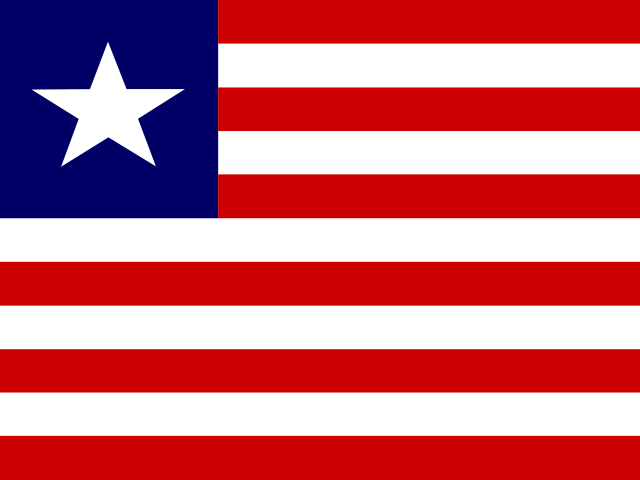
HighestLiberia
0.889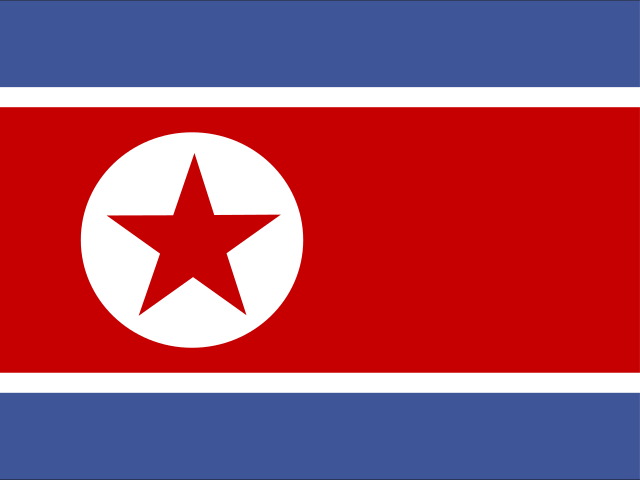
LowestNorth Korea
0.017Shaded by value in five groups of equal size, darkest at the highest end.
01Values only
The table
Every country and every column of Historical Index of Ethnic Fractionalization, 2011, as published. The file carries values only, so no position is shown. “=” marks a shared position.
Showing 25 of 156 countries · select a heading to sort
LiberiaLBRWestern Africa | 0.889 |
 Uganda UGAEastern Africa | 0.883 |
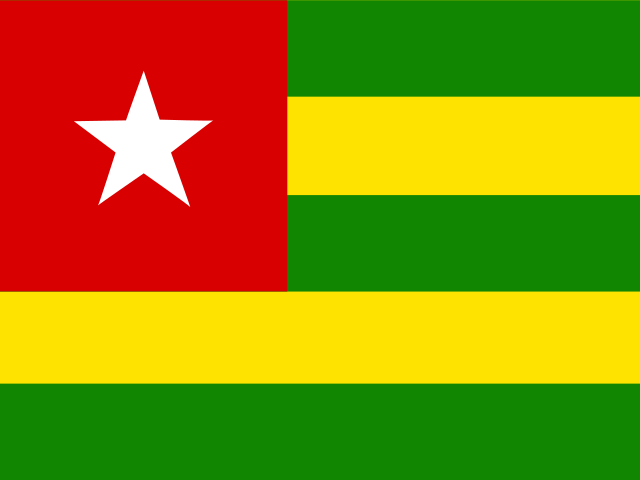 Togo TGOWestern Africa | 0.879 |
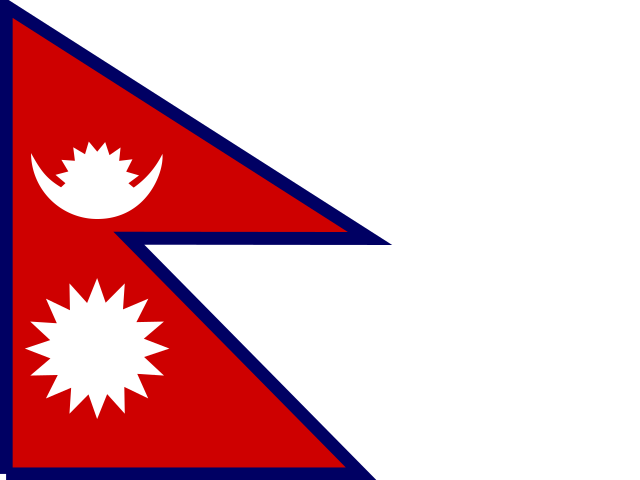 Nepal NPLSouthern Asia | 0.856 |
 South Africa ZAFSouthern Africa | 0.856 |
 Chad TCDMiddle Africa | 0.855 |
 Kenya KENEastern Africa | 0.855 |
 Mali MLIWestern Africa | 0.852 |
 Nigeria NGAWestern Africa | 0.850 |
 Timor-Leste TLSSouth-eastern Asia | 0.825 |
 Philippines PHLSouth-eastern Asia | 0.809 |
 Guinea-Bissau GNBWestern Africa | 0.808 |
 Indonesia IDNSouth-eastern Asia | 0.802 |
 Sierra Leone SLEWestern Africa | 0.801 |
 Central African Republic CAFMiddle Africa | 0.791 |
 Gabon GABMiddle Africa | 0.791 |
 Malawi MWIEastern Africa | 0.791 |
 Ethiopia ETHEastern Africa | 0.784 |
 Angola AGOMiddle Africa | 0.778 |
 Burkina Faso BFAWestern Africa | 0.767 |
 Benin BENWestern Africa | 0.766 |
 Kuwait KWTWestern Asia | 0.764 |
 Gambia GMBWestern Africa | 0.762 |
 Afghanistan AFGSouthern Asia | 0.759 |
 Namibia NAMSouthern Africa | 0.757 |
 Senegal SENWestern Africa | 0.750 |
 Sudan SDNNorthern Africa | 0.746 |
 Iran IRNSouthern Asia | 0.744 |
 Pakistan PAKSouthern Asia | 0.742 |
 Ghana GHAWestern Africa | 0.736 |
 Côte d’Ivoire CIVWestern Africa | 0.732 |
 Guinea GINWestern Africa | 0.729 |
 Canada CANNorthern America | 0.727 |
 Zambia ZMBEastern Africa | 0.715 |
 Mauritania MRTWestern Africa | 0.711 |
 Qatar QATWestern Asia | 0.709 |
 Republic of the Congo COGMiddle Africa | 0.705 |
 DR Congo CODMiddle Africa | 0.703 |
 Guyana GUYSouth America | 0.693 |
 United Arab Emirates AREWestern Asia | 0.687 |
 Niger NERWestern Africa | 0.667 |
 Spain ESPSouthern Europe | 0.664 |
 Eritrea ERIEastern Africa | 0.663 |
 Trinidad and Tobago TTOCaribbean | 0.654 |
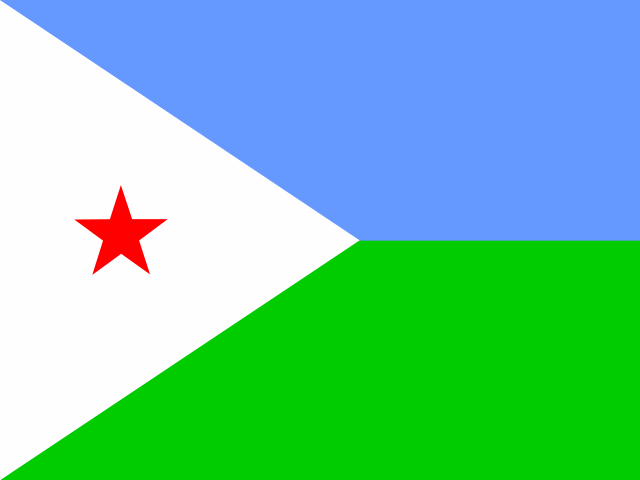 Djibouti DJIEastern Africa | 0.650 |
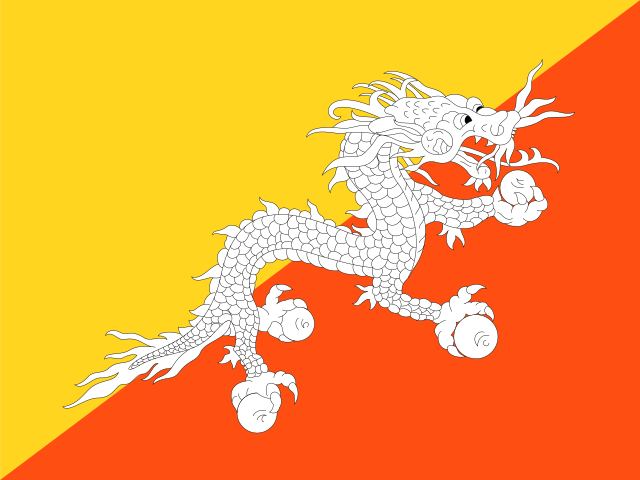 Bhutan BTNSouthern Asia | 0.648 |
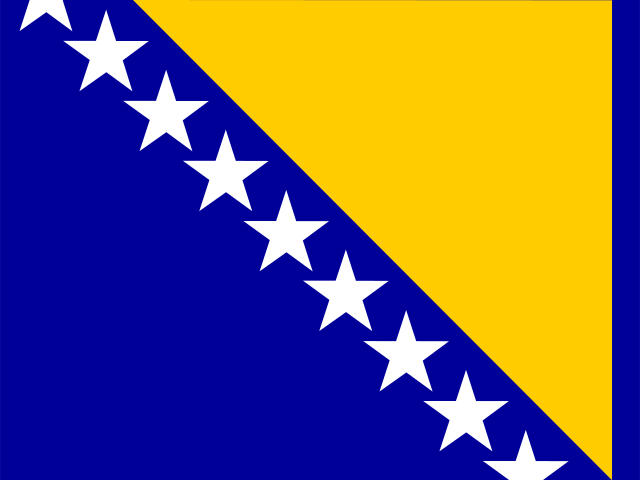 Bosnia and Herzegovina BIHSouthern Europe | 0.640 |
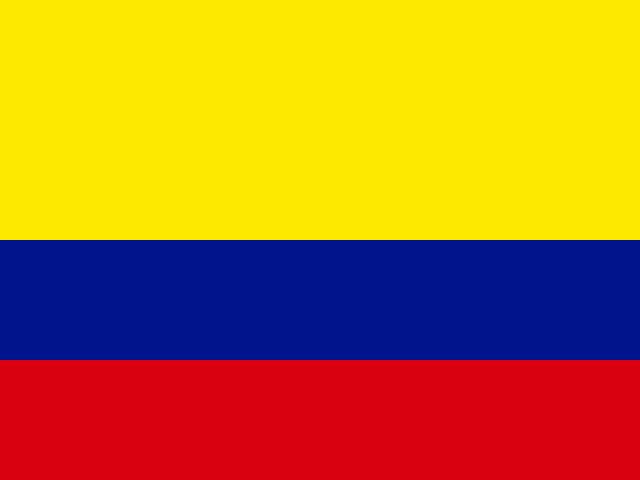 Colombia COLSouth America | 0.640 |
 Laos LAOSouth-eastern Asia | 0.632 |
 Peru PERSouth America | 0.619 |
 Panama PANCentral America | 0.608 |
 Tanzania TZAEastern Africa | 0.595 |
 Belgium BELWestern Europe | 0.590 |
 Mexico MEXCentral America | 0.586 |
 Myanmar MMRSouth-eastern Asia | 0.584 |
 Oman OMNWestern Asia | 0.581 |
 Bolivia BOLSouth America | 0.574 |
 Malaysia MYSSouth-eastern Asia | 0.572 |
 Bahrain BHRWestern Asia | 0.570 |
 Morocco MARNorthern Africa | 0.563 |
 Brazil BRASouth America | 0.559 |
 North Macedonia MKDSouthern Europe | 0.558 |
 Kazakhstan KAZCentral Asia | 0.556 |
 Latvia LVANorthern Europe | 0.553 |
 Nicaragua NICCentral America | 0.541 |
 Ecuador ECUSouth America | 0.538 |
 Fiji FJIMelanesia | 0.531 |
 Venezuela VENSouth America | 0.518 |
 Guatemala GTMCentral America | 0.515 |
 Cuba CUBCaribbean | 0.514 |
 United States USANorthern America | 0.514 |
 Türkiye TURWestern Asia | 0.505 |
 Kyrgyzstan KGZCentral Asia | 0.504 |
 New Zealand NZLAustralia and New Zealand | 0.470 |
 Mauritius MUSEastern Africa | 0.466 |
 Estonia ESTNorthern Europe | 0.464 |
 Dominican Republic DOMCaribbean | 0.451 |
 Iraq IRQWestern Asia | 0.443 |
 Chile CHLSouth America | 0.442 |
 Cabo Verde CPVWestern Africa | 0.441 |
 Moldova MDAEastern Europe | 0.441 |
 Zimbabwe ZWEEastern Africa | 0.413 |
 Serbia SRBSouthern Europe | 0.401 |
 Botswana BWASouthern Africa | 0.400 |
 Singapore SGPSouth-eastern Asia | 0.395 |
 Costa Rica CRICentral America | 0.393 |
 United Kingdom GBRNorthern Europe | 0.392 |
 Tajikistan TJKCentral Asia | 0.384 |
 Georgia GEOWestern Asia | 0.379 |
 Ukraine UKREastern Europe | 0.376 |
 Eswatini SWZSouthern Africa | 0.374 |
 Algeria DZANorthern Africa | 0.370 |
 Israel ISRWestern Asia | 0.369 |
 Russia RUSEastern Europe | 0.367 |
 Taiwan TWNEastern Asia | 0.365 |
 Switzerland CHEWestern Europe | 0.361 |
 Thailand THASouth-eastern Asia | 0.353 |
 Cyprus CYPWestern Asia | 0.347 |
 Sri Lanka LKASouthern Asia | 0.327 |
 Uzbekistan UZBCentral Asia | 0.326 |
 Netherlands NLDWestern Europe | 0.321 |
 Mongolia MNGEastern Asia | 0.315 |
 Belarus BLREastern Europe | 0.313 |
 Lesotho LSOSouthern Africa | 0.311 |
 Burundi BDIEastern Africa | 0.306 |
 Lithuania LTUNorthern Europe | 0.289 |
 Bulgaria BGREastern Europe | 0.287 |
 Rwanda RWAEastern Africa | 0.275 |
 Turkmenistan TKMCentral Asia | 0.272 |
 Czechia CZEEastern Europe | 0.270 |
 Vietnam VNMSouth-eastern Asia | 0.263 |
 Libya LBYNorthern Africa | 0.254 |
 Australia AUSAustralia and New Zealand | 0.252 |
 Slovenia SVNSouthern Europe | 0.252 |
 Slovakia SVKEastern Europe | 0.241 |
 Austria AUTWestern Europe | 0.237 |
 Honduras HNDCentral America | 0.226 |
 Saudi Arabia SAUWestern Asia | 0.221 |
 Hungary HUNEastern Europe | 0.216 |
 Sweden SWENorthern Europe | 0.214 |
 Somalia SOMEastern Africa | 0.213 |
 Syria SYRWestern Asia | 0.213 |
 Jamaica JAMCaribbean | 0.210 |
 Romania ROUEastern Europe | 0.206 |
 Portugal PRTSouthern Europe | 0.186 |
 China CHNEastern Asia | 0.184 |
 Germany DEUWestern Europe | 0.184 |
 Croatia HRVSouthern Europe | 0.182 |
 Uruguay URYSouth America | 0.177 |
 Paraguay PRYSouth America | 0.176 |
 Madagascar MDGEastern Africa | 0.173 |
 Ireland IRLNorthern Europe | 0.168 |
 El Salvador SLVCentral America | 0.166 |
 Denmark DNKNorthern Europe | 0.162 |
 Cambodia KHMSouth-eastern Asia | 0.160 |
 Greece GRCSouthern Europe | 0.154 |
 Argentina ARGSouth America | 0.153 |
 Norway NORNorthern Europe | 0.141 |
 Finland FINNorthern Europe | 0.137 |
 Albania ALBSouthern Europe | 0.135 |
 Lebanon LBNWestern Asia | 0.133 |
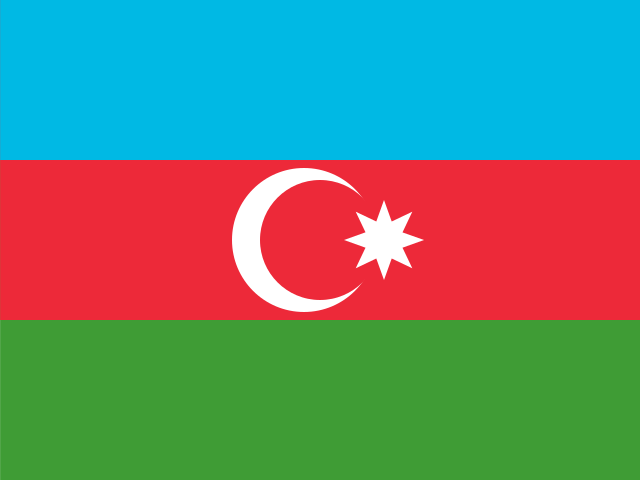 Azerbaijan AZEWestern Asia | 0.129 |
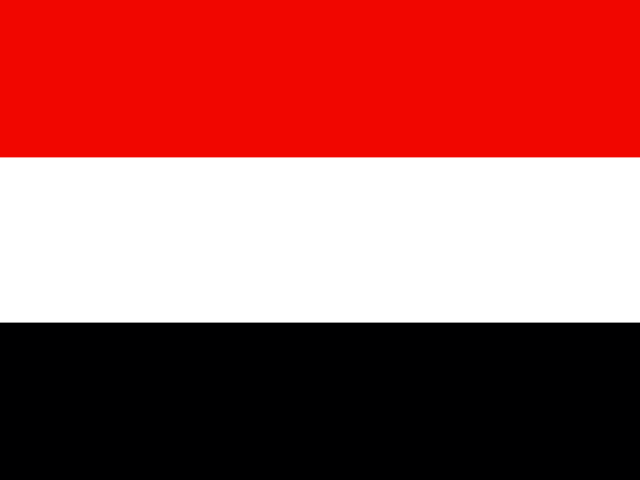 Yemen YEMWestern Asia | 0.128 |
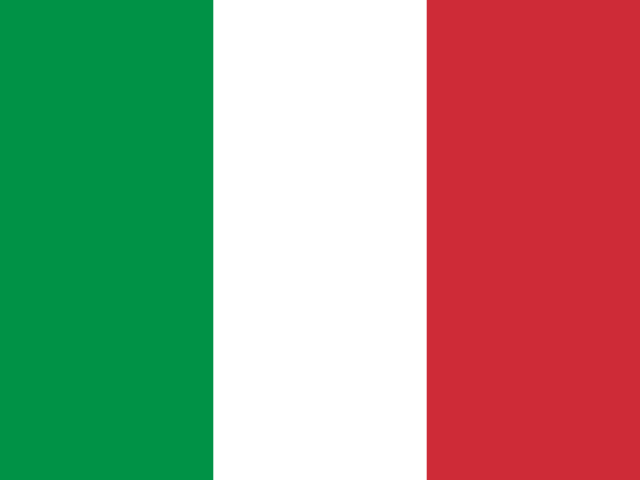 Italy ITASouthern Europe | 0.106 |
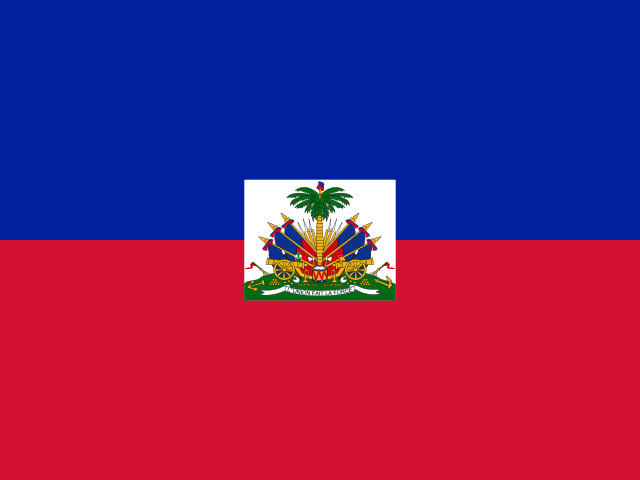 Haiti HTICaribbean | 0.105 |
 Solomon Islands SLBMelanesia | 0.098 |
 South Korea KOREastern Asia | 0.074 |
 Poland POLEastern Europe | 0.062 |
 Comoros COMEastern Africa | 0.055 |
 Armenia ARMWestern Asia | 0.049 |
 Jordan JORWestern Asia | 0.043 |
 Egypt EGYNorthern Africa | 0.038 |
 Tunisia TUNNorthern Africa | 0.035 |
 Bangladesh BGDSouthern Asia | 0.026 |
 Japan JPNEastern Asia | 0.018 |
North KoreaPRKEastern Asia | 0.017 |
02In 2011
At either end
The 5 countries at each end of the headline.
Highest
- Liberia0.889
- Uganda0.883
- Togo0.879
- Nepalshared0.856
- South Africashared0.856
Lowest
- North Korea0.017
- Japan0.018
- Bangladesh0.026
- Tunisia0.035
- Egypt0.038
Neither end is better. The values describe a shape, not a score. The middle country reads 0.443. “Shared” marks a value another country also holds.
032010 → 2011
Since 2010
- +0 / −0countries joined / left
- 115values changed, of 156 in both
- 68 · 47rose · fell
- 41unchanged
Rose most
- Netherlands0.306 → 0.321+0.015
- Portugal0.171 → 0.186+0.015
- Australia0.241 → 0.252+0.011
- Madagascar0.163 → 0.173+0.010
- Türkiye0.496 → 0.505+0.009
Fell most
- Kyrgyzstan0.513 → 0.504−0.009
- Kazakhstan0.565 → 0.556−0.009
- Tajikistan0.392 → 0.384−0.008
- Turkmenistan0.280 → 0.272−0.008
- Timor-Leste0.833 → 0.825−0.008
04Caveats
Read before you use
One year of the 2020 release
Every year in this series comes from Lenka Dražanová’s 2020 release, recalculated on one method, so a change from one year to the next is not a revision. It can differ from what was first published for 2011.
146 distinct values among 156
Values are stored exactly as published, to 3 decimals. 3 countries share 0.791. Countries sharing a value share a position too.
Nothing missing
Every one of the 156 countries has every column.
05The files
Download and cite
- .csv
For a spreadsheet or code
156 rows · 4.5 KB · UTF-8, opens in Excel
Opens with 11 lines of source notes; the table starts on row 13.
Download ethnic-fractionalization-2011-nations-inquiry.csv - ↗
The publisher’s original
Lenka Dražanová’s own file, on its own site.
3476857
What this site changed: Reshaped to one row per country, with its ISO code; no value recalculated, rescaled or rounded. In full
Licence: CC0 1.0 · what it allows, in plain words
Cite this edition
Lenka Dražanová, European University Institute (Migration Policy Centre) (2011). Historical Index of Ethnic Fractionalization, 2011 [data set], describing 2011. As held by Nations Inquiry, https://nationsinquiry.com/datasets/ethnic-fractionalization/2011
0669 held
Other years
‹ The year before
Historical Index of Ethnic Fractionalization, 2010156 countries
The year after ›
Historical Index of Ethnic Fractionalization, 2012156 countries
All of them
Historical Index of Ethnic Fractionalization: every year69 held, with the data dictionary, coverage and licence.
How it has moved, charted by country