UN DESA Population Division · Adult Mortality (Probability of Dying Between 15 and 60)
Adult mortality by country
How likely is a 15-year-old to die before reaching 60?
Of the 222 countries compared in 2023, Monaco had the lowest reading, 25.151, and Lesotho had the highest reading, 415.441. In the middle country the figure was 133.698. Among the 222 countries measured in every edition since 1950, the middle one moved from 370.069 to 133.698.
Share
Part ofHealth & Wellbeing
Adult mortality · 2023
Context statistic

Lowest of 222Monaco
25.151012023 · position · derived
Who leads
The three countries at the lowest end of 222 compared, the three at the other end, and the first on each continent.
 1
1Photo: Martin Weber derivative work: Jjtkk · CC BY-SA 3.0, greyscale
 2
2Photo: Unknown author · CC BY-SA 3.0, greyscale
 3
3Photo: Unknown author · CC BY-SA 2.0, greyscale
Highest in 2023
 Lesotho415.441
 Central African Republic355.452
 Nigeria349.494
Where a country sits says how it compares with the others measured, and nothing about why.
Lowest on each continent
- Africa
 Algeria72.800
 - Americas
 Saint Martin56.861
 - Asia
 United Arab Emirates30.499
 - EuropeMonaco25.151
- Oceania
 French Polynesia35.289
 - Every region
02Every measured country
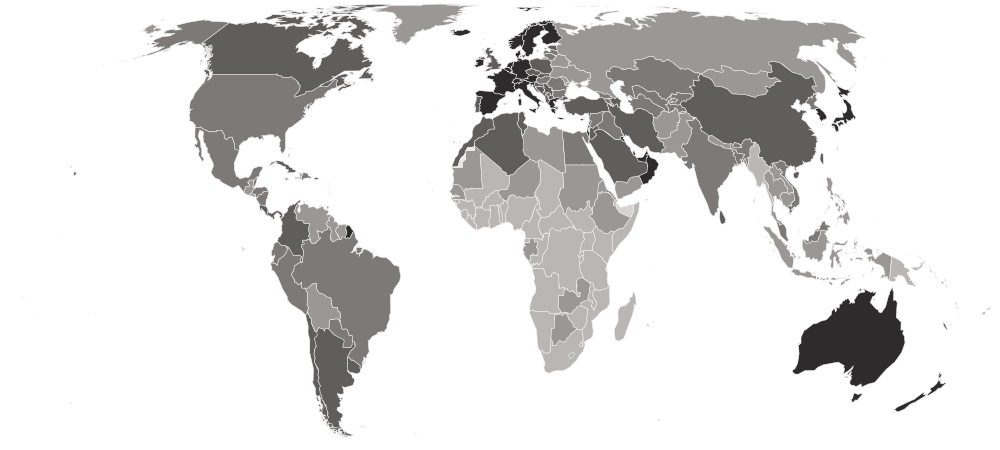
Adult mortality on a map
Each country is shaded by its value, in five groups holding the same number of countries. Hover a country for its value, or select it to open its profile. Below the map, each continent’s middle country.
Darker is a lower value — the better end.
- 209.813–415.441
- 159.010–208.127
- 107.566–157.380
- 66.028–107.201
- 25.151–65.852
- No reading in 2023
- Europe
64.081
the middle country, of 48 measured · 49 members
Monaco25.151 Russia201.793
Lowest and highest reading in Europe.
- Americas
115.549
the middle country, of 48 measured · 48 members
Saint Martin56.861 Haiti225.311
Lowest and highest reading in Americas.
- Asia
120.967
the middle country, of 51 measured · 52 members
United Arab Emirates30.499 Palestine272.912
Lowest and highest reading in Asia.
- Oceania
166.741
the middle country, of 21 measured · 21 members
French Polynesia35.289 Nauru348.322
Lowest and highest reading in Oceania.
- Africa
231.268
the middle country, of 54 measured · 55 members
Algeria72.800Lesotho415.441Lowest and highest reading in Africa.
- Every region
22 sub-regions, lowest middle country first
- Western Europe
54.657
the middle country, of 9 measured · 9 members
Monaco25.151 France65.062
Lowest and highest reading in Western Europe.
- Southern Europe
59.118
the middle country, of 17 measured · 17 members
 San Marino33.422
 Serbia105.317
Lowest and highest reading in Southern Europe.
- Northern Europe
60.512
the middle country, of 12 measured · 13 members
 Norway42.400
 Lithuania139.867
Lowest and highest reading in Northern Europe.
- Eastern Asia
66.519
the middle country, of 8 measured · 8 members
 South Korea32.668
 Mongolia192.727
Lowest and highest reading in Eastern Asia.
- Western Asia
77.378
the middle country, of 18 measured · 19 members
United Arab Emirates30.499Palestine272.912Lowest and highest reading in Western Asia.
- Caribbean
107.815
the middle country, of 24 measured · 24 members
Saint Martin56.861Haiti225.311Lowest and highest reading in Caribbean.
- Northern Africa
115.328
the middle country, of 6 measured · 6 members
Algeria72.800 Sudan208.127
Lowest and highest reading in Northern Africa.
- South America
121.291
the middle country, of 12 measured · 12 members
 Chile77.871
 Guyana203.374
Lowest and highest reading in South America.
- Southern Asia
125.065
the middle country, of 9 measured · 9 members
 Maldives37.940
 Afghanistan201.109
Lowest and highest reading in Southern Asia.
- Eastern Europe
127.709
the middle country, of 10 measured · 10 members
 Czechia74.421Russia201.793
Lowest and highest reading in Eastern Europe.
- Central America
144.543
the middle country, of 8 measured · 8 members
 Costa Rica84.560
 El Salvador192.429
Lowest and highest reading in Central America.
- Central Asia
152.925
the middle country, of 5 measured · 5 members
 Tajikistan131.217
 Kyrgyzstan157.380
Lowest and highest reading in Central Asia.
- South-eastern Asia
163.855
the middle country, of 11 measured · 11 members
 Singapore55.357
 Myanmar209.813
Lowest and highest reading in South-eastern Asia.
- Polynesia
165.503
the middle country, of 7 measured · 7 members
French Polynesia35.289 Tuvalu255.222
Lowest and highest reading in Polynesia.
- Melanesia
166.741
the middle country, of 5 measured · 5 members
 New Caledonia92.518
 Papua New Guinea224.209
Lowest and highest reading in Melanesia.
- Micronesia
198.436
the middle country, of 7 measured · 7 members
 Northern Mariana Islands75.535Nauru348.322
Lowest and highest reading in Micronesia.
- Eastern Africa
224.265
the middle country, of 18 measured · 19 members
 Mauritius143.764
 Zimbabwe317.057
Lowest and highest reading in Eastern Africa.
- Middle Africa
235.721
the middle country, of 9 measured · 9 members
 Gabon204.302Central African Republic355.452
Lowest and highest reading in Middle Africa.
- Western Africa
238.829
the middle country, of 16 measured · 16 members
 Cabo Verde113.398Nigeria349.494
Lowest and highest reading in Western Africa.
- Southern Africa
269.550
the middle country, of 5 measured · 5 members
 Botswana188.695Lesotho415.441
Lowest and highest reading in Southern Africa.
- Australia and New Zealand
2 of 2 measured — too few for a middle: Australia, New Zealand.
 Australia43.281
 New Zealand64.498
Lowest and highest reading in Australia and New Zealand.
- Northern America
4 of 4 measured — too few for a middle: Bermuda, Canada, Greenland, United States.
 Bermuda65.852
 Greenland190.716
Lowest and highest reading in Northern America.
03The whole field at once
The spread
222 countries, one dot each, on one scale — further right is a higher value. Half the countries are above 133.698; a quarter are above 194.817, and a quarter below 75.379. The bar in each row marks that continent’s middle country.
04All 222 ever measured
Every country
In order, highest value first — position 1 is the highest value, the way UN DESA Population Division’s own tables read. “=” marks a position shared with another country. UN DESA Population Division ranks nobody on this measure; the position is derived here by ordering the published values. The figure is per 1,000, not a percentage: 200 means one in five 15-year-olds would not reach 60. Men die between 15 and 60 at higher rates than women in practically every country, often by a wide margin, so the both-sexes figure can hide a large gap — the page shows both. Where deaths are not fully registered, the UN estimates the figure from models rather than counts.
Showing 25 of 222 countries














































































































































































Values for 2023. The change column compares 2023 with 2022 only; the sparkline covers the recent editions.
051950–2023 · 74 reference years
Over time
Each point is one year's estimate, 1950 to 2023, as restated by the 2024 revision of World Population Prospects. Because it is built from a single year's death rates, it jumps in a year of war, famine or epidemic and falls back afterwards; the women's and men's lines show whether a change was shared.
- the middle country
- the middle half of countries
- the middle of the 222 countries measured every time
- each continent’s middle country
The same, year by year
| Year | Countries | Middle country | Middle half | Measured every time |
|---|---|---|---|---|
| 2023 | 222 | 133.698 | 75.379 – 194.817 | 133.698 |
| 2022 | 222 | 135.501 | 80.872 – 199.876 | 135.501 |
| 2021 | 222 | 161.048 | 97.344 – 227.873 | 161.048 |
| 2020 | 222 | 149.411 | 86.045 – 210.499 | 149.411 |
| 2019 | 222 | 139.689 | 80.618 – 202.894 | 139.689 |
| 2018 | 222 | 141.699 | 82.405 – 204.869 | 141.699 |
| 2017 | 222 | 143.887 | 86.416 – 208.405 | 143.887 |
| 2016 | 222 | 144.848 | 86.840 – 213.178 | 144.848 |
| 2015 | 222 | 144.896 | 87.792 – 218.704 | 144.896 |
| 2014 | 222 | 145.879 | 89.648 – 223.772 | 145.879 |
| 2013 | 222 | 145.642 | 90.644 – 227.403 | 145.642 |
| 2012 | 222 | 148.086 | 92.461 – 230.472 | 148.086 |
| 2011 | 222 | 149.747 | 94.536 – 231.327 | 149.747 |
| 2010 | 222 | 153.123 | 96.747 – 235.915 | 153.123 |
| 2009 | 222 | 158.660 | 98.631 – 240.637 | 158.660 |
| 2008 | 222 | 158.743 | 100.366 – 248.567 | 158.743 |
| 2007 | 222 | 160.635 | 101.943 – 253.310 | 160.635 |
| 2006 | 222 | 163.245 | 102.934 – 259.300 | 163.245 |
| 2005 | 222 | 163.069 | 104.067 – 261.314 | 163.069 |
| 2004 | 222 | 167.867 | 105.582 – 264.007 | 167.867 |
| 2003 | 222 | 165.945 | 109.120 – 265.889 | 165.945 |
| 2002 | 222 | 168.974 | 112.512 – 266.976 | 168.974 |
| 2001 | 222 | 175.243 | 115.179 – 267.481 | 175.243 |
| 2000 | 222 | 174.284 | 116.913 – 267.302 | 174.284 |
| 1999 | 222 | 180.335 | 123.106 – 272.417 | 180.335 |
| 1998 | 222 | 182.243 | 127.830 – 274.825 | 182.243 |
| 1997 | 222 | 185.406 | 128.734 – 273.738 | 185.406 |
| 1996 | 222 | 185.251 | 132.366 – 280.819 | 185.251 |
| 1995 | 222 | 188.123 | 133.873 – 284.771 | 188.123 |
| 1994 | 222 | 190.981 | 134.454 – 286.066 | 190.981 |
| 1993 | 222 | 193.076 | 136.952 – 289.451 | 193.076 |
| 1992 | 222 | 194.030 | 137.907 – 289.479 | 194.030 |
| 1991 | 222 | 197.180 | 138.118 – 288.961 | 197.180 |
| 1990 | 222 | 197.691 | 139.580 – 289.501 | 197.691 |
| 1989 | 222 | 196.049 | 140.950 – 284.990 | 196.049 |
| 1988 | 222 | 197.670 | 141.674 – 294.023 | 197.670 |
| 1987 | 222 | 198.486 | 141.199 – 290.536 | 198.486 |
| 1986 | 222 | 199.897 | 144.135 – 290.682 | 199.897 |
| 1985 | 222 | 204.686 | 148.792 – 291.945 | 204.686 |
| 1984 | 222 | 207.893 | 148.894 – 295.609 | 207.893 |
| 1983 | 222 | 207.642 | 150.813 – 298.923 | 207.642 |
| 1982 | 222 | 210.243 | 153.785 – 301.395 | 210.243 |
| 1981 | 222 | 214.188 | 154.480 – 304.392 | 214.188 |
| 1980 | 222 | 215.267 | 157.977 – 305.432 | 215.267 |
| 1979 | 222 | 217.253 | 160.259 – 307.719 | 217.253 |
| 1978 | 222 | 219.365 | 160.934 – 313.766 | 219.365 |
| 1977 | 222 | 221.318 | 162.893 – 314.244 | 221.318 |
| 1976 | 222 | 223.684 | 163.547 – 318.418 | 223.684 |
| 1975 | 222 | 228.801 | 165.156 – 327.271 | 228.801 |
| 1974 | 222 | 232.917 | 168.286 – 334.346 | 232.917 |
| 1973 | 222 | 234.213 | 169.919 – 336.581 | 234.213 |
| 1972 | 222 | 240.584 | 172.771 – 343.903 | 240.584 |
| 1971 | 222 | 245.827 | 174.122 – 346.349 | 245.827 |
| 1970 | 222 | 253.181 | 177.990 – 350.229 | 253.181 |
| 1969 | 222 | 253.010 | 182.253 – 351.259 | 253.010 |
| 1968 | 222 | 257.507 | 178.824 – 353.506 | 257.507 |
| 1967 | 222 | 260.741 | 179.205 – 354.045 | 260.741 |
| 1966 | 222 | 268.693 | 183.131 – 366.208 | 268.693 |
| 1965 | 222 | 271.985 | 181.952 – 367.017 | 271.985 |
| 1964 | 222 | 275.367 | 184.971 – 368.341 | 275.367 |
| 1963 | 222 | 282.139 | 187.109 – 377.094 | 282.139 |
| 1962 | 222 | 284.949 | 190.403 – 382.578 | 284.949 |
| 1961 | 222 | 291.405 | 192.342 – 394.015 | 291.405 |
| 1960 | 222 | 299.741 | 197.682 – 401.998 | 299.741 |
| 1959 | 222 | 303.468 | 205.431 – 410.289 | 303.468 |
| 1958 | 222 | 311.587 | 207.040 – 414.736 | 311.587 |
| 1957 | 222 | 316.980 | 211.310 – 419.175 | 316.980 |
| 1956 | 222 | 325.858 | 215.601 – 423.143 | 325.858 |
| 1955 | 222 | 331.697 | 226.691 – 425.348 | 331.697 |
| 1954 | 222 | 338.525 | 230.263 – 429.940 | 338.525 |
| 1953 | 222 | 350.226 | 239.063 – 437.437 | 350.226 |
| 1952 | 222 | 356.302 | 246.993 – 442.544 | 356.302 |
| 1951 | 222 | 366.910 | 253.356 – 448.599 | 366.910 |
| 1950 | 222 | 370.069 | 258.577 – 450.209 | 370.069 |
062022 → 2023
Who rose and fell
The biggest changes in value between the two newest editions — reference years recalculated in one report, not two separate publications. Places are shown second, because they also move when other countries do.
Improved most
before → after- Central African Republic930.235 → 355.452 · 1st → 2nd−574.783
 Namibia300.207 → 238.486 · 11th → 27th−61.721
 Brunei172.524 → 117.340 · 74th → 125th−55.184
 Puerto Rico114.385 → 73.071 · 133rd → 172nd−41.314
 Somalia315.957 → 279.646 · 8th → 11th−36.311
222 countries were measured in both 2022 and 2023.
07Across every edition
Adult mortality in records
The extremes of the statistic. A record reached by more than one country names none of them.
Highest reading on record
999.975
Deaths before age 60 per 1,000 people alive at 15, at that year's death rates
Lowest reading on record
25.151
Deaths before age 60 per 1,000 people alive at 15, at that year's death rates
Biggest improvement between editions
−574.783
930.235 → 355.452
Biggest decline between editions
+495.540
475.299 → 970.840
Most improved since first measured
−852.176
884.844 → 32.668
At the top most often
26 of 74
editions, alone at the first-listed end
08By sex
Inside the number
UN DESA Population Division also publishes separate female and male readings. The gap between them, where both exist.
Of the 222 countries with both readings, the women reading is higher in 0, the men reading in 222. The widest gaps each way:
09The measure
About adult mortality
Adult mortality is the chance that a 15-year-old will die before reaching 60 if the death rates of the year held throughout their adult life, expressed as deaths per 1,000 people alive at 15. It is the working-age counterpart of child mortality, and it captures the deaths that child-centred measures miss: HIV, violence, road crashes, alcohol and the chronic diseases of middle age.
What the number is: Deaths before age 60 per 1,000 people alive at 15, at that year's death rates.
10Where it fits
Connections
Its part in the Country Index, the statistics whose values line up most closely with it across countries, and others on the same subject.
In the Country Index
Context, with no vote
This statistic is published in full under Health & Wellbeing, but does not help decide any Country Index standing.
Moves with
Where adult mortality is higher, these tend to be higher too.
- Mortality Rate, Ages 5–14UN IGME · 200 countries in commonρ 0.86
- Maternal Mortality RatioKeyMMEIG · 195 countries in commonρ 0.85
- Under-Five Mortality RateKeyUN IGME · 200 countries in commonρ 0.84
Moves against
Where adult mortality is higher, these tend to be lower.
- Life Expectancy at BirthKeyUN DESA Population Division · 222 countries in commonρ −0.97
- Life Expectancy at Age 65UN DESA Population Division · 222 countries in commonρ −0.89
- Human Development IndexKeyUNDP Human Development Report Office · 193 countries in commonρ −0.85
Rank correlation (ρ, from −1 to 1) across countries, on each statistic’s newest edition, out of 386 statistics sharing at least 80 countries with this one. Two statistics that move together do not cause each other.
11Keep reading
Explore further
The subject
The countries at either end
12Questions
Adult mortality: questions and answers
Which country has the lowest adult mortality?
Monaco, at 25.151, among the 222 countries compared in 2023.
Which country has the highest adult mortality?
Lesotho, at 415.441, among the 222 countries compared in 2023.
How many countries does the Adult Mortality (Probability of Dying Between 15 and 60) cover?
222 in 2023.
What is the world average adult mortality?
This site does not calculate a world average, which would depend on how countries are weighted. In the middle country of the 222 compared in 2023, the figure was 133.698.
Is this UN DESA Population Division’s own ranking?
No. UN DESA Population Division publishes the values but ranks nobody; the position on this page is derived by Nations Inquiry by ordering the published values, and equal values share a position.
How often is the Adult Mortality (Probability of Dying Between 15 and 60) published?
This site holds 74 reference years, 1950–2023, all recalculated in UN DESA Population Division’s 2024 report on one method — not 74 separate publications.
Where does the data come from, and can I download it?
From UN DESA Population Division, under CC BY 3.0 IGO. From World Population Prospects 2024, read from the Population Division's own CSV download, with the women's and men's figures published beside the headline. Projections are excluded. Every edition is on this site’s Datasets pages as a full table, and downloads as a CSV file with every value unrounded.
13Method
Sources, method and citation
Source
Adult Mortality (Probability of Dying Between 15 and 60) — UN DESA Population Division
From World Population Prospects 2024, read from the Population Division's own CSV download, with the women's and men's figures published beside the headline. Projections are excluded.
Newest edition
Report year 2023Data year 2023
Cite the source as: United Nations, Department of Economic and Social Affairs, Population Division (2024). World Population Prospects 2024, Online Edition.
Licence: CC BY 3.0 IGO, checked 2026-10-03.
How this page reads the numbers
- UN DESA Population Division ranks nobody on this measure. The position is derived by Nations Inquiry by ordering the published values; equal values share a position.
- Which end is better follows the publisher’s own reading of the measure.
- A country is named at an end only when it holds that value alone. Where several share it, the page says how many and names none first.
- Values are stored exactly as published and trimmed only for display. “The middle country” is the median of the countries measured, not a world average.
The file itself, column by column — where it came from, what each column holds, and every edition as a CSV — is on its dataset page.
Photographs
The countries at the top of this statistic, from their profiles: Wikimedia Commons, shown in greyscale, each used under the licence named.
- Monaco — Martin Weber derivative work: Jjtkk, CC BY-SA 3.0
- United Arab Emirates — Unknown author, CC BY-SA 3.0
- South Korea — Unknown author, CC BY-SA 2.0
Cite this page
Nations Inquiry (2026). Adult mortality by country: Adult Mortality (Probability of Dying Between 15 and 60), data from UN DESA Population Division. https://nationsinquiry.com/statistics/adult-mortality