
Photo: UpstateNYer · CC BY 3.0 · via Wikimedia Commons, shown in greyscale
Saint Martin places highest on Adult Mortality (Probability of Dying Between 15 and 60) (top 15% worldwide) and lowest on Forest Area within Legally Established Protected Areas (bottom 31%).
Share
Saint Martin in the Nations Inquiry Country Index
Saint Martin appears in 36 of the statistics tracked here, but is not placed in the Country Index: the index needs a standing on three quarters of its topics, and Saint Martin is measured on too few of them. Every published reading below is unaffected.
At a glance
Population
27,515
people
since 1950
Land area
53
km²
since 2011
Life expectancy
80.22
years at birth
since 1950
The newest published figure for each, the year it describes and who published it, with a line showing how it has moved.
01The country
About Saint Martin
Saint Martin is the northern, French part of a Caribbean island whose southern half is Dutch, and a French overseas collectivity governed by an elected territorial council. Its hills climb to Pic Paradis, the island’s high point. On the windward shore Orient Bay faces a reef and the islets of Pinel and Tintamarre, within a marine reserve, while on the sheltered west the harbour town of Marigot lies below Fort Louis. Grand Case strings its houses along a single beach road.
The Kalinago knew the island as Soualiga, usually translated ‘land of salt’. After the Spanish garrison left, French and Dutch colonists split it in 1648, and the French side was governed from Guadeloupe for centuries; British forces held it more than once around 1800. Planters grew sugar, cotton and tobacco with enslaved labour until France abolished slavery in 1848. Detached from Guadeloupe in 2007, the territory was battered by Hurricane Irma in September 2017, which tore roofs from homes and yachts from their moorings.
Life on the French side keeps a French rhythm: bakeries open early, a waterfront market sells spices, fish and madras cloth, and Carnival before Lent dances to soca and zouk. Grand Case lines its street with restaurants and lolos, open-air grills selling ribs, lobster and johnnycakes. Every November both halves celebrate Saint Martin’s Day together. Villas, yachts at Anse Marcel and cruise visitors from the Dutch side carry the economy, with French public salaries filling much of the gap.
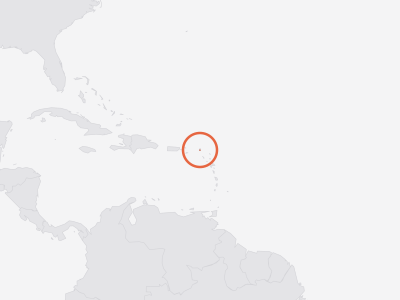
Key facts about Saint Martin
- Capital
- Marigot
- Official language
- French
- Currency
- euro (EUR)
- ISO code
- MAF · MF
- Domain · dialling
- .mf · +590
As Wikidata records them. Official languages are the least consistent — some countries list only a national language, others every regional one. Sources and licences.
02Country Index 2026
Where it stands, topic by topic
Strongest first. Each position is Saint Martin’s place among the countries with a standing on that topic, built from a few key statistics chosen to measure different things.
03Highs and lows
Where Saint Martin stands out
The two ends of its own record: every statistic on which Saint Martin sits within ten places of the best or worst in the world, plus its strongest and weakest readings overall. Each is turned into a percentile — its place among every country measured — which is what lets a hunger score and a press-freedom rank be compared at all.
Where Saint Martin does best5
In the top third of all countries measured.
Position · derived 189th of 222 · 1 = worst · 56.86 · 2023
world median 133.7 (better) · ▼ 2 pts since 2013
- Life Expectancy at Birthtop 22%
Position · derived 50th of 222 · 80.22 · 2023
world median 74.63 (better)
- PM2.5 Air Pollution Exposuretop 24%
Position · derived 167th of 220 · 1 = worst · 8.4 · 2023
world median 14.45 (better) · ▼ 5 pts since 2013
- Life Expectancy at Age 65top 24%
Position · derived 55th of 222 · 18.84 · 2023
world median 16.39 (better)
Where Saint Martin struggles most3
Nothing falls into the world's bottom third — these are Saint Martin's weakest areas even so.
Not ranked by the publisher · 11.29 · 2025
world median 18.18 (worse)
- Municipal Solid Waste Generationbottom 38%
Position · derived 77th of 201 · 1 = worst · 1.194 · 2026
world median 0.966 (worse)
A band is a place among the countries each publisher scores, so Saint Martin can move because other countries moved. See the Country Index for the full method.
04In context
Saint Martin and its neighbours
A position reads best beside the countries around it. Every position below is a place in the world ranking, not within the region.
Shares a land border with
Across Caribbean
Every country in the sub-region, by its position in the world.
- 67
 Barbados
- 68
 Saint Lucia
- =71
 Dominican Republic
- =71
 Saint Vincent and the Grenadines
- =76
 Jamaica
- 81
 Antigua and Barbuda
- 85
 Grenada
- 90
 Trinidad and Tobago
- =104
 Bahamas
- 119
 Cuba
- 173
 Haiti
- —
 Anguillanot placed
- —
 Arubanot placed
- —
 British Virgin Islandsnot placed
- —
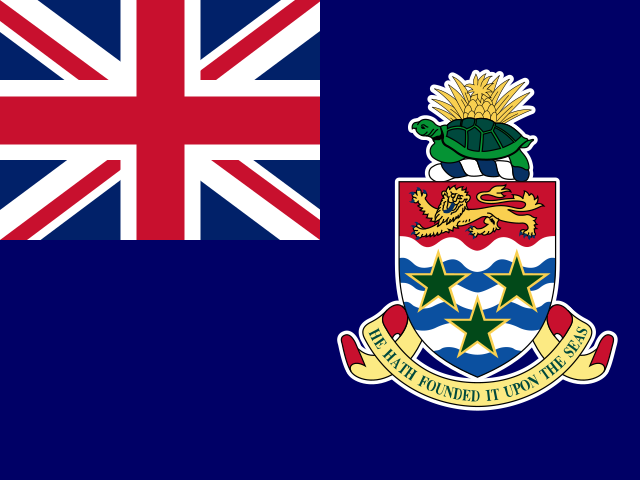 Cayman Islandsnot placed
- —
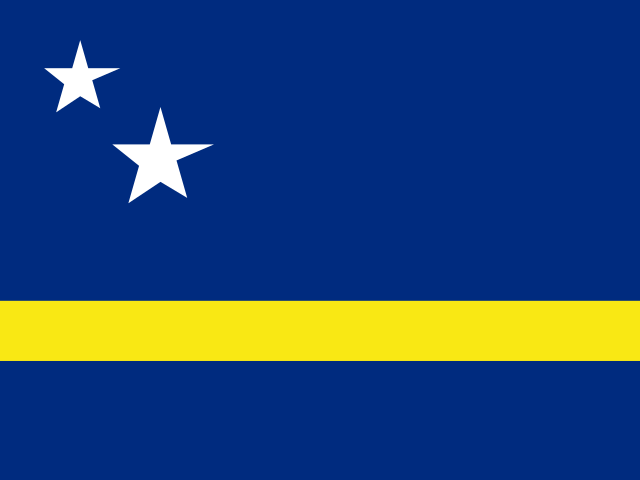 Curaçaonot placed
- —
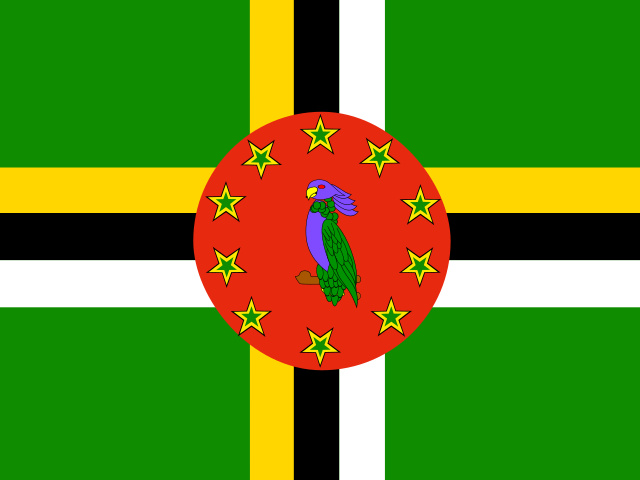 Dominicanot placed
- —
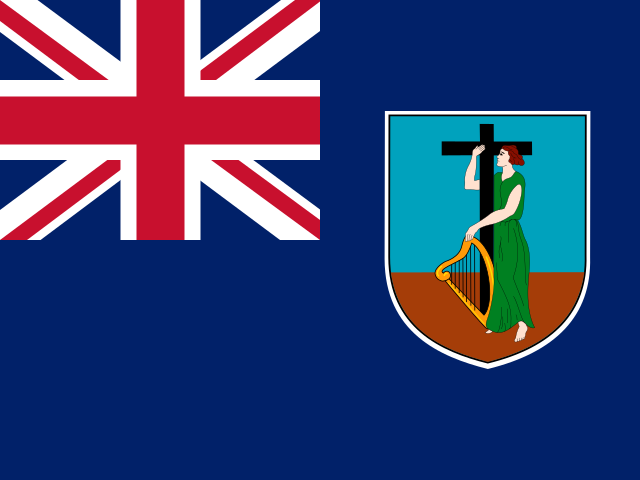 Montserratnot placed
- —
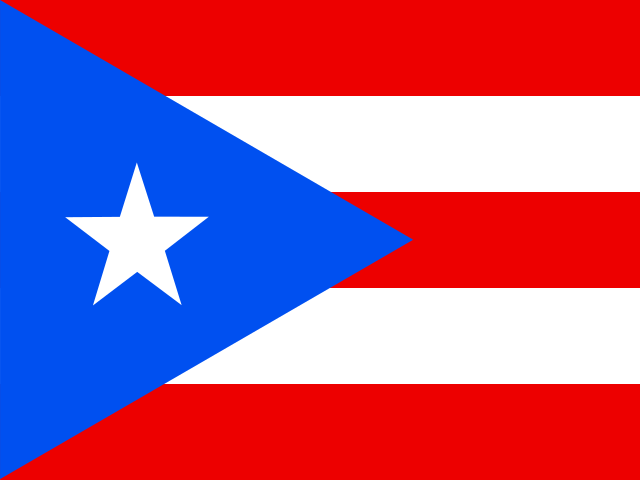 Puerto Riconot placed
- —
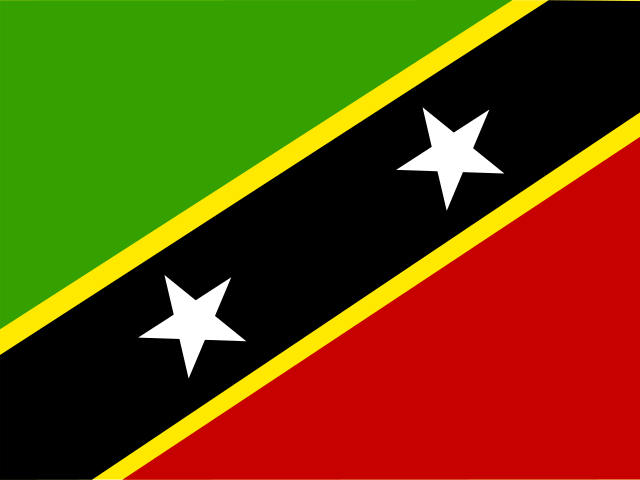 Saint Kitts and Nevisnot placed
- —
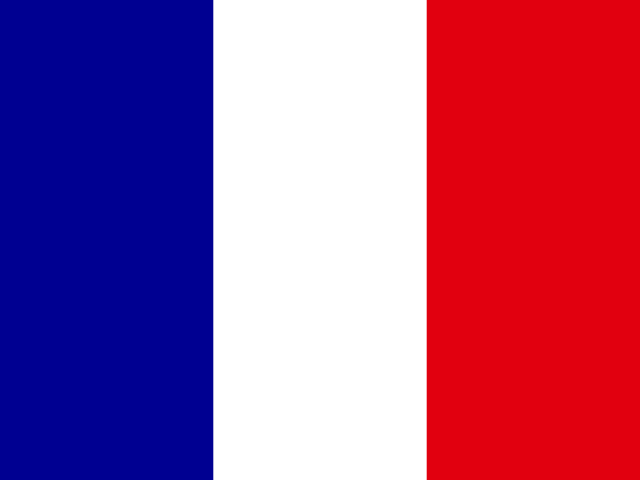 Saint Martinnot placed
- —
 Sint Maartennot placed
- —
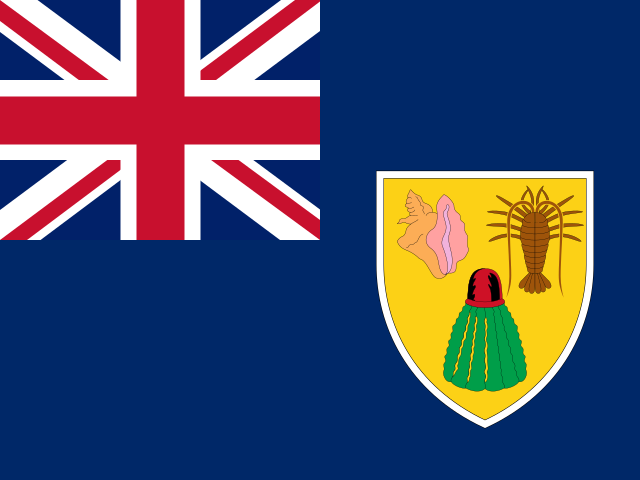 Turks and Caicos Islandsnot placed
- —
 United States Virgin Islandsnot placed
05The evidence
Every statistic we hold for Saint Martin
Grouped by topic. Each row gives the newest edition’s rank or position, the published value and the year the numbers describe. Select a statistic for this country’s row beside every other country, the world median and every edition.
Health & Wellbeing6
- Adolescent Birth Rate (Ages 15–19)UN DESA Population Division · Live births per 1,000 women aged 15–19143rd of 222position · derived · 1 = worst14.292023
- Adult Mortality (Probability of Dying Between 15 and 60)UN DESA Population Division · Deaths before age 60 per 1,000 people alive at 15, at that year's death rates189th of 222position · derived · 1 = worst56.862023
- Days Above 35°CECMWF · Days a year with a maximum temperature above 35°C, averaged over the country’s landtop 16%02025
- Life Expectancy at Age 65UN DESA Population Division · Further years a 65-year-old would live at current death rates55th of 222position · derived18.842023
- Life Expectancy at BirthUN DESA Population Division · Years a newborn would live at current death rates50th of 222position · derived80.222023
- PM2.5 Air Pollution ExposureAtmospheric Composition Analysis Group, Washington University in St. Louis · Population-weighted PM2.5 concentration (µg/m³)167th of 220position · derived · 1 = worst8.42023
Development & Human Capital2
- Access to ElectricityWorld Bank Group · Population with electricity access (%)top 28%1002024
- Access to Electricity, RuralWorld Bank Group · Rural population with electricity access (%)top 29%1002024
Environment & Sustainability8
- Annual Forest Area Change RateFAO · Compound annual change in forest area over the interval ending that year (%)top 49%02025
- Fisheries and Aquaculture ProductionFAO · Fish, crustaceans, molluscs and other aquatic animals caught or farmed, tonnes (live weight)bottom 5%902024
- Forest AreaFAO · Forest area (% of land area)118th of 210position · derived24.82023
- Forest Area within Legally Established Protected AreasFAO · Forest within legally established protected areas, as a share of the country's 2015 forest area (%)bottom 31%11.292025
- Mangrove AreaGlobal Mangrove Watch (Aberystwyth University, JAXA, soloEO, Wetlands International, The Nature Conservancy) · Mangrove forest area (hectares)bottom 9%24.72025
- Municipal Solid Waste GenerationWorld Bank Group · Municipal solid waste generated (kg per person per day)77th of 201position · derived · 1 = worst1.1942026
- Population Living Below 5 m ElevationCenter for International Earth Science Information Network (CIESIN), Columbia University · Population living below 5 m elevation (% of total population)top 6%28.682015
- Tree Cover LossWorld Resources Institute — Global Forest Watch (data: University of Maryland) · Tree cover loss (hectares, where canopy cover exceeded 30% in 2000)bottom 6%02025
Gender & Equality2
- Female-Headed HouseholdsUN DESA Population Division · Households headed by a woman (% of households)top 9%49.382026
- Sex Ratio at BirthUN DESA Population Division · Male births per 100 female birthsbottom 27%1042023
Mobility & Trade1
- Net Migration RateUN DESA Population Division · Net migrants per 1,000 populationbottom 1%-61.682023
Digital & Technology2
- GitHub DevelopersGitHub · Developer accounts located in the economy (as of quarter end)bottom 2%3752026
- GitHub RepositoriesGitHub · Public repositories located in the economy (as of quarter end)bottom 4%5082026
People & Population15
- Average Household SizeUN DESA Population Division · Average number of usual residents per household (people)bottom 16%2.442026
- Crude Birth RateUN DESA Population Division · Births per 1,000 populationtop 40%17.072023
- Crude Death RateUN DESA Population Division · Deaths per 1,000 populationtop 26%9.2822023
- Mean Age at ChildbearingUN DESA Population Division · Mean age of mothers at the birth of their children (years)top 20%30.832023
- Median Age of the PopulationUN DESA Population Division · Median age (years)top 24%39.362023
- One-Person HouseholdsUN DESA Population Division · Households with exactly one member (% of households)top 14%31.252026
- Population Aged 65 and OverUN DESA Population Division · Share of the total population aged 65 and over (%)top 23%17.22023
- Population DensityUN DESA Population Division · People per square kilometre of landtop 11%519.142023
- Population Growth RateUN DESA Population Division · Population growth (% per year)bottom 1%-5.3982023
- Population Living in Cities (Degree of Urbanisation)UN DESA Population Division · Share of the population living in cities as the Degree of Urbanisation defines them (%)bottom 8%02025
- Population Under Age 15UN DESA Population Division · Share of the total population aged 0–14 (%)bottom 45%21.132023
- Sex Ratio of the Total PopulationUN DESA Population Division · Males per 100 femalesbottom 4%87.712023
- Total Dependency RatioUN DESA Population Division · People aged 0–14 and 65+ per 100 people aged 15–64top 29%62.162023
- Total Fertility RateUN DESA Population Division · Live births per womantop 30%2.7182023
06Method
Sources and how to read them
How to read this page
- The scores and ranks belong to their publishers. Nothing is adjusted, rescaled or re-ranked; each is reproduced from the edition named beside it. Where a row says position · derived, the publisher ranks nobody on that measure and the position is ours, made by ordering the published score.
- Each statistic shows its newest edition, which is not always the edition the Country Index uses: the index pins every source to one data year so its average compares like with like.
How a standing is built from percentiles, why Saint Martin can move because other countries moved, and why publishers measure between 120 and 215 countries each are set out in full in how a standing is made and what a standing cannot tell you.
Sources
- Statistics: 9 publishers, each named beside its numbers, with every edition and licence on the datasets pages.
- Capital, languages, currency, codes: Wikidata, public domain (CC0).
- Map and land borders: Natural Earth, public domain. Borders are de facto — where administration actually changes — not claimed.
Photographs
The photograph of Saint Martin on this page comes from Wikimedia Commons and is shown in greyscale. The photographer and the licence are named beside each one.
Cite this page
Nations Inquiry (2026). Saint Martin: country statistics, rankings and trends. https://nationsinquiry.com/countries/saint-martin