
Photo: Pat Hawks derivative work: Jjtkk · CC BY 3.0 · via Wikimedia Commons, shown in greyscale
Montserrat places highest on Container Import Dwell Time (top 2% worldwide) and lowest on Renewable Share of Electricity Generation (bottom 1%).
Share
Montserrat in the Nations Inquiry Country Index
Montserrat appears in 74 of the statistics tracked here, but is not placed in the Country Index: the index needs a standing on three quarters of its topics, and Montserrat is measured on too few of them. Every published reading below is unaffected.
At a glance
Population
4,420
people
since 1950
Land area
102
km²
since 1961
Life expectancy
76.19
years at birth
since 1950
The newest published figure for each, the year it describes and who published it, with a line showing how it has moved.
01The country
About Montserrat
Montserrat, a British Overseas Territory in the Leeward Islands, is a pear-shaped volcanic island with an elected Legislative Assembly and a governor appointed in London. Three groups of hills shape it: the Silver Hills in the north; the forested Centre Hills, where the black-and-yellow Montserrat oriole, found nowhere else, lives; and the Soufrière Hills in the south, whose volcano woke in July 1995. Where its ash flows reached the sea they built new land, and scientists at Flemmings keep watch over it.
To the Kalinago it was Alliouagana, ‘land of the prickly bush’; Columbus, sailing past in November 1493, named it after the mountain monastery of Montserrat near Barcelona. Irish Catholics, many from St Kitts, settled from 1632, and visitors’ passports are stamped with a shamrock in their memory. Enslaved Africans were shipped in to work the cane; a rising planned for St Patrick’s Day 1768 was betrayed, and the holiday honours its leaders too. Later eruptions buried Plymouth, the main town, and drove many islanders to Britain.
St Patrick’s week brings masquerade dancers and fife bands, and goat water, the thick stew that is the national dish. Arrow’s calypso Hot Hot Hot, recorded in 1982, became a worldwide hit. George Martin, the Beatles’ producer, opened AIR Montserrat in 1979, and the Police, Dire Straits and Elton John recorded there until Hurricane Hugo wrecked it in 1989. Sand and gravel from the volcano’s valleys are shipped to other islands, and British aid funds much of the budget.
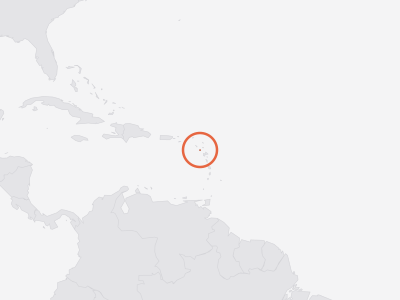
Key facts about Montserrat
- Capitals
- Brades, Plymouth
- Official language
- English
- Currency
- Eastern Caribbean dollar (XCD)
- ISO code
- MSR · MS
- Domain · dialling
- .ms · +1664
As Wikidata records them. Official languages are the least consistent — some countries list only a national language, others every regional one. Sources and licences.
02Country Index 2026
Where it stands, topic by topic
Strongest first. Each position is Montserrat’s place among the countries with a standing on that topic, built from a few key statistics chosen to measure different things.
joint67thof 200
From 2 of 4 key statistics
96thof 198
From 3 of 4 key statistics
163rdof 165
From 2 of 3 key statistics
No standing — Montserrat holds too few of this subject’s key statistics to be placed on it.
No standing — Montserrat holds too few of this subject’s key statistics to be placed on it.
No standing — Montserrat holds too few of this subject’s key statistics to be placed on it.
No standing — Montserrat holds too few of this subject’s key statistics to be placed on it.
No standing — Montserrat holds too few of this subject’s key statistics to be placed on it.
No standing — Montserrat holds too few of this subject’s key statistics to be placed on it.
No standing — Montserrat holds too few of this subject’s key statistics to be placed on it.
No standing — Montserrat holds too few of this subject’s key statistics to be placed on it.
No standing — Montserrat holds too few of this subject’s key statistics to be placed on it.
No standing — Montserrat holds too few of this subject’s key statistics to be placed on it.
No standing — Montserrat holds too few of this subject’s key statistics to be placed on it.
No standing — Montserrat holds too few of this subject’s key statistics to be placed on it.
No standing — Montserrat holds too few of this subject’s key statistics to be placed on it.
Each standing is built from a few key statistics chosen to measure different things. Select a subject for Montserrat’s readings on it, or see every statistic held for Montserrat in the table further down this page.
03Highs and lows
Where Montserrat stands out
The two ends of its own record: every statistic on which Montserrat sits within ten places of the best or worst in the world, plus its strongest and weakest readings overall. Each is turned into a percentile — its place among every country measured — which is what lets a hunger score and a press-freedom rank be compared at all.
Where Montserrat does best5
In the top third of all countries measured. 3 are within ten places of the best in the world, in a field of at least 50 countries — marked with that place.
- 1st
Position · derived 1st of 84 · 100 · 2023
world median 99.3 (better) · ▲ 58 pts since 2013
- 5th
Position · derived 152nd of 156 · 1 = worst · 1.2 · 2024
world median 4.4 (better)
- 7th
Position · derived 7th of 123 · 7.19 · 2023
world median 3.709 (better) · ▲ 18 pts since 2013
Not ranked by the publisher · 100 · 2025
world median 98.4 (better)
- PM2.5 Air Pollution Exposuretop 15%
Position · derived 187th of 220 · 1 = worst · 6.7 · 2023
world median 14.45 (better) · ▲ 6 pts since 2013
Where Montserrat struggles most5
In the bottom third of all countries measured. 3 are within ten places of the worst in the world, in a field of at least 50 countries — marked with that place.
- 1st
Position · derived 162nd of 162 · 0 · 2024
world median 37.32 (worse) · ▼ 7 pts since 2014
- 1st
Position · derived 162nd of 162 · 0 · 2024
world median 32.06 (worse) · ▼ 7 pts since 2014
- 10thCarbon Intensity of Electricitybottom 5%
Position · derived 10th of 165 · 1 = worst · 700 · 2024
world median 433.75 (worse) · ▼ 2 pts since 2014
Not ranked by the publisher · 0 · 2024
world median 5.279 (worse) · ▼ 18 pts since 2014
- CO₂ Emissions per Capitabottom 24%
Position · derived 52nd of 210 · 1 = worst · 6.056 · 2024
world median 3.21 (worse) · ▲ 10 pts since 2014
A band is a place among the countries each publisher scores, so Montserrat can move because other countries moved. See the Country Index for the full method.
04In context
Montserrat and its neighbours
A position reads best beside the countries around it. Every position below is a place in the world ranking, not within the region.
Shares a land border with
Montserrat has no land border with another country.
Across Caribbean
Every country in the sub-region, by its position in the world.
- 67
 Barbados
- 68
 Saint Lucia
- =71
 Dominican Republic
- =71
 Saint Vincent and the Grenadines
- =76
 Jamaica
- 81
 Antigua and Barbuda
- 85
 Grenada
- 90
 Trinidad and Tobago
- =104
 Bahamas
- 119
 Cuba
- 173
 Haiti
- —
 Anguillanot placed
- —
 Arubanot placed
- —
 British Virgin Islandsnot placed
- —
 Cayman Islandsnot placed
- —
 Curaçaonot placed
- —
 Dominicanot placed
- —
 Montserratnot placed
- —
 Puerto Riconot placed
- —
 Saint Kitts and Nevisnot placed
- —
 Saint Martinnot placed
- —
 Sint Maartennot placed
- —
 Turks and Caicos Islandsnot placed
- —
 United States Virgin Islandsnot placed
05The evidence
Every statistic we hold for Montserrat
Grouped by topic. Each row gives the newest edition’s rank or position, the published value and the year the numbers describe. Select a statistic for this country’s row beside every other country, the world median and every edition.
Governance & Institutions5
- Central Bank Independence IndexAna Carolina Garriga, University of Essex · CBI index (0–1, where 1 is the most statutory independence)top 42%0.6332023
- Completeness of Birth RegistrationUNICEF · Children under 5 whose birth is registered (%)top 14%1002025
- Government Spending on EducationUIS · Government expenditure on education (% of GDP)7th of 123position · derived7.192023
- Old-Age Pension CoverageILO · People above statutory pensionable age receiving an old-age pension (%)top 15%1002025
Economy & Innovation10
- Actual Individual Consumption per Capita (PPP)World Bank Group · Actual individual consumption per capita (PPP, current international $)47th of 173position · derived23,9622021
- Creative Services ExportsUNCTAD · Creative services exports (% of services exports)bottom 37%3.3622024
- Digitally-Deliverable Services ExportsUNCTAD · Digitally-deliverable services exports (% of services exports)125th of 170position · derived12.342024
- Export Concentration IndexUNCTAD · Export concentration index (0–1, normalised Herfindahl–Hirschman)bottom 42%0.2732025
- Foreign Direct Investment InflowsUNCTAD · FDI inflows (% of GDP)bottom 42%1.5742025
- Price Level of Household ConsumptionGGDC · Price level of household consumption (US output price level in 2021 = 1)top 35%0.6332023
- Scholarly ArticlesOurResearch · Articles with at least one author at an institution in the country (full counting)bottom 5%132025
- Services ExportsUNCTAD · Services exports (% of GDP)top 21%22.612025
- Statutory Corporate Income Tax RateOECD · Combined statutory corporate income tax rate, central and sub-central government (%)top 11%302026
- Terms of Trade IndexUNCTAD · Terms of trade index (2015 = 100)bottom 6%77.552025
Education & Knowledge2
- Primary Schools with ElectricityUIS · Primary schools with access to electricity (%)top 30%1002024
- Primary Schools with Internet for TeachingUIS · Primary schools with internet access for teaching (%)top 22%1002024
Health & Wellbeing15
- Adolescent Birth Rate (Ages 15–19)UN DESA Population Division · Live births per 1,000 women aged 15–19153rd of 222position · derived · 1 = worst12.322023
- Adult Mortality (Probability of Dying Between 15 and 60)UN DESA Population Division · Deaths before age 60 per 1,000 people alive at 15, at that year's death rates148th of 222position · derived · 1 = worst94.042023
- Births Attended by Skilled Health StaffUNICEF and WHO (Joint Database on Skilled Birth Attendance) · Births attended by skilled health staff (%)1st of 84position · derived1002023
- Contraceptive Prevalence (Any Method)UN DESA Population Division · Share of all women aged 15–49 using any contraceptive method (%)top 45%43.22023
- Days Above 35°CECMWF · Days a year with a maximum temperature above 35°C, averaged over the country’s landtop 16%02025
- Demand for Family Planning Satisfied by Modern MethodsUN DESA Population Division · Share of women aged 15–49 wanting to avoid pregnancy who use a modern method (%)63rd of 196position · derived77.52023
- Infant Mortality RateUN IGME · Deaths before age one (per 1,000 live births)143rd of 200position · derived · 1 = worst6.0632024
- Life Expectancy at Age 65UN DESA Population Division · Further years a 65-year-old would live at current death rates128th of 222position · derived15.852023
- Life Expectancy at BirthUN DESA Population Division · Years a newborn would live at current death rates95th of 222position · derived76.192023
- Modern Contraceptive PrevalenceUN DESA Population Division · Share of all women aged 15–49 using a modern contraceptive method (%)top 39%41.62023
- Mortality Rate, Ages 5–14UN IGME · Deaths between ages 5 and 14 (per 1,000 children aged 5)145th of 200position · derived · 1 = worst1.5822024
- Neonatal Mortality RateUN IGME · Deaths in the first 28 days (per 1,000 live births)152nd of 200position · derived · 1 = worst3.2992024
- PM2.5 Air Pollution ExposureAtmospheric Composition Analysis Group, Washington University in St. Louis · Population-weighted PM2.5 concentration (µg/m³)187th of 220position · derived · 1 = worst6.72023
- Stillbirth RateUN IGME · Stillbirths (per 1,000 total births)82nd of 200position · derived · 1 = worst9.252023
- Under-Five Mortality RateUN IGME · Deaths before age five (per 1,000 live births)147th of 200position · derived · 1 = worst6.3542024
Environment & Sustainability13
- Burned AreaGWIS · Burned area (hectares)bottom 12%02025
- Carbon Intensity of ElectricityEmber · Carbon intensity (gCO₂e per kWh generated)10th of 165position · derived · 1 = worst7002024
- CO₂ Emissions per CapitaGlobal Carbon Project · Fossil CO₂ (tonnes per person)52nd of 210position · derived · 1 = worst6.0562024
- Coal Share of Electricity GenerationEmber · Coal (% of electricity generated)top 32%02024
- Fisheries and Aquaculture ProductionFAO · Fish, crustaceans, molluscs and other aquatic animals caught or farmed, tonnes (live weight)bottom 3%302024
- Low-Carbon Share of Electricity GenerationEmber · Low-carbon sources (% of electricity generated)162nd of 162position · derived02024
- Methane EmissionsEDGAR · Methane emissions (gigagrams of CH₄)bottom 6%0.6242025
- Renewable Share of Electricity GenerationEmber · Renewables (% of electricity generated)162nd of 162position · derived02024
- Solar Electricity Installed CapacityEIA · Solar generating capacity installed (gigawatts)bottom 6%0.0012024
- Solar Share of Electricity GenerationEmber · Solar (% of electricity generated)bottom 5%02024
- Tree Cover LossWorld Resources Institute — Global Forest Watch (data: University of Maryland) · Tree cover loss (hectares, where canopy cover exceeded 30% in 2000)bottom 6%02025
- Tropical Moist Forest DeforestationJRC · Tropical moist forest deforested in the year (million hectares)bottom 23%02025
- Wind and Solar Share of Electricity GenerationEmber · Wind and solar (% of electricity generated)bottom 5%02024
Gender & Equality2
- Mean Age at First Marriage, WomenUN DESA Population Division · Singulate mean age at marriage, women (years)top 8%31.92019
- Sex Ratio at BirthUN DESA Population Division · Male births per 100 female birthsbottom 33%104.32023
Mobility & Trade5
- Container Import Dwell TimeWorld Bank Group · Median days a full import container waits in port152nd of 156position · derived · 1 = worst1.22024
- EmigrantsUN DESA Population Division · Migrants from the country living abroad, mid-year (people)bottom 10%3,3412024
- International MigrantsUN DESA Population Division · International migrants living in the country, mid-year (people)bottom 1%1,4022024
- Net Migration RateUN DESA Population Division · Net migrants per 1,000 populationbottom 20%-2.7152023
Energy7
- Crude Oil ProductionEIA · Crude oil produced (thousand barrels per day)bottom 26%02025
- Gas Share of Electricity GenerationEmber · Natural gas (% of electricity generated)bottom 22%02024
- Hydro Share of Electricity GenerationEmber · Hydropower (% of electricity generated)bottom 13%02024
- Natural Gas ProductionEIA · Dry natural gas produced (billion cubic metres)bottom 27%02024
- Net Electricity Imports (share of generation)Ember · Net electricity imports (% of domestic generation)bottom 42%02024
- Nuclear Share of Electricity GenerationEmber · Nuclear (% of electricity generated)bottom 45%02024
- Primary Energy ProductionEIA · Primary energy produced (quadrillion Btu)bottom 1%02024
Digital & Technology2
- GitHub DevelopersGitHub · Developer accounts located in the economy (as of quarter end)bottom 1%1242026
- GitHub RepositoriesGitHub · Public repositories located in the economy (as of quarter end)bottom 1%1422026
People & Population13
- Crude Birth RateUN DESA Population Division · Births per 1,000 populationbottom 18%8.9332023
- Crude Death RateUN DESA Population Division · Deaths per 1,000 populationtop 4%13.692023
- Mean Age at ChildbearingUN DESA Population Division · Mean age of mothers at the birth of their children (years)top 32%29.952023
- Median Age of the PopulationUN DESA Population Division · Median age (years)top 16%41.552023
- Population Aged 65 and OverUN DESA Population Division · Share of the total population aged 65 and over (%)top 17%19.182023
- Population DensityUN DESA Population Division · People per square kilometre of landbottom 26%42.922023
- Population Growth RateUN DESA Population Division · Population growth (% per year)bottom 7%-0.7012023
- Population Living in Cities (Degree of Urbanisation)UN DESA Population Division · Share of the population living in cities as the Degree of Urbanisation defines them (%)bottom 8%02025
- Population Under Age 15UN DESA Population Division · Share of the total population aged 0–14 (%)bottom 26%16.822023
- Sex Ratio of the Total PopulationUN DESA Population Division · Males per 100 femalestop 37%99.662023
- Total Dependency RatioUN DESA Population Division · People aged 0–14 and 65+ per 100 people aged 15–64top 46%56.262023
- Total Fertility RateUN DESA Population Division · Live births per womanbottom 21%1.4442023
06Method
Sources and how to read them
How to read this page
- The scores and ranks belong to their publishers. Nothing is adjusted, rescaled or re-ranked; each is reproduced from the edition named beside it. Where a row says position · derived, the publisher ranks nobody on that measure and the position is ours, made by ordering the published score.
- Each statistic shows its newest edition, which is not always the edition the Country Index uses: the index pins every source to one data year so its average compares like with like.
How a standing is built from percentiles, why Montserrat can move because other countries moved, and why publishers measure between 120 and 215 countries each are set out in full in how a standing is made and what a standing cannot tell you.
Sources
- Statistics: 23 publishers, each named beside its numbers, with every edition and licence on the datasets pages.
- Capital, languages, currency, codes: Wikidata, public domain (CC0).
- Map and land borders: Natural Earth, public domain. Borders are de facto — where administration actually changes — not claimed.
Photographs
The photograph of Montserrat on this page comes from Wikimedia Commons and is shown in greyscale. The photographer and the licence are named beside each one.
Cite this page
Nations Inquiry (2026). Montserrat: country statistics, rankings and trends. https://nationsinquiry.com/countries/montserrat