EIA · Solar Electricity Installed Capacity
Solar power capacity by country
How much solar generating capacity has a country installed?
Of the 209 countries compared in 2024, China had the highest reading, 886.660000, and 6 countries shared the lowest reading, 0.000000. In the middle country the figure was 0.144000. Among the 201 countries measured in every edition since 2000, the middle one moved from 0.000000 to 0.163000.
Share
Solar power capacity · 2024
Context statistic

Highest of 209China
886.660000012024 · values only
The highest and the lowest
The three countries with the highest values of 209 compared, the three with the lowest, and the highest on each continent. This statistic has no better end, so no country is shown as leading.
- 1
- 2

- 3

Lowest in 2024
 Turkmenistan0.000000
 Macau0.000000
 Kyrgyzstan0.000000
This statistic has no better end: the two ends describe size, not success.
Highest on each continent
- Africa
 South Africa6.671000
 - AmericasUnited States176.681900
- AsiaChina886.660000
- Europe
 Germany89.943000
 - Oceania
 Australia38.472000
 - Every region
02Every measured country
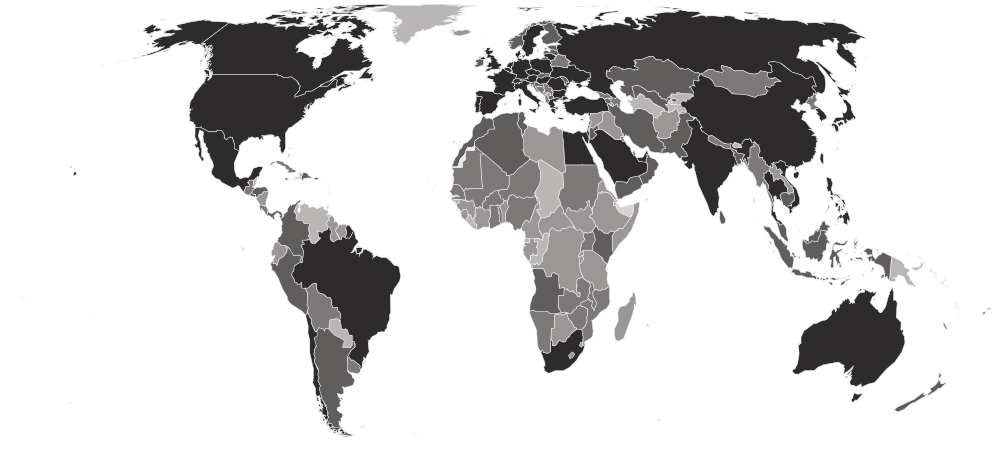
Solar power capacity on a map
Each country is shaded by its value, in five groups holding the same number of countries. Hover a country for its value, or select it to open its profile. Below the map, each continent’s middle country.
Darker is a higher value. This statistic has no better end, so the shades describe size, not success.
- 0.000000–0.007000
- 0.007001–0.063000
- 0.066000–0.333000
- 0.344000–2.306000
- 2.554000–886.660000
- No reading in 2024
- Europe
1.947000
the middle country, of 42 measured · 49 members
Germany89.943000 Gibraltar0.000000
Highest and lowest reading in Europe.
- Asia
0.724000
the middle country, of 51 measured · 52 members
China886.6600003 share 0.000000
Highest and lowest reading in Asia.
- Africa
0.040000
the middle country, of 54 measured · 55 members
South Africa6.671000 Equatorial Guinea0.000000
Highest and lowest reading in Africa.
- Americas
0.031000
the middle country, of 44 measured · 48 members
United States176.681900 Bermuda0.000000
Highest and lowest reading in Americas.
- Oceania
0.006500
the middle country, of 18 measured · 21 members
Australia38.4720002 share 0.002000
Highest and lowest reading in Oceania.
- Every region
22 sub-regions, highest middle country first
- Western Europe
9.752000
the middle country, of 7 measured · 9 members
Germany89.943000 Luxembourg0.523000
Highest and lowest reading in Western Europe.
- Eastern Asia
7.307072
the middle country, of 8 measured · 8 members
China886.660000Macau0.000000Highest and lowest reading in Eastern Asia.
- Eastern Europe
4.033500
the middle country, of 10 measured · 10 members
 Poland20.199000
 Belarus0.265000
Highest and lowest reading in Eastern Europe.
- Northern Europe
1.326000
the middle country, of 11 measured · 13 members
 United Kingdom17.603000
 Faroe Islands0.000261
Highest and lowest reading in Northern Europe.
- South-eastern Asia
0.878000
the middle country, of 11 measured · 11 members
 Vietnam18.667000
 Timor-Leste0.000470
Highest and lowest reading in South-eastern Asia.
- Southern Asia
0.782000
the middle country, of 9 measured · 9 members
India97.384000 Bhutan0.003000
Highest and lowest reading in Southern Asia.
- Northern Africa
0.617500
the middle country, of 6 measured · 6 members
 Egypt2.590000
 Libya0.008000
Highest and lowest reading in Northern Africa.
- Western Asia
0.578500
the middle country, of 18 measured · 19 members
 Türkiye19.883000
 Iraq0.042000
Highest and lowest reading in Western Asia.
- Southern Europe
0.570000
the middle country, of 14 measured · 17 members
 Spain38.587000Gibraltar0.000000
Highest and lowest reading in Southern Europe.
- Central America
0.328000
the middle country, of 8 measured · 8 members
 Mexico11.992000
 Belize0.007000
Highest and lowest reading in Central America.
- South America
0.253500
the middle country, of 12 measured · 12 members
 Brazil53.113000
 Paraguay0.001000
Highest and lowest reading in South America.
- Western Africa
0.053500
the middle country, of 16 measured · 16 members
 Senegal0.273000
 Guinea-Bissau0.002000
Highest and lowest reading in Western Africa.
- Eastern Africa
0.038000
the middle country, of 18 measured · 19 members
 Kenya0.369000
 Djibouti0.000362
Highest and lowest reading in Eastern Africa.
- Southern Africa
0.029000
the middle country, of 5 measured · 5 members
South Africa6.671000 Botswana0.010000
Highest and lowest reading in Southern Africa.
- Middle Africa
0.012000
the middle country, of 9 measured · 9 members
 Angola0.362000Equatorial Guinea0.000000
Highest and lowest reading in Middle Africa.
- Caribbean
0.009500
the middle country, of 20 measured · 24 members
 Dominican Republic1.423000
 Dominica0.000315
Highest and lowest reading in Caribbean.
- Polynesia
0.007000
the middle country, of 7 measured · 7 members
 French Polynesia0.073000
 Niue0.002000
Highest and lowest reading in Polynesia.
- Melanesia
0.006000
the middle country, of 5 measured · 5 members
 New Caledonia0.215000
 Papua New Guinea0.005000
Highest and lowest reading in Melanesia.
- Central Asia
0.000220
the middle country, of 5 measured · 5 members
 Uzbekistan2.275000
2 share 0.000000
Highest and lowest reading in Central Asia.
- Australia and New Zealand
2 of 2 measured — too few for a middle: Australia, New Zealand.
Australia38.472000 New Zealand0.570000
Highest and lowest reading in Australia and New Zealand.
- Micronesia
4 of 7 measured — too few for a middle: Guam, Kiribati, Micronesia, Nauru.
 Guam0.105000
 Kiribati0.002000
Highest and lowest reading in Micronesia.
- Northern America
4 of 4 measured — too few for a middle: Bermuda, Canada, Greenland, United States.
United States176.681900Bermuda0.000000Highest and lowest reading in Northern America.
03The whole field at once
The spread
209 countries, one dot each, on one scale — further right is a higher value. Half the countries are above 0.144000; a quarter are above 1.309000, and a quarter below 0.016000. The bar in each row marks that continent’s middle country.
04All 209 ever measured
Every country
In order, highest value first. No rank or position is shown: too many countries share the same value for an order to mean anything. Neither end is better: this is a size, so large economies lead. Capacity is not output — the same panel produces less under cloud than in a desert — and countries report panel capacity in different ways, so read small differences with care.
Showing 25 of 209 countries


































































































































































Values for 2024. The change column compares 2024 with 2023 only; the sparkline covers the recent editions.
052000–2024 · 25 editions
Over time
Each point is one year from 2000. Installed capacity only falls when panels are retired, so the slope shows how fast a country has been building; most countries start from zero.
- the middle country
- the middle half of countries
- the middle of the 201 countries measured every time
- each continent’s middle country
The same, year by year
| Year | Countries | Middle country | Middle half | Measured every time |
|---|---|---|---|---|
| 2024 | 209 | 0.144000 | 0.016000 – 1.309000 | 0.163000 |
| 2023 | 207 | 0.129000 | 0.015000 – 0.956500 | 0.134000 |
| 2022 | 207 | 0.104680 | 0.010465 – 0.636693 | 0.104808 |
| 2021 | 207 | 0.073741 | 0.006948 – 0.492784 | 0.087509 |
| 2020 | 207 | 0.052692 | 0.005100 – 0.383300 | 0.058600 |
| 2019 | 207 | 0.039700 | 0.005100 – 0.335900 | 0.041800 |
| 2018 | 207 | 0.028000 | 0.003650 – 0.238700 | 0.028900 |
| 2017 | 207 | 0.016700 | 0.002650 – 0.165950 | 0.016800 |
| 2016 | 207 | 0.013000 | 0.002000 – 0.093150 | 0.013400 |
| 2015 | 207 | 0.008000 | 0.001100 – 0.066750 | 0.008200 |
| 2014 | 207 | 0.005000 | 0.000850 – 0.026750 | 0.005000 |
| 2013 | 207 | 0.002600 | 0.000400 – 0.017450 | 0.002900 |
| 2012 | 207 | 0.001400 | 0.000100 – 0.010550 | 0.001400 |
| 2011 | 206 | 0.000800 | 0.000000 – 0.006075 | 0.000800 |
| 2010 | 206 | 0.000300 | 0.000000 – 0.003700 | 0.000300 |
| 2009 | 206 | 0.000100 | 0.000000 – 0.002475 | 0.000100 |
| 2008 | 206 | 0.000100 | 0.000000 – 0.001975 | 0.000100 |
| 2007 | 205 | 0.000000 | 0.000000 – 0.001200 | 0.000000 |
| 2006 | 205 | 0.000000 | 0.000000 – 0.001000 | 0.000000 |
| 2005 | 203 | 0.000000 | 0.000000 – 0.000900 | 0.000000 |
| 2004 | 203 | 0.000000 | 0.000000 – 0.000550 | 0.000000 |
| 2003 | 203 | 0.000000 | 0.000000 – 0.000300 | 0.000000 |
| 2002 | 202 | 0.000000 | 0.000000 – 0.000200 | 0.000000 |
| 2001 | 202 | 0.000000 | 0.000000 – 0.000100 | 0.000000 |
| 2000 | 201 | 0.000000 | 0.000000 – 0.000100 | 0.000000 |
062023 → 2024
Who rose and fell
The biggest changes in value between the two newest editions. Places are shown second, because they also move when other countries do.
Rose most
before → after- China609.921000 → 886.660000+276.739000
- United States139.772500 → 176.681900+36.909400
- India72.859000 → 97.384000+24.525000
- Brazil37.940000 → 53.113000+15.173000
- Germany74.882000 → 89.943000+15.061000
Fell most
before → after Ukraine8.062000 → 5.500000−2.562000
 Kazakhstan1.306000 → 1.196000−0.110000
- Belarus0.273000 → 0.265000−0.008000
207 countries were measured in both 2023 and 2024. The field changed from 207 to 209 countries, so a place can move for reasons that have nothing to do with the country itself.
07Across every edition
Solar power capacity in records
The extremes of the statistic. A record reached by more than one country names none of them.
Highest reading on record
886.660000
Solar generating capacity installed (gigawatts)
Lowest reading on record
Reached 1540 times by 154 countries — shared, so no holder is named
0.000000
Solar generating capacity installed (gigawatts)
Biggest rise between editions
+276.739000
609.921000 → 886.660000
Biggest fall between editions
−2.562000
8.062000 → 5.500000
Biggest change since first measured
+886.626500
0.033500 → 886.660000
Highest most often
2 countries share this record — no holder is named
10 of 25
editions
08The measure
About solar power capacity
This is how much solar generating capacity a country has installed, in gigawatts — the combined rated output of its solar panels and solar thermal plants. The U.S. Energy Information Administration compiles it for every country each year.
What the number is: Solar generating capacity installed (gigawatts).
09Where it fits
Connections
Its part in the Country Index, the statistics whose values line up most closely with it across countries, and others on the same subject.
In the Country Index
Context, with no vote
This statistic is published in full under Environment & Sustainability and Energy, but does not help decide any Country Index standing.
Environment & SustainabilityEnergyWhich statistics vote, and why
Moves with
Where solar power capacity is higher, these tend to be higher too.
- GitHub DevelopersGitHub · 206 countries in commonρ 0.86
- GitHub RepositoriesGitHub · 205 countries in commonρ 0.85
- GitHub Git PushesGitHub · 180 countries in commonρ 0.84
Moves against
Where solar power capacity is higher, these tend to be lower.
- Export Concentration IndexUNCTAD · 206 countries in commonρ −0.60
- Prevalence of UndernourishmentFAO · 165 countries in commonρ −0.60
- Prevalence of Severe Food InsecurityKeyFAO · 132 countries in commonρ −0.60
Rank correlation (ρ, from −1 to 1) across countries, on each statistic’s newest edition, out of 384 statistics sharing at least 80 countries with this one. Two statistics that move together do not cause each other.
10Keep reading
Explore further
The subject
The countries at either end
11Questions
Solar power capacity: questions and answers
Which country has the highest solar power capacity?
China, at 886.660000, among the 209 countries compared in 2024.
Which country has the lowest solar power capacity?
6 countries share the lowest reading, 0.000000, among the 209 compared in 2024, so no single country is named.
How many countries does the Solar Electricity Installed Capacity cover?
209 in 2024. The number measured varies from 201 to 209 between editions.
What is the world average solar power capacity?
This site does not calculate a world average, which would depend on how countries are weighted. In the middle country of the 209 compared in 2024, the figure was 0.144000.
Is this U.S. Energy Information Administration (EIA)’s own ranking?
No ranking is shown. U.S. Energy Information Administration (EIA) publishes values only, and too many countries share the same value for an ordering to mean anything, so none is derived.
How often is the Solar Electricity Installed Capacity published?
This site holds 25 editions, describing 2000 to 2024.
Where does the data come from, and can I download it?
From U.S. Energy Information Administration (EIA), under Public domain (U.S. government work). From the U.S. Energy Information Administration’s International Energy Statistics, read from its public bulk download. The figures are the agency’s own estimates and differ from other compilers’, so they should not be mixed with them. Every edition is on this site’s Datasets pages as a full table, and downloads as a CSV file with every value unrounded.
12Method
Sources, method and citation
Source
Solar Electricity Installed Capacity — U.S. Energy Information Administration (EIA)
From the U.S. Energy Information Administration’s International Energy Statistics, read from its public bulk download. The figures are the agency’s own estimates and differ from other compilers’, so they should not be mixed with them.
Newest edition
Report year 2024Data year 2024
Cite the source as: Source: U.S. Energy Information Administration (Feb 2026). International Energy Statistics — Solar electricity installed capacity (million kilowatts).
Licence: Public domain (U.S. government work), checked 2026-10-03.
How this page reads the numbers
- No rank or position is shown: U.S. Energy Information Administration (EIA) publishes values only, and too many countries share the same value for an ordering to mean anything.
- This statistic has no better end, so the page describes higher and lower values and never calls a country a leader.
- A country is named at an end only when it holds that value alone. Where several share it, the page says how many and names none first.
- Values are stored exactly as published and trimmed only for display. “The middle country” is the median of the countries measured, not a world average.
The file itself, column by column — where it came from, what each column holds, and every edition as a CSV — is on its dataset page.
Cite this page
Nations Inquiry (2026). Solar power capacity by country: Solar Electricity Installed Capacity, data from U.S. Energy Information Administration (EIA). https://nationsinquiry.com/statistics/solar-capacity