Loading…
EIA · Energy Intensity of GDP (PPP)
Energy intensity by country
How much energy does a country use to produce each dollar of its economy?
Of the 192 countries compared in 2024, Chad had the lowest reading, 0.6661, and Turkmenistan had the highest reading, 17.4532. In the middle country the figure was 2.7382. Among the 148 countries measured in every edition since 1988, the middle one moved from 2.9244 to 2.6686.
Energy intensity · 2024
Context statistic

Lowest of 192Chad
0.6661012024 · values only
Who leads
The three countries at the lowest end of 192 compared, the three at the other end, and the first on each continent.
 1
1Photo: File: Robertgrafl derivative work: Jjtkk · Public domain, greyscale
 2
2 3
3Photo: Diego Delso · CC BY-SA 3.0, greyscale
Highest in 2024
 Turkmenistan17.4532
 North Korea16.8088
 Libya11.7427
Where a country sits says how it compares with the others measured, and nothing about why.
02Every measured country
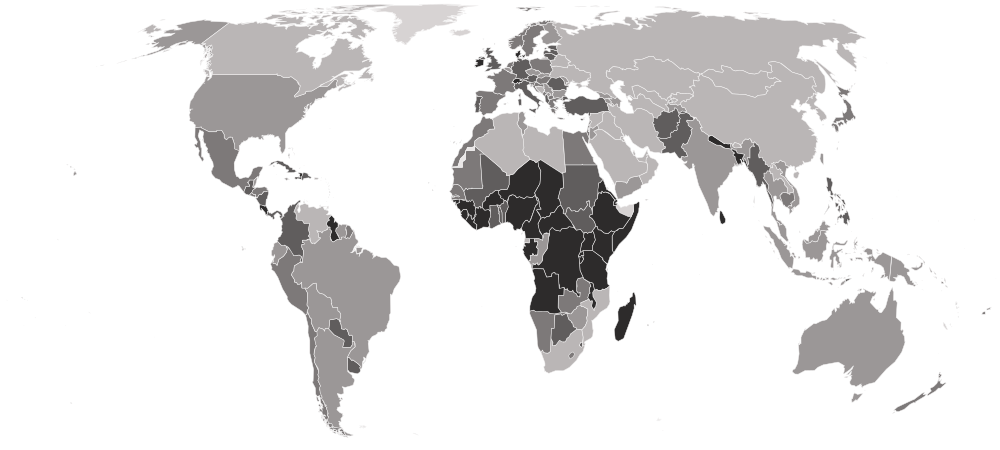
Energy intensity on a map
Each country is shaded by its value, in five groups holding the same number of countries. Hover a country for its value, or select it to open its profile. Below the map, each continent’s middle country.
Darker is a lower value — the better end.
- 4.3416–17.4532
- 3.1385–4.3272
- 2.2853–3.1096
- 1.7335–2.2832
- 0.6661–1.7179
- No reading in 2024 (2 measured in an earlier edition)
- Africa
1.8476
the middle country, of 54 measured · 55 members
Chad0.6661Libya11.7427Lowest and highest reading in Africa.
- Europe
2.6713
the middle country, of 39 measured · 49 members
 Ireland1.0434
 Russia7.9410
Lowest and highest reading in Europe.
- Americas
2.8964
the middle country, of 39 measured · 48 members
 Haiti0.7803
 Venezuela10.1717
Lowest and highest reading in Americas.
- Oceania
3.4861
the middle country, of 9 measured · 21 members
 New Zealand2.6840
 Vanuatu5.7862
Lowest and highest reading in Oceania.
- Asia
4.0797
the middle country, of 51 measured · 52 members
 Macau0.7036Turkmenistan17.4532
Lowest and highest reading in Asia.
- Every region
22 sub-regions, lowest middle country first
- Middle Africa
1.3840
the middle country, of 9 measured · 9 members
Chad0.6661 Equatorial Guinea4.4954
Lowest and highest reading in Middle Africa.
- Eastern Africa
1.4977
the middle country, of 18 measured · 19 members
 Somalia0.6915
 Mozambique4.5365
Lowest and highest reading in Eastern Africa.
- Western Africa
1.6088
the middle country, of 16 measured · 16 members
 Sierra Leone0.9819
 Senegal2.5034
Lowest and highest reading in Western Africa.
- Northern Europe
2.0661
the middle country, of 9 measured · 13 members
Ireland1.0434 Finland3.8302
Lowest and highest reading in Northern Europe.
- Western Europe
2.2066
the middle country, of 7 measured · 9 members
 Switzerland1.3871
 Belgium3.6388
Lowest and highest reading in Western Europe.
- Southern Asia
2.2201
the middle country, of 9 measured · 9 members
 Sri Lanka0.8576
 Iran9.2433
Lowest and highest reading in Southern Asia.
- Central America
2.3117
the middle country, of 8 measured · 8 members
 Costa Rica1.3640
 Belize3.5642
Lowest and highest reading in Central America.
- Southern Africa
2.3471
the middle country, of 5 measured · 5 members
 Botswana2.1001
 South Africa6.7555
Lowest and highest reading in Southern Africa.
- Southern Europe
2.6713
the middle country, of 13 measured · 17 members
 Albania1.9346
 Bosnia and Herzegovina5.2616
Lowest and highest reading in Southern Europe.
- South America
2.9464
the middle country, of 12 measured · 12 members
 Guyana1.0306Venezuela10.1717
Lowest and highest reading in South America.
- Caribbean
2.9799
the middle country, of 16 measured · 24 members
Haiti0.7803 Antigua and Barbuda5.0515
Lowest and highest reading in Caribbean.
- Northern Africa
3.0143
the middle country, of 6 measured · 6 members
 Sudan2.2832Libya11.7427
Lowest and highest reading in Northern Africa.
- South-eastern Asia
3.2762
the middle country, of 11 measured · 11 members
 Philippines2.0034
 Brunei6.9276
Lowest and highest reading in South-eastern Asia.
- Eastern Europe
3.6265
the middle country, of 10 measured · 10 members
 Romania1.7994Russia7.9410
Lowest and highest reading in Eastern Europe.
- Eastern Asia
4.0515
the middle country, of 8 measured · 8 members
Macau0.7036North Korea16.8088Lowest and highest reading in Eastern Asia.
- Western Asia
4.5590
the middle country, of 18 measured · 19 members
 Türkiye2.1151
 Bahrain9.7992
Lowest and highest reading in Western Asia.
- Central Asia
6.4538
the middle country, of 5 measured · 5 members
 Tajikistan4.0153Turkmenistan17.4532
Lowest and highest reading in Central Asia.
- Australia and New Zealand
2 of 2 measured — too few for a middle: Australia, New Zealand.
New Zealand2.6840 Australia4.3272
Lowest and highest reading in Australia and New Zealand.
- Melanesia
4 of 5 measured — too few for a middle: Fiji, Papua New Guinea, Solomon Islands, Vanuatu.
 Fiji2.7757Vanuatu5.7862
Lowest and highest reading in Melanesia.
- Micronesia
1 of 7 measured — too few for a middle: Kiribati.
 Kiribati3.4861
Lowest and highest reading in Micronesia.
- Northern America
3 of 4 measured — too few for a middle: Bermuda, Canada, United States.
 Bermuda1.1550
 Canada6.4306
Lowest and highest reading in Northern America.
- Polynesia
2 of 7 measured — too few for a middle: Samoa, Tonga.
 Samoa3.8442
 Tonga5.3670
Lowest and highest reading in Polynesia.
03The whole field at once
The spread
192 countries, one dot each, on one scale — further right is a higher value. Half the countries are above 2.7382; a quarter are above 4.0234, and a quarter below 2.0087. The bar in each row marks that continent’s middle country.
04All 194 ever measured
Every country
In order, lowest value first. No rank or position is shown: too many countries share the same value for an order to mean anything. The lowest readings are not the most efficient economies. The energy total counts fossil fuels, nuclear and renewable electricity but leaves out most wood, charcoal and crop waste burned for cooking and heat, so a poor country where households rely on firewood reads as using almost no energy. Compare countries at similar incomes, and expect the top of the table to be oil and gas producers and heavy industry.
Showing 25 of 194 countries















































































































































Values for 2024. The change column compares 2024 with 2023 only; the sparkline covers the recent editions.
051988–2024 · 37 editions
Over time
Each point is one year from 1988. The line falls as economies shift from heavy industry to services and as buildings, vehicles and power plants become more efficient; it can rise when an oil or heavy-industry sector grows faster than the rest of the economy, or when output collapses faster than heating and industry can adjust.
- the middle country
- the middle half of countries
- the middle of the 148 countries measured every time
- each continent’s middle country
The same, year by year
| Year | Countries | Middle country | Middle half | Measured every time |
|---|---|---|---|---|
| 2024 | 192 | 2.7382 | 2.0087 – 4.0234 | 2.6686 |
| 2023 | 192 | 2.7982 | 1.9405 – 3.9997 | 2.6898 |
| 2022 | 192 | 2.8552 | 1.9651 – 4.0399 | 2.6797 |
| 2021 | 192 | 2.9359 | 2.0842 – 4.1914 | 2.6137 |
| 2020 | 192 | 2.9144 | 1.9709 – 4.0685 | 2.6929 |
| 2019 | 192 | 2.9595 | 2.0324 – 4.2391 | 2.8006 |
| 2018 | 194 | 2.9419 | 2.0366 – 4.3251 | 2.7601 |
| 2017 | 194 | 3.0102 | 2.0786 – 4.3181 | 2.8927 |
| 2016 | 194 | 3.0376 | 2.0428 – 4.4097 | 2.8451 |
| 2015 | 194 | 3.0572 | 2.0691 – 4.4879 | 2.8685 |
| 2014 | 194 | 2.9879 | 1.9830 – 4.5438 | 2.8305 |
| 2013 | 194 | 3.1328 | 2.0727 – 4.6401 | 2.8732 |
| 2012 | 193 | 3.2090 | 2.0333 – 4.6199 | 3.0030 |
| 2011 | 192 | 3.2261 | 2.0653 – 4.6025 | 3.0379 |
| 2010 | 192 | 3.3190 | 2.1390 – 4.7124 | 3.0250 |
| 2009 | 192 | 3.2933 | 2.0939 – 4.9316 | 3.0570 |
| 2008 | 192 | 3.3177 | 2.0320 – 4.9312 | 3.0509 |
| 2007 | 191 | 3.4243 | 2.0246 – 4.9539 | 3.1274 |
| 2006 | 191 | 3.5044 | 2.1118 – 5.2066 | 3.1163 |
| 2005 | 189 | 3.5726 | 2.2363 – 5.2815 | 3.1583 |
| 2004 | 189 | 3.4900 | 2.0129 – 5.4601 | 3.1511 |
| 2003 | 189 | 3.5639 | 1.9641 – 5.5281 | 3.2528 |
| 2002 | 188 | 3.5630 | 2.0155 – 5.6785 | 3.1393 |
| 2001 | 186 | 3.4991 | 1.9522 – 5.5946 | 3.1846 |
| 2000 | 186 | 3.3724 | 1.9080 – 5.4035 | 3.1079 |
| 1999 | 186 | 3.2724 | 1.7350 – 5.5038 | 3.0337 |
| 1998 | 185 | 3.2907 | 1.7132 – 5.7673 | 3.0296 |
| 1997 | 185 | 3.2658 | 1.7329 – 5.8844 | 2.9670 |
| 1996 | 184 | 3.2501 | 1.8117 – 5.8144 | 2.9722 |
| 1995 | 183 | 3.2947 | 1.8023 – 5.8850 | 3.0194 |
| 1994 | 181 | 3.2675 | 1.7270 – 5.8274 | 3.0790 |
| 1993 | 180 | 3.2210 | 1.6479 – 5.8550 | 3.0029 |
| 1992 | 178 | 3.3221 | 1.6862 – 5.6948 | 2.9502 |
| 1991 | 160 | 2.9843 | 1.5561 – 4.9423 | 2.9843 |
| 1990 | 158 | 2.9940 | 1.5742 – 4.9480 | 2.9940 |
| 1989 | 149 | 3.0607 | 1.6118 – 4.9661 | 3.0541 |
| 1988 | 148 | 2.9244 | 1.5619 – 5.0847 | 2.9244 |
062023 → 2024
Who rose and fell
The biggest changes in value between the two newest editions. Places are shown second, because they also move when other countries do.
Improved most
before → after Azerbaijan4.8861 → 4.0855−0.8006
- Equatorial Guinea5.2634 → 4.4954−0.7680
 Malta4.7762 → 4.0479−0.7283
 Kyrgyzstan5.0385 → 4.3806−0.6579
 Uzbekistan7.0184 → 6.4538−0.5646
Worsened most
before → after Palestine6.6400 → 8.6828+2.0428
- Libya10.8526 → 11.7427+0.8902
 Zimbabwe2.7115 → 3.3557+0.6441
 South Sudan1.4849 → 2.0610+0.5761
 Moldova3.2879 → 3.7305+0.4426
192 countries were measured in both 2023 and 2024.
07Across every edition
Energy intensity in records
The extremes of the statistic. A record reached by more than one country names none of them.
Highest reading on record
168.0449
Energy use per dollar of GDP (thousand Btu per US$ at PPP)
Lowest reading on record
0.1648
Energy use per dollar of GDP (thousand Btu per US$ at PPP)
Biggest improvement between editions
−138.0287
154.4448 → 16.4161
Biggest decline between editions
+9.2252
10.1790 → 19.4042
Most improved since first measured
−162.7283
168.0449 → 5.3166
At the top most often
27 of 37
editions, alone at the first-listed end
08The measure
About energy intensity
Energy intensity is how much energy a country uses to produce each dollar of its economic output, with GDP compared at purchasing power parities. It is the measure behind the UN goal to improve energy efficiency: a falling figure means an economy is getting more out of each unit of energy.
What the number is: Energy use per dollar of GDP (thousand Btu per US$ at PPP).
What it does not measure
It leaves out most wood, charcoal and crop waste burned for cooking and heat, so a low figure in a poor country often means uncounted firewood rather than efficiency. It also rises and falls with the kind of industry a country has and its climate, not only with how efficiently energy is used.
09Where it fits
Connections
Its part in the Country Index, the statistics whose values line up most closely with it across countries, and others on the same subject.
In the Country Index
Context, with no vote
This statistic is published in full under Environment & Sustainability and Energy, but does not help decide any Country Index standing.
Environment & SustainabilityEnergyWhich statistics vote, and why
Moves with
Where energy intensity is higher, these tend to be higher too.
- CO₂ Emissions per CapitaKeyGlobal Carbon Project · 190 countries in commonρ 0.59
- Adult Literacy RateUIS · 118 countries in commonρ 0.58
- Youth Literacy RateKeyUIS · 124 countries in commonρ 0.57
Moves against
Where energy intensity is higher, these tend to be lower.
- Global Multidimensional Poverty IndexOPHI · 100 countries in commonρ −0.58
- Working Poverty RateILO · 112 countries in commonρ −0.53
- Coefficient of Human InequalityUNDP Human Development Report Office · 163 countries in commonρ −0.46
Rank correlation (ρ, from −1 to 1) across countries, on each statistic’s newest edition, out of 189 statistics sharing at least 80 countries with this one. Two statistics that move together do not cause each other.
10Keep reading
Explore further
The subject
The countries at either end
More from EIA
11Questions
Energy intensity: questions and answers
Which country has the lowest energy intensity?
Chad, at 0.6661, among the 192 countries compared in 2024.
Which country has the highest energy intensity?
Turkmenistan, at 17.4532, among the 192 countries compared in 2024.
How many countries does the Energy Intensity of GDP (PPP) cover?
192 in 2024, and 194 at least once across all editions. The number measured varies from 148 to 194 between editions.
What is the world average energy intensity?
This site does not calculate a world average, which would depend on how countries are weighted. In the middle country of the 192 compared in 2024, the figure was 2.7382.
Is this U.S. Energy Information Administration (EIA)’s own ranking?
No ranking is shown. U.S. Energy Information Administration (EIA) publishes values only, and too many countries share the same value for an ordering to mean anything, so none is derived.
How often is the Energy Intensity of GDP (PPP) published?
This site holds 37 editions, describing 1988 to 2024.
Where does the data come from, and can I download it?
From U.S. Energy Information Administration (EIA), under Public domain (U.S. government work). From the U.S. Energy Information Administration's International Energy Statistics, read from its public bulk download. The ratio is EIA's own, computed from its energy balances and its GDP series; the zeros EIA uses for missing readings are left out. Every edition is on this site’s Datasets pages as a full table, and downloads as a CSV file with every value unrounded.
12Method
Sources, method and citation
Source
Energy Intensity of GDP (PPP) — U.S. Energy Information Administration (EIA)
From the U.S. Energy Information Administration's International Energy Statistics, read from its public bulk download. The ratio is EIA's own, computed from its energy balances and its GDP series; the zeros EIA uses for missing readings are left out.
Newest edition
Report year 2024Data year 2024
Cite the source as: Source: U.S. Energy Information Administration (Sep 2026). International Energy Statistics — Energy consumption per GDP (thousand Btu per USD at purchasing power parities).
Licence: Public domain (U.S. government work), checked 2026-09-26.
How this page reads the numbers
- No rank or position is shown: U.S. Energy Information Administration (EIA) publishes values only, and too many countries share the same value for an ordering to mean anything.
- Which end is better follows the publisher’s own reading of the measure.
- A country is named at an end only when it holds that value alone. Where several share it, the page says how many and names none first.
- Values are stored exactly as published and trimmed only for display. “The middle country” is the median of the countries measured, not a world average.
The file itself, column by column — where it came from, what each column holds, and every edition as a CSV — is on its dataset page.
Photographs
The countries at the top of this statistic, from their profiles: Wikimedia Commons, shown in greyscale, each used under the licence named.
- Chad — File: Robertgrafl derivative work: Jjtkk, Public domain
- Somalia — AMISOM, CC0
- Macau — Diego Delso, CC BY-SA 3.0
Cite this page
Nations Inquiry (2026). Energy intensity by country: Energy Intensity of GDP (PPP), data from U.S. Energy Information Administration (EIA). https://nationsinquiry.com/statistics/energy-intensity