GitHub · GitHub Developers
GitHub developers by country
How many GitHub developer accounts are located in each country?
Of the 219 countries compared in 2026, United States had the highest reading, 32,410,529, and Nauru had the lowest reading, 110. In the middle country the figure was 84,670. Among the 212 countries measured in every edition since 2020, the middle one moved from 19,251 to 92,572.
Part ofDigital & Technology
GitHub developers · 2026
Context statistic

Highest of 219United States
32,410,529012026 · values only
The highest and the lowest
The three countries with the highest values of 219 compared, the three with the lowest, and the highest on each continent. This statistic has no better end, so no country is shown as leading.
- 1
- 2

- 3

Lowest in 2026
 Nauru110
 Montserrat124
 Vatican City180
This statistic has no better end: the two ends describe size, not success.
Highest on each continent
- Africa
 Nigeria1,794,519
 - AmericasUnited States32,410,529
- AsiaIndia26,727,004
- Europe
 United Kingdom5,559,767
 - Oceania
 Australia2,368,357
 - Every region
02Every measured country
GitHub developers on a map
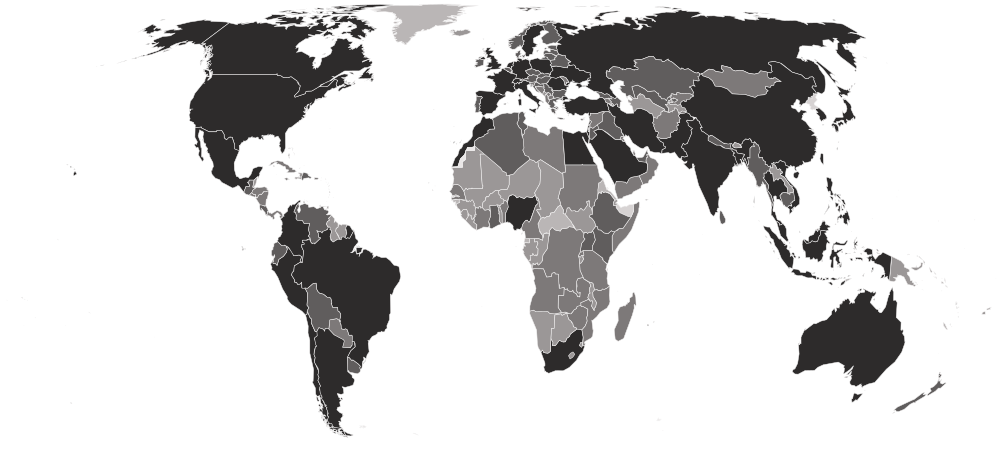
Each country is shaded by its value, in five groups holding the same number of countries. Hover a country for its value, or select it to open its profile. Below the map, each continent’s middle country.
Darker is a higher value. This statistic has no better end, so the shades describe size, not success.
- 110–5,328
- 5,564–42,927
- 43,600–146,772
- 147,165–748,934
- 781,300–32,410,529
- No reading in 2026
- Europe
343,734
the middle country, of 48 measured · 49 members
United Kingdom5,559,767Vatican City180Highest and lowest reading in Europe.
- Asia
239,231
the middle country, of 50 measured · 52 members
India26,727,004 Timor-Leste3,545
Highest and lowest reading in Asia.
- Africa
38,084
the middle country, of 54 measured · 55 members
Nigeria1,794,519 São Tomé and Príncipe859
Highest and lowest reading in Africa.
- Americas
35,840
the middle country, of 48 measured · 48 members
United States32,410,529Montserrat124Highest and lowest reading in Americas.
- Oceania
1,289
the middle country, of 19 measured · 21 members
Australia2,368,357Nauru110Highest and lowest reading in Oceania.
- Every region
22 sub-regions, highest middle country first
- Eastern Asia
3,145,730
the middle country, of 7 measured · 8 members
China11,351,939 Macau40,701
Highest and lowest reading in Eastern Asia.
- South-eastern Asia
1,139,033
the middle country, of 11 measured · 11 members
 Indonesia5,270,032Timor-Leste3,545
Highest and lowest reading in South-eastern Asia.
- Western Europe
748,934
the middle country, of 9 measured · 9 members
 Germany5,255,625
 Liechtenstein3,056
Highest and lowest reading in Western Europe.
- Southern Asia
541,411
the middle country, of 9 measured · 9 members
India26,727,004 Bhutan14,370
Highest and lowest reading in Southern Asia.
- Eastern Europe
535,514
the middle country, of 10 measured · 10 members
 Russia4,627,668
 Moldova140,751
Highest and lowest reading in Eastern Europe.
- Northern Africa
503,786
the middle country, of 6 measured · 6 members
 Egypt1,626,418
 Sudan49,732
Highest and lowest reading in Northern Africa.
- South America
381,924
the middle country, of 12 measured · 12 members
 Brazil8,317,960
 Suriname8,887
Highest and lowest reading in South America.
- Northern Europe
357,265
the middle country, of 12 measured · 13 members
United Kingdom5,559,767 Faroe Islands2,508
Highest and lowest reading in Northern Europe.
- Western Asia
156,027
the middle country, of 18 measured · 19 members
 Türkiye2,544,065
 Bahrain62,656
Highest and lowest reading in Western Asia.
- Central Asia
121,507
the middle country, of 5 measured · 5 members
 Kazakhstan463,403
 Turkmenistan7,738
Highest and lowest reading in Central Asia.
- Central America
119,670
the middle country, of 8 measured · 8 members
 Mexico2,865,151
 Belize9,715
Highest and lowest reading in Central America.
- Southern Europe
99,259
the middle country, of 17 measured · 17 members
 Spain2,802,085Vatican City180
Highest and lowest reading in Southern Europe.
- Eastern Africa
57,414
the middle country, of 18 measured · 19 members
 Kenya678,197
 Comoros1,194
Highest and lowest reading in Eastern Africa.
- Southern Africa
22,072
the middle country, of 5 measured · 5 members
 South Africa1,058,997
 Eswatini7,975
Highest and lowest reading in Southern Africa.
- Western Africa
18,981
the middle country, of 16 measured · 16 members
Nigeria1,794,519 Guinea-Bissau1,521
Highest and lowest reading in Western Africa.
- Middle Africa
16,223
the middle country, of 9 measured · 9 members
 Cameroon139,140São Tomé and Príncipe859
Highest and lowest reading in Middle Africa.
- Melanesia
5,328
the middle country, of 5 measured · 5 members
 Papua New Guinea16,631
 Vanuatu1,289
Highest and lowest reading in Melanesia.
- Caribbean
3,467
the middle country, of 24 measured · 24 members
 Dominican Republic217,451Montserrat124
Highest and lowest reading in Caribbean.
- Polynesia
830
the middle country, of 5 measured · 7 members
 French Polynesia6,057
 Cook Islands307
Highest and lowest reading in Polynesia.
- Micronesia
520
the middle country, of 7 measured · 7 members
 Guam6,030Nauru110
Highest and lowest reading in Micronesia.
- Australia and New Zealand
2 of 2 measured — too few for a middle: Australia, New Zealand.
Australia2,368,357 New Zealand441,201
Highest and lowest reading in Australia and New Zealand.
- Northern America
4 of 4 measured — too few for a middle: Bermuda, Canada, Greenland, United States.
United States32,410,529 Greenland1,682
Highest and lowest reading in Northern America.
03The whole field at once
The spread
219 countries, one dot each, on one scale — further right is a higher value. Half the countries are above 84,670; a quarter are above 487,235, and a quarter below 8,721. The bar in each row marks that continent’s middle country.
Log scale: each gridline is ten times the one before, so countries of very different sizes can be seen on one line.
04All 219 ever measured
Every country
In order, highest value first. No rank or position is shown: too many countries share the same value for an order to mean anything. Neither end is better. This is a count, not a rate, so large and well-connected countries lead. An account is placed by the internet address it uses, so virtual private networks move developers between countries, and a country with fewer than 100 developers is not published at all.
Showing 25 of 219 countries












































































































































































Values for 2026. The change column compares 2026 with 2025 only; the sparkline covers the recent editions.
052020–2026 · 7 editions
Over time
Each point is the last quarter GitHub published in that year, counted as of the quarter's final day. The count includes accounts that are no longer active, so it only ever grows slowly apart from moves between countries.
- the middle country
- the middle half of countries
- the middle of the 212 countries measured every time
- each continent’s middle country
The same, year by year
| Year | Countries | Middle country | Middle half | Measured every time |
|---|---|---|---|---|
| 2026 | 219 | 84,670 | 8,721 – 487,235 | 92,572 |
| 2025 | 218 | 77,589 | 8,147 – 452,147 | 83,461 |
| 2024 | 217 | 54,914 | 5,962 – 367,363 | 59,329 |
| 2023 | 217 | 44,967 | 4,538 – 306,332 | 47,226 |
| 2022 | 216 | 34,097 | 3,425 – 242,709 | 35,695 |
| 2021 | 215 | 26,127 | 2,577 – 191,609 | 26,462 |
| 2020 | 212 | 19,251 | 1,966 – 168,910 | 19,251 |
062025 → 2026
Who rose and fell
The biggest changes in value between the two newest editions. Places are shown second, because they also move when other countries do.
Rose most
before → after- India24,576,236 → 26,727,004+2,150,768
- United States30,298,253 → 32,410,529+2,112,276
- Brazil7,653,586 → 8,317,960+664,374
 Japan4,973,908 → 5,433,912+460,004
- Germany4,858,805 → 5,255,625+396,820
Fell most
before → after- Turkmenistan7,779 → 7,738−41
 Eritrea1,651 → 1,628−23
- Vatican City181 → 180−1
218 countries were measured in both 2025 and 2026. The field changed from 218 to 219 countries, so a place can move for reasons that have nothing to do with the country itself.
07Across every edition
GitHub developers in records
The extremes of the statistic. A record reached by more than one country names none of them.
Highest reading on record
32,410,529
Developer accounts located in the economy (as of quarter end)
Lowest reading on record
108
Developer accounts located in the economy (as of quarter end)
Biggest rise between editions
+6,513,475
18,062,761 → 24,576,236
Biggest fall between editions
−557
8,336 → 7,779
Biggest change since first measured
+21,073,080
5,653,924 → 26,727,004
Highest most often
7 of 7
editions, alone at the first-listed end
08The measure
About gitHub developers
How many developer accounts on GitHub, the world's largest code-hosting platform, are located in each country. GitHub publishes it quarterly in its Innovation Graph, one of the few open measures of how many people write software around the world.
What the number is: Developer accounts located in the economy (as of quarter end).
09Where it fits
Connections
Its part in the Country Index, the statistics whose values line up most closely with it across countries, and others on the same subject.
In the Country Index
Context, with no vote
This statistic is published in full under Digital & Technology, but does not help decide any Country Index standing.
Moves with
Where gitHub developers is higher, these tend to be higher too.
- GitHub RepositoriesGitHub · 218 countries in commonρ 0.99
- GitHub Git PushesGitHub · 186 countries in commonρ 0.99
- Scholarly ArticlesOurResearch · 215 countries in commonρ 0.96
Moves against
Where gitHub developers is higher, these tend to be lower.
- Outbound Mobility Ratio, TertiaryUIS · 117 countries in commonρ −0.68
- Net Official Development Assistance ReceivedOECD Development Assistance Committee · 129 countries in commonρ −0.65
- Climate Vulnerability (ND-GAIN)KeyNotre Dame Global Adaptation Initiative (ND-GAIN), University of Notre Dame · 188 countries in commonρ −0.56
Rank correlation (ρ, from −1 to 1) across countries, on each statistic’s newest edition, out of 314 statistics sharing at least 80 countries with this one. Two statistics that move together do not cause each other.
10Keep reading
Explore further
The subject
The countries at either end
More from GitHub
11Questions
GitHub developers: questions and answers
Which country has the highest gitHub developers?
United States, at 32,410,529, among the 219 countries compared in 2026.
Which country has the lowest gitHub developers?
Nauru, at 110, among the 219 countries compared in 2026.
How many countries does the GitHub Developers cover?
219 in 2026. The number measured varies from 212 to 219 between editions.
What is the world average gitHub developers?
This site does not calculate a world average, which would depend on how countries are weighted. In the middle country of the 219 compared in 2026, the figure was 84,670.
Is this GitHub’s own ranking?
No ranking is shown. GitHub publishes values only, and too many countries share the same value for an ordering to mean anything, so none is derived.
How often is the GitHub Developers published?
This site holds 7 editions, describing 2020 to 2026.
Where does the data come from, and can I download it?
From GitHub, under CC0 1.0. From the data files in GitHub's own Innovation Graph repository, stored as published. Places that are not a country row on this site, and the EU total, are left out; Jersey and Guernsey, which GitHub counts separately, are not added together into one row. Every edition is on this site’s Datasets pages as a full table, and downloads as a CSV file with every value unrounded.
12Method
Sources, method and citation
Source
GitHub Developers — GitHub
From the data files in GitHub's own Innovation Graph repository, stored as published. Places that are not a country row on this site, and the EU total, are left out; Jersey and Guernsey, which GitHub counts separately, are not added together into one row.
Newest edition
Report year 2026Data year 2026
Cite the source as: GitHub. (2026). GitHub Innovation Graph (Version 1.0.11) [Data set]. https://github.com/github/innovationgraph
Licence: CC0 1.0, checked 2026-09-29.
How this page reads the numbers
- No rank or position is shown: GitHub publishes values only, and too many countries share the same value for an ordering to mean anything.
- This statistic has no better end, so the page describes higher and lower values and never calls a country a leader.
- A country is named at an end only when it holds that value alone. Where several share it, the page says how many and names none first.
- Values are stored exactly as published and trimmed only for display. “The middle country” is the median of the countries measured, not a world average.
The file itself, column by column — where it came from, what each column holds, and every edition as a CSV — is on its dataset page.
Cite this page
Nations Inquiry (2026). GitHub developers by country: GitHub Developers, data from GitHub. https://nationsinquiry.com/statistics/github-developers