FAO · Fisheries and Aquaculture Production
Fish production by country
How much fish and seafood does a country catch and farm in a year?
Of the 220 countries compared in 2024, China had the highest reading, 70,500,841, and 3 countries shared the lowest reading, 0. In the middle country the figure was 52,375. Among the 182 countries measured in every edition since 1950, the middle one moved from 3,500 to 69,190.
Fish production · 2024
Context statistic

Highest of 220China
70,500,841012024 · values only
The highest and the lowest
The three countries with the highest values of 220 compared, the three with the lowest, and the highest on each continent. This statistic has no better end, so no country is shown as leading.
- 1
- 2

- 3

Lowest in 2024


This statistic has no better end: the two ends describe size, not success.
02Every measured country
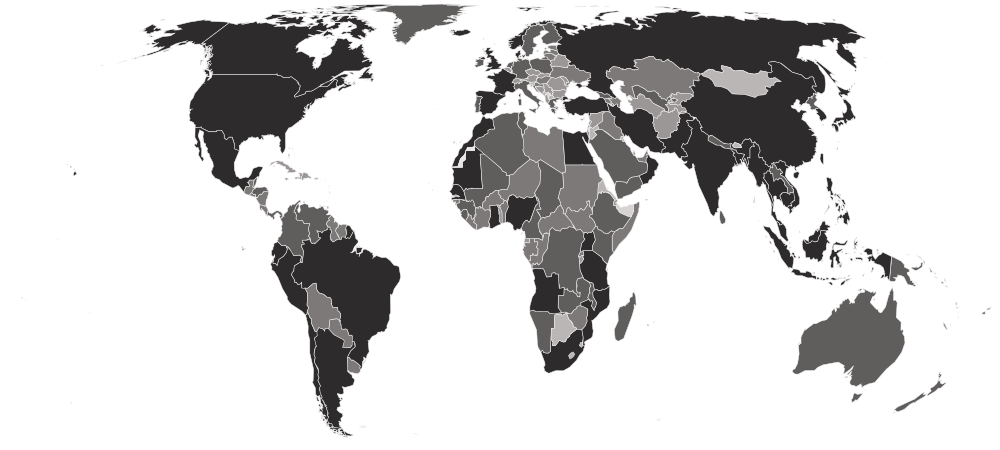
Fish production on a map
Each country is shaded by its value, in five groups holding the same number of countries. Hover a country for its value, or select it to open its profile. Below the map, each continent’s middle country.
Darker is a higher value. This statistic has no better end, so the shades describe size, not success.
- 0–3,379
- 3,387–24,044
- 24,179–97,871
- 97,945–422,672
- 476,547–70,500,841
- No reading in 2024
- Asia
107,423
the middle country, of 51 measured · 52 members
China70,500,841 Mongolia31
Highest and lowest reading in Asia.
- Africa
96,501
the middle country, of 54 measured · 55 members
 Egypt2,025,635
 Eswatini90
Highest and lowest reading in Africa.
- Oceania
34,890
the middle country, of 21 measured · 21 members
 New Zealand422,672
 Niue35
Highest and lowest reading in Oceania.
- Americas
23,187
the middle country, of 48 measured · 48 members
 Peru5,860,294
 Montserrat30
Highest and lowest reading in Americas.
- Europe
23,157
the middle country, of 46 measured · 49 members
 Russia5,327,006
3 share 0
Highest and lowest reading in Europe.
- Every region
22 sub-regions, highest middle country first
- South-eastern Asia
1,696,732
the middle country, of 11 measured · 11 members
Indonesia13,640,322 Singapore4,116
Highest and lowest reading in South-eastern Asia.
- Eastern Asia
712,919
the middle country, of 8 measured · 8 members
China70,500,841Mongolia31Highest and lowest reading in Eastern Asia.
- Southern Asia
410,760
the middle country, of 9 measured · 9 members
India18,370,438 Bhutan63
Highest and lowest reading in Southern Asia.
- South America
289,921
the middle country, of 12 measured · 12 members
Peru5,860,294 Bolivia25,055
Highest and lowest reading in South America.
- Northern Europe
197,165
the middle country, of 12 measured · 13 members
 Norway3,822,797
 Isle of Man3,514
Highest and lowest reading in Northern Europe.
- Eastern Africa
116,817
the middle country, of 18 measured · 19 members
 Uganda641,580
 Eritrea2,485
Highest and lowest reading in Eastern Africa.
- Northern Africa
101,334
the middle country, of 6 measured · 6 members
Egypt2,025,635 Libya33,109
Highest and lowest reading in Northern Africa.
- Micronesia
87,348
the middle country, of 7 measured · 7 members
 Kiribati278,517
 Northern Mariana Islands73
Highest and lowest reading in Micronesia.
- Central America
87,187
the middle country, of 8 measured · 8 members
 Mexico2,192,537
 Guatemala39,980
Highest and lowest reading in Central America.
- Western Africa
79,576
the middle country, of 16 measured · 16 members
 Nigeria1,113,540
 Cabo Verde5,587
Highest and lowest reading in Western Africa.
- Middle Africa
55,452
the middle country, of 9 measured · 9 members
 Angola631,824
 São Tomé and Príncipe5,730
Highest and lowest reading in Middle Africa.
- Melanesia
44,393
the middle country, of 5 measured · 5 members
 Papua New Guinea344,241
 New Caledonia5,314
Highest and lowest reading in Melanesia.
- Western Asia
24,058
the middle country, of 18 measured · 19 members
 Türkiye933,119
 Palestine282
Highest and lowest reading in Western Asia.
- Eastern Europe
20,206
the middle country, of 10 measured · 10 members
Russia5,327,006 Slovakia3,961
Highest and lowest reading in Eastern Europe.
- Central Asia
19,428
the middle country, of 5 measured · 5 members
 Uzbekistan199,432
 Tajikistan5,483
Highest and lowest reading in Central Asia.
- Southern Europe
9,365
the middle country, of 15 measured · 17 members
 Spain1,007,659
2 share 0
Highest and lowest reading in Southern Europe.
- Polynesia
6,360
the middle country, of 7 measured · 7 members
 Tuvalu45,442Niue35
Highest and lowest reading in Polynesia.
- Western Europe
5,358
the middle country, of 9 measured · 9 members
 France613,802
 Liechtenstein0
Highest and lowest reading in Western Europe.
- Southern Africa
2,181
the middle country, of 5 measured · 5 members
 South Africa476,547Eswatini90
Highest and lowest reading in Southern Africa.
- Caribbean
1,483
the middle country, of 24 measured · 24 members
 Dominican Republic24,044Montserrat30
Highest and lowest reading in Caribbean.
- Australia and New Zealand
2 of 2 measured — too few for a middle: Australia, New Zealand.
New Zealand422,672 Australia294,469
Highest and lowest reading in Australia and New Zealand.
- Northern America
4 of 4 measured — too few for a middle: Bermuda, Canada, Greenland, United States.
 United States4,220,467
 Bermuda338
Highest and lowest reading in Northern America.
03The whole field at once
The spread
220 countries, one dot each, on one scale — further right is a higher value. Half the countries are above 52,375; a quarter are above 278,096, and a quarter below 5,695. The bar in each row marks that continent’s middle country.
04All 220 ever measured
Every country
In order, highest value first. No rank or position is shown: too many countries share the same value for an order to mean anything. This is a national total, so the countries at the top are the ones with the biggest fishing fleets and fish farms, not the ones fishing best or worst. Catches are credited to the country whose flag the fishing vessel flies, wherever the fish were caught. Seaweed is shown in its own column and is not part of the total.
Showing 25 of 220 countries













































































































































































Values for 2024. The change column compares 2024 with 2023 only; the sparkline covers the recent editions.
051950–2024 · 75 reference years
Over time
Each point is one year from 1950, as FAO's latest release gives it: FAO revises past years when countries correct their reports.
- the middle country
- the middle half of countries
- the middle of the 182 countries measured every time
- each continent’s middle country
The same, year by year
| Year | Countries | Middle country | Middle half | Measured every time |
|---|---|---|---|---|
| 2024 | 220 | 52,375 | 5,695 – 278,096 | 69,190 |
| 2023 | 220 | 52,307 | 5,616 – 254,242 | 68,934 |
| 2022 | 220 | 52,377 | 6,393 – 251,344 | 76,318 |
| 2021 | 220 | 51,710 | 5,974 – 255,058 | 72,781 |
| 2020 | 220 | 49,496 | 5,598 – 255,219 | 72,537 |
| 2019 | 220 | 50,155 | 6,145 – 269,621 | 73,219 |
| 2018 | 220 | 47,804 | 6,397 – 278,912 | 73,477 |
| 2017 | 220 | 48,929 | 6,684 – 271,643 | 73,276 |
| 2016 | 220 | 45,562 | 6,961 – 264,701 | 65,655 |
| 2015 | 220 | 41,148 | 6,302 – 235,413 | 67,878 |
| 2014 | 220 | 44,735 | 5,367 – 227,414 | 70,661 |
| 2013 | 220 | 40,282 | 5,710 – 232,092 | 56,473 |
| 2012 | 220 | 37,349 | 6,131 – 223,332 | 56,808 |
| 2011 | 218 | 38,898 | 5,524 – 223,546 | 54,560 |
| 2010 | 216 | 42,561 | 5,428 – 231,932 | 49,924 |
| 2009 | 216 | 40,351 | 4,976 – 243,461 | 47,604 |
| 2008 | 216 | 36,427 | 4,575 – 239,626 | 48,607 |
| 2007 | 216 | 34,368 | 4,671 – 244,007 | 53,494 |
| 2006 | 215 | 35,035 | 5,116 – 243,214 | 49,716 |
| 2005 | 213 | 37,778 | 4,197 – 255,525 | 48,079 |
| 2004 | 213 | 35,028 | 4,661 – 248,367 | 49,837 |
| 2003 | 213 | 35,918 | 4,273 – 236,342 | 47,563 |
| 2002 | 213 | 31,405 | 4,515 – 240,655 | 41,812 |
| 2001 | 213 | 32,039 | 3,677 – 234,122 | 37,497 |
| 2000 | 213 | 27,968 | 3,634 – 229,375 | 42,019 |
| 1999 | 213 | 28,095 | 3,650 – 216,926 | 40,749 |
| 1998 | 213 | 25,800 | 3,625 – 210,689 | 34,781 |
| 1997 | 213 | 25,788 | 3,546 – 205,805 | 34,199 |
| 1996 | 213 | 22,782 | 3,236 – 195,298 | 33,467 |
| 1995 | 213 | 22,608 | 3,567 – 208,983 | 33,711 |
| 1994 | 213 | 22,610 | 3,133 – 214,304 | 29,726 |
| 1993 | 213 | 23,325 | 2,845 – 219,901 | 29,718 |
| 1992 | 209 | 25,750 | 3,059 – 229,514 | 29,285 |
| 1991 | 190 | 25,458 | 2,771 – 238,249 | 29,106 |
| 1990 | 190 | 25,280 | 2,725 – 244,554 | 29,599 |
| 1989 | 190 | 24,305 | 2,833 – 223,729 | 27,550 |
| 1988 | 190 | 25,417 | 2,658 – 237,421 | 28,101 |
| 1987 | 190 | 23,910 | 2,792 – 215,394 | 28,291 |
| 1986 | 190 | 22,272 | 2,610 – 214,871 | 25,582 |
| 1985 | 190 | 21,198 | 2,614 – 215,669 | 25,546 |
| 1984 | 190 | 19,666 | 2,906 – 200,243 | 24,797 |
| 1983 | 190 | 17,418 | 2,427 – 196,143 | 22,853 |
| 1982 | 190 | 17,552 | 2,436 – 179,790 | 24,000 |
| 1981 | 190 | 18,289 | 2,526 – 169,365 | 23,676 |
| 1980 | 190 | 16,268 | 2,294 – 171,665 | 20,146 |
| 1979 | 190 | 17,712 | 2,614 – 161,893 | 22,500 |
| 1978 | 190 | 15,791 | 2,730 – 149,024 | 22,328 |
| 1977 | 190 | 14,584 | 2,466 – 153,747 | 20,450 |
| 1976 | 190 | 13,511 | 2,240 – 151,994 | 20,645 |
| 1975 | 190 | 14,526 | 1,992 – 141,596 | 17,012 |
| 1974 | 190 | 13,743 | 1,700 – 136,898 | 17,638 |
| 1973 | 190 | 13,150 | 1,658 – 142,325 | 16,850 |
| 1972 | 190 | 12,335 | 1,700 – 123,199 | 17,003 |
| 1971 | 190 | 10,811 | 1,505 – 113,392 | 15,365 |
| 1970 | 190 | 10,550 | 1,500 – 102,955 | 13,850 |
| 1969 | 184 | 11,500 | 1,590 – 109,963 | 13,300 |
| 1968 | 184 | 10,600 | 1,545 – 103,778 | 12,550 |
| 1967 | 183 | 10,200 | 1,530 – 93,650 | 10,550 |
| 1966 | 183 | 12,300 | 1,530 – 87,054 | 12,400 |
| 1965 | 183 | 11,000 | 1,380 – 79,788 | 11,500 |
| 1964 | 183 | 10,000 | 1,440 – 80,315 | 10,200 |
| 1963 | 183 | 9,000 | 1,250 – 71,357 | 9,100 |
| 1962 | 183 | 7,900 | 1,150 – 65,633 | 8,050 |
| 1961 | 183 | 8,000 | 840 – 64,300 | 8,050 |
| 1960 | 182 | 8,600 | 900 – 65,050 | 8,600 |
| 1959 | 182 | 6,050 | 863 – 64,325 | 6,050 |
| 1958 | 182 | 6,500 | 825 – 62,025 | 6,500 |
| 1957 | 182 | 6,750 | 720 – 56,500 | 6,750 |
| 1956 | 182 | 5,500 | 748 – 52,250 | 5,500 |
| 1955 | 182 | 5,450 | 708 – 54,506 | 5,450 |
| 1954 | 182 | 4,950 | 633 – 51,656 | 4,950 |
| 1953 | 182 | 4,050 | 600 – 48,957 | 4,050 |
| 1952 | 182 | 4,400 | 525 – 38,825 | 4,400 |
| 1951 | 182 | 3,600 | 500 – 34,850 | 3,600 |
| 1950 | 182 | 3,500 | 500 – 34,100 | 3,500 |
062023 → 2024
Who rose and fell
The biggest changes in value between the two newest editions — reference years recalculated in one report, not two separate publications. Places are shown second, because they also move when other countries do.
Rose most
before → afterFell most
before → after- United States4,675,382 → 4,220,467−454,915
- Russia5,712,031 → 5,327,006−385,026
 Iceland1,426,114 → 1,049,648−376,466
- Uganda846,493 → 641,580−204,913
- Norway4,003,421 → 3,822,797−180,624
220 countries were measured in both 2023 and 2024.
07Across every edition
Fish production in records
The extremes of the statistic. A record reached by more than one country names none of them.
Highest reading on record
70,500,841
Fish, crustaceans, molluscs and other aquatic animals caught or farmed, tonnes (live weight)
Lowest reading on record
Reached 494 times by 21 countries — shared, so no holder is named
0
Fish, crustaceans, molluscs and other aquatic animals caught or farmed, tonnes (live weight)
Biggest rise between editions
+4,584,728
23,833,631 → 28,418,359
Biggest fall between editions
−5,827,855
10,506,154 → 4,678,299
Biggest change since first measured
+69,544,741
956,100 → 70,500,841
Highest most often
36 of 75
editions, alone at the first-listed end
08The parts of the index
Inside the number
Food and Agriculture Organization of the United Nations (FAO) publishes the parts the headline is built from. Each part’s highest and lowest country, and its middle value.
| Part | Highest | Lowest | Middle country |
|---|---|---|---|
| Capture fisheries (tonnes, live weight)220 countries | China12,943,702 | 5 countries share 0 | 42,453 |
| Aquaculture (tonnes, live weight)220 countries | China57,557,138.6 | 21 countries share 0.0 | 2,773.4 |
09The measure
About fish production
This is how much fish, shellfish and other aquatic animals a country catches at sea and in rivers and lakes, or farms, in a year, in tonnes of live weight. It is FAO's global production record, kept for every country since 1950, with wild capture and aquaculture stored side by side.
What the number is: Fish, crustaceans, molluscs and other aquatic animals caught or farmed, tonnes (live weight).
10Where it fits
Connections
Its part in the Country Index, the statistics whose values line up most closely with it across countries, and others on the same subject.
In the Country Index
Context, with no vote
This statistic is published in full under Environment & Sustainability and Food & Agriculture, but does not help decide any Country Index standing.
Environment & SustainabilityFood & AgricultureWhich statistics vote, and why
Moves with
Where fish production is higher, these tend to be higher too.
- Total PopulationUN DESA Population Division · 220 countries in commonρ 0.72
- Land AreaFAO · 219 countries in commonρ 0.69
- Agricultural EmissionsFAO · 197 countries in commonρ 0.68
Moves against
Where fish production is higher, these tend to be lower.
- Outbound Mobility Ratio, TertiaryUIS · 117 countries in commonρ −0.66
- Foreign Value Added Share of Gross ExportsOECD · 80 countries in commonρ −0.44
- Services ExportsUNCTAD · 180 countries in commonρ −0.40
Rank correlation (ρ, from −1 to 1) across countries, on each statistic’s newest edition, out of 315 statistics sharing at least 80 countries with this one. Two statistics that move together do not cause each other.
11Keep reading
Explore further
The countries at either end
12Questions
Fish production: questions and answers
Which country has the highest fish production?
China, at 70,500,841, among the 220 countries compared in 2024.
Which country has the lowest fish production?
3 countries share the lowest reading, 0, among the 220 compared in 2024, so no single country is named.
How many countries does the Fisheries and Aquaculture Production cover?
220 in 2024. The number measured varies from 182 to 220 between editions.
What is the world average fish production?
This site does not calculate a world average, which would depend on how countries are weighted. In the middle country of the 220 compared in 2024, the figure was 52,375.
Is this Food and Agriculture Organization of the United Nations (FAO)’s own ranking?
No ranking is shown. Food and Agriculture Organization of the United Nations (FAO) publishes values only, and too many countries share the same value for an ordering to mean anything, so none is derived.
How often is the Fisheries and Aquaculture Production published?
This site holds 75 reference years, 1950–2024, all recalculated in Food and Agriculture Organization of the United Nations (FAO)’s 2026 report on one method — not 75 separate publications.
Where does the data come from, and can I download it?
From Food and Agriculture Organization of the United Nations (FAO), under CC BY 4.0. FAO's FishStat Global Production dataset, read from FAO's own download. FishStat records production species by species; the total here adds those records up in the way FAO's own yearbook does, leaving out whales, seals and crocodiles, which are counted by head, and pearls, corals and sponges. Every edition is on this site’s Datasets pages as a full table, and downloads as a CSV file with every value unrounded.
13Method
Sources, method and citation
Source
Fisheries and Aquaculture Production — Food and Agriculture Organization of the United Nations (FAO)
FAO's FishStat Global Production dataset, read from FAO's own download. FishStat records production species by species; the total here adds those records up in the way FAO's own yearbook does, leaving out whales, seals and crocodiles, which are counted by head, and pearls, corals and sponges.
Newest edition
Report year 2024Data year 2024
Cite the source as: FAO. 2026. FishStat: Global production by production source 1950–2024 (release 2026.1.0). Accessed on 29 September 2026. https://www.fao.org/fishery/en/collection/global_production Licence: CC-BY-4.0.
Licence: CC BY 4.0, checked 2026-09-29.
How this page reads the numbers
- No rank or position is shown: Food and Agriculture Organization of the United Nations (FAO) publishes values only, and too many countries share the same value for an ordering to mean anything.
- This statistic has no better end, so the page describes higher and lower values and never calls a country a leader.
- A country is named at an end only when it holds that value alone. Where several share it, the page says how many and names none first.
- Values are stored exactly as published and trimmed only for display. “The middle country” is the median of the countries measured, not a world average.
The file itself, column by column — where it came from, what each column holds, and every edition as a CSV — is on its dataset page.
Cite this page
Nations Inquiry (2026). Fish production by country: Fisheries and Aquaculture Production, data from Food and Agriculture Organization of the United Nations (FAO). https://nationsinquiry.com/statistics/fish-production