FAO · Land Area
Land area by country
How much land does each country have?
Of the 221 countries compared in 2024, Russia had the highest reading, 16,376,870, and Vatican City had the lowest reading, 0. In the middle country the figure was 87,589. Among the 184 countries measured in every edition since 1961, the middle one moved from 98,355 to 99,215.
Share
Part ofPeople & Population
Land area · 2024
Context statistic

Highest of 221Russia
16,376,870012024 · position · derived
The highest and the lowest
The three countries with the highest values of 221 compared, the three with the lowest, and the highest on each continent. This statistic has no better end, so no country is shown as leading.
- 1
- 2

- 3

Lowest in 2024
- 221
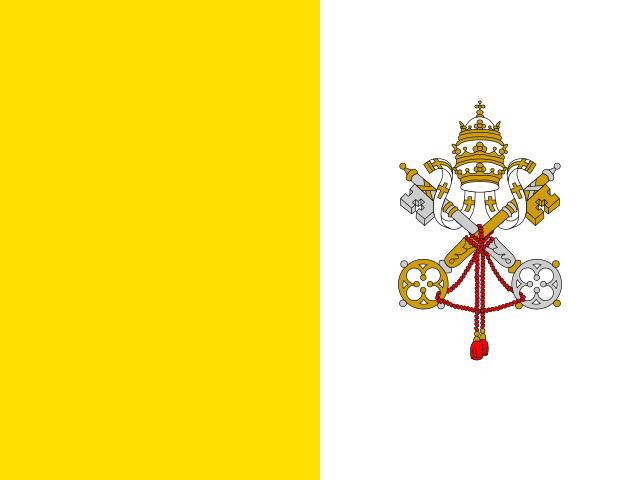 Vatican City0
- 220
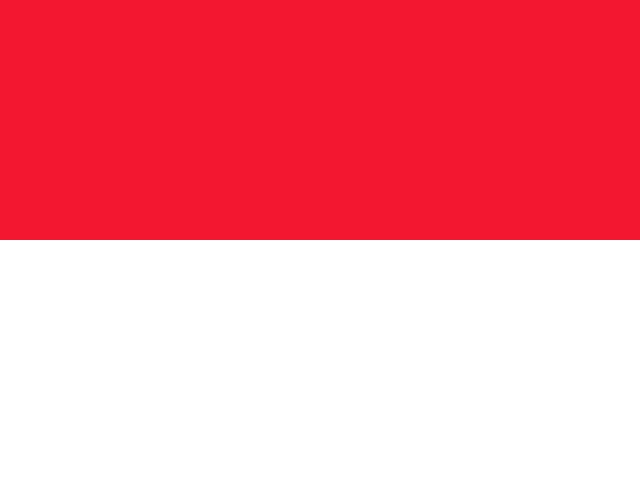 Monaco2
- 219
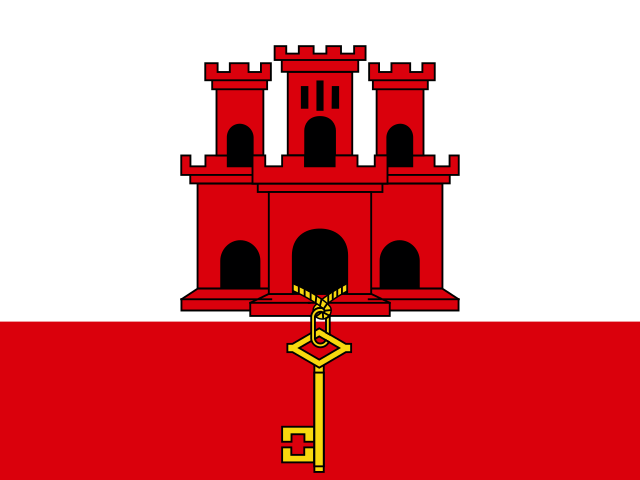 Gibraltar10
Positions out of 221. This statistic has no better end: the two ends describe size, not success.
02Every measured country
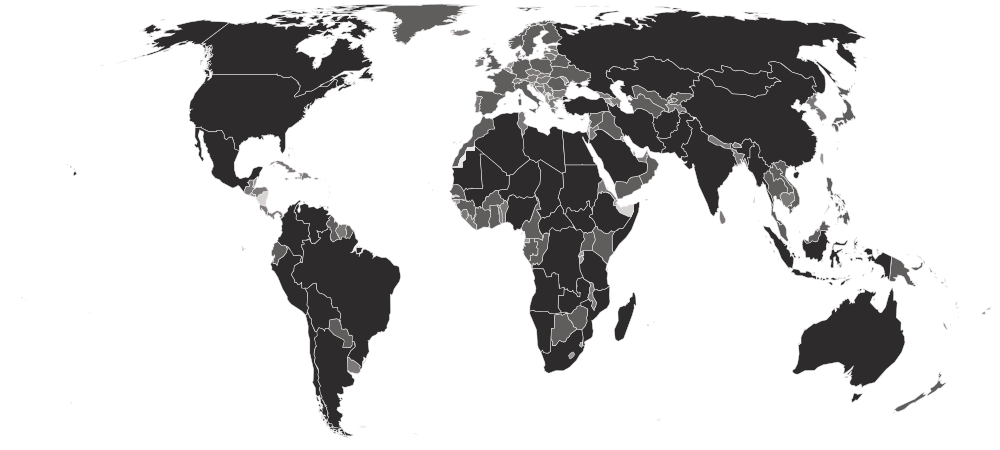
Land area on a map
Each country is shaded by its value, in five groups holding the same number of countries. Hover a country for its value, or select it to open its profile. Below the map, each continent’s middle country.
Darker is a higher value. This statistic has no better end, so the shades describe size, not success.
- 0–960
- 1,050–35,410
- 38,140–176,520
- 183,630–580,880
- 581,800–16,376,870
- No reading in 2024 (1 measured in an earlier edition)
- Africa
329,750
the middle country, of 54 measured · 55 members
 Algeria2,381,740
 Seychelles457
Highest and lowest reading in Africa.
- Asia
143,350
the middle country, of 51 measured · 52 members
China9,388,210 Macau33
Highest and lowest reading in Asia.
- Europe
59,095
the middle country, of 48 measured · 49 members
Russia16,376,870Vatican City0Highest and lowest reading in Europe.
- Americas
22,810
the middle country, of 47 measured · 48 members
United States9,147,420 Sint Maarten34
Highest and lowest reading in Americas.
- Oceania
720
the middle country, of 21 measured · 21 members
 Australia7,688,287
 Nauru21
Highest and lowest reading in Oceania.
- Every region
22 sub-regions, highest middle country first
- Northern Africa
1,377,495
the middle country, of 6 measured · 6 members
Algeria2,381,740 Tunisia155,360
Highest and lowest reading in Northern Africa.
- South America
812,041
the middle country, of 12 measured · 12 members
 Brazil8,358,140
 Suriname160,508
Highest and lowest reading in South America.
- Southern Africa
566,730
the middle country, of 5 measured · 5 members
 South Africa1,213,090
 Eswatini17,200
Highest and lowest reading in Southern Africa.
- Middle Africa
472,710
the middle country, of 9 measured · 9 members
 DR Congo2,267,050
 São Tomé and Príncipe960
Highest and lowest reading in Middle Africa.
- Central Asia
438,510
the middle country, of 5 measured · 5 members
 Kazakhstan2,699,700
 Tajikistan138,790
Highest and lowest reading in Central Asia.
- South-eastern Asia
298,170
the middle country, of 11 measured · 11 members
 Indonesia1,892,410
 Singapore725
Highest and lowest reading in South-eastern Asia.
- Eastern Africa
293,685
the middle country, of 18 measured · 19 members
 Ethiopia1,122,135Seychelles457
Highest and lowest reading in Eastern Africa.
- Western Africa
210,032
the middle country, of 16 measured · 16 members
 Niger1,266,700
 Cabo Verde4,030
Highest and lowest reading in Western Africa.
- Eastern Europe
155,768
the middle country, of 10 measured · 10 members
Russia16,376,870 Moldova32,930
Highest and lowest reading in Eastern Europe.
- Southern Asia
143,350
the middle country, of 9 measured · 9 members
 India2,973,190
 Maldives298
Highest and lowest reading in Southern Asia.
- Eastern Asia
109,005
the middle country, of 8 measured · 8 members
China9,388,210Macau33Highest and lowest reading in Eastern Asia.
- Central America
74,180
the middle country, of 7 measured · 8 members
 Mexico1,943,950
 El Salvador20,720
Highest and lowest reading in Central America.
- Western Asia
70,255
the middle country, of 18 measured · 19 members
 Saudi Arabia2,149,690
 Bahrain800
Highest and lowest reading in Western Asia.
- Northern Europe
62,590
the middle country, of 13 measured · 13 members
 Sweden407,270
Channel Islands198
Highest and lowest reading in Northern Europe.
- Western Europe
33,670
the middle country, of 9 measured · 9 members
 France538,950Monaco2
Highest and lowest reading in Western Europe.
- Southern Europe
26,310
the middle country, of 16 measured · 17 members
 Spain499,686Vatican City0
Highest and lowest reading in Southern Europe.
- Melanesia
18,576
the middle country, of 5 measured · 5 members
 Papua New Guinea452,860
 Vanuatu12,189
Highest and lowest reading in Melanesia.
- Micronesia
460
the middle country, of 7 measured · 7 members
 Kiribati811Nauru21
Highest and lowest reading in Micronesia.
- Caribbean
436
the middle country, of 24 measured · 24 members
 Cuba103,800Sint Maarten34
Highest and lowest reading in Caribbean.
- Polynesia
259
the middle country, of 7 measured · 7 members
 French Polynesia3,521
 Tuvalu26
Highest and lowest reading in Polynesia.
- Australia and New Zealand
2 of 2 measured — too few for a middle: Australia, New Zealand.
Australia7,688,287 New Zealand263,310
Highest and lowest reading in Australia and New Zealand.
- Northern America
4 of 4 measured — too few for a middle: Bermuda, Canada, Greenland, United States.
United States9,147,420 Bermuda54
Highest and lowest reading in Northern America.
03The whole field at once
The spread
221 countries, one dot each, on one scale — further right is a higher value. Half the countries are above 87,589; a quarter are above 438,510, and a quarter below 6,025. The bar in each row marks that continent’s middle country.
Log scale: each gridline is ten times the one before, so countries of very different sizes can be seen on one line.
04All 222 ever measured
Every country
In order, highest value first. “=” marks a position shared with another country. Food and Agriculture Organization of the United Nations (FAO) ranks nobody on this measure; the position is derived here by ordering the published values. This is a size order and not a ranking. Russia is at the top because it is large, which is a fact about geography rather than an achievement, and the small island states at the bottom are not doing anything wrong.
Showing 25 of 222 countries







































































































































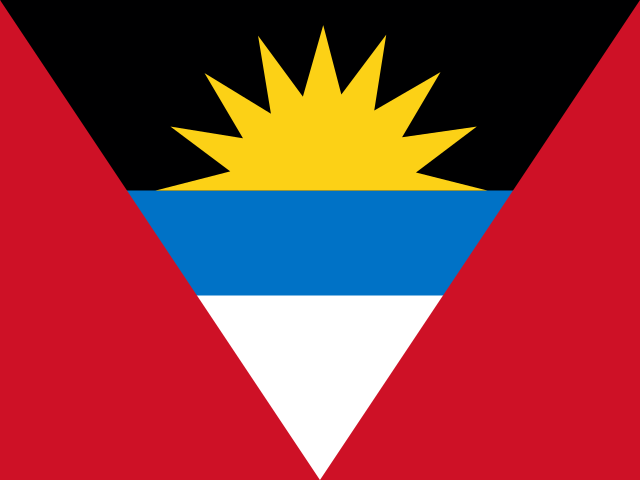

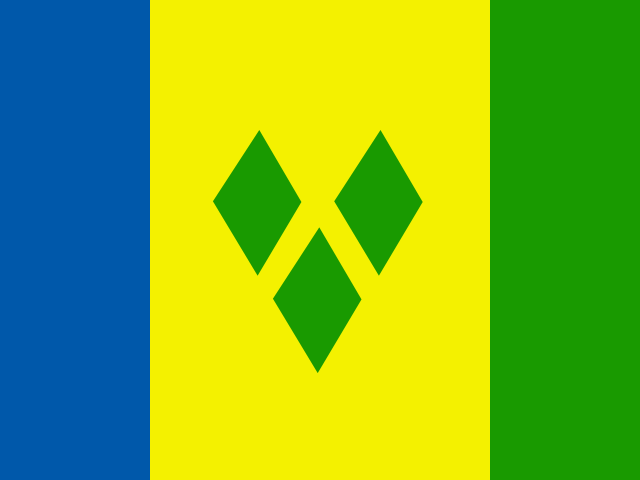

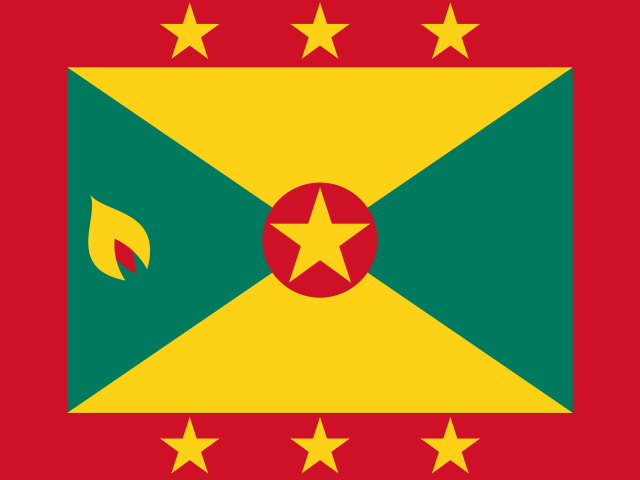

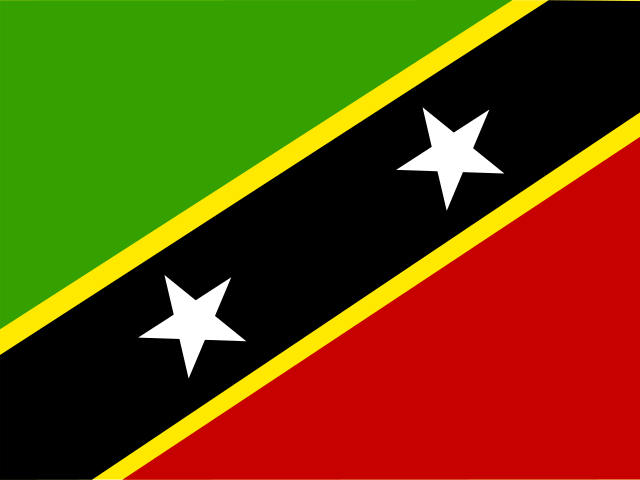
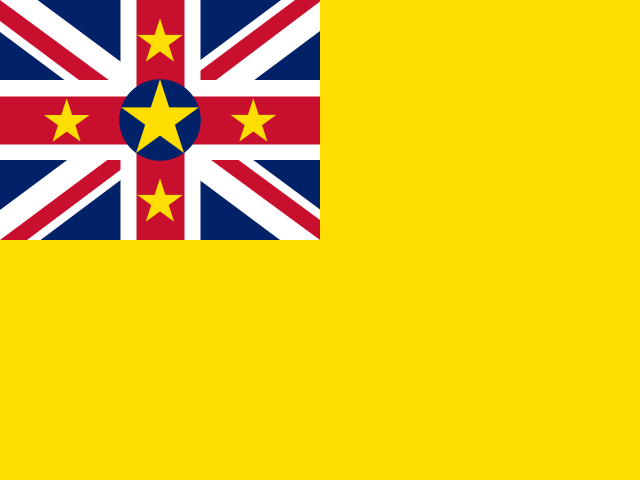
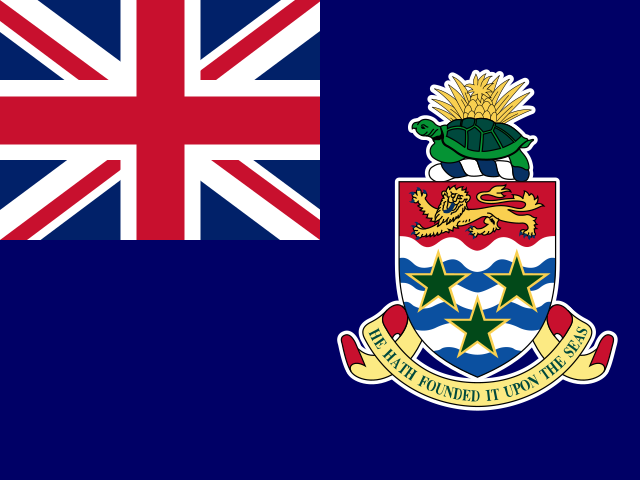
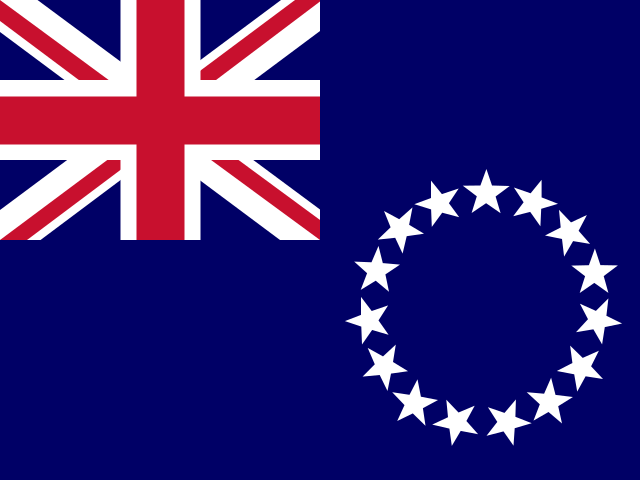


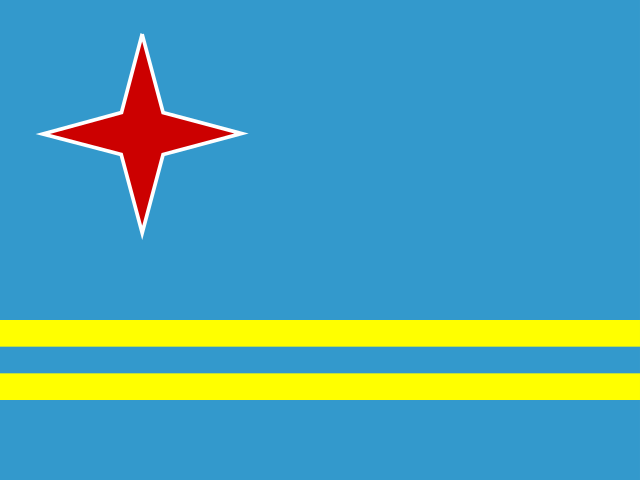

Values for 2024. The change column compares 2024 with 2023 only; the sparkline covers the recent editions.
051961–2024 · 64 editions
Over time
Each point is one year from 1961. Most countries draw a flat line, which is the honest answer — borders rarely move. The steps that do appear are real: a country splitting, a boundary revision, or the FAO restating a survey.
- the middle country
- the middle half of countries
- the middle of the 184 countries measured every time
- each continent’s middle country
The same, year by year
| Year | Countries | Middle country | Middle half | Measured every time |
|---|---|---|---|---|
| 2024 | 221 | 87,589 | 6,025 – 438,510 | 99,215 |
| 2023 | 221 | 87,589 | 6,025 – 440,650 | 99,215 |
| 2022 | 222 | 88,191 | 6,736 – 439,022 | 99,215 |
| 2021 | 222 | 88,191 | 6,736 – 439,022 | 99,215 |
| 2020 | 222 | 88,191 | 6,733 – 439,020 | 99,215 |
| 2019 | 222 | 88,127 | 6,733 – 438,949 | 99,215 |
| 2018 | 222 | 88,120 | 6,733 – 438,972 | 99,175 |
| 2017 | 222 | 88,120 | 6,733 – 438,973 | 98,880 |
| 2016 | 222 | 88,120 | 6,733 – 438,975 | 98,870 |
| 2015 | 222 | 88,120 | 6,733 – 438,982 | 98,848 |
| 2014 | 222 | 88,120 | 6,733 – 435,374 | 98,840 |
| 2013 | 222 | 88,120 | 6,733 – 435,374 | 98,838 |
| 2012 | 222 | 88,120 | 6,733 – 435,430 | 98,780 |
| 2011 | 220 | 85,059 | 5,833 – 416,418 | 98,720 |
| 2010 | 217 | 88,780 | 9,240 – 434,320 | 98,725 |
| 2009 | 217 | 88,780 | 9,240 – 434,320 | 98,655 |
| 2008 | 217 | 88,240 | 9,240 – 435,967 | 98,620 |
| 2007 | 217 | 88,240 | 9,240 – 435,984 | 98,585 |
| 2006 | 217 | 88,240 | 9,240 – 435,850 | 98,565 |
| 2005 | 215 | 89,610 | 9,055 – 436,610 | 98,550 |
| 2004 | 215 | 89,620 | 9,055 – 436,612 | 98,535 |
| 2003 | 215 | 89,620 | 9,055 – 436,624 | 98,525 |
| 2002 | 215 | 89,620 | 9,055 – 436,641 | 98,520 |
| 2001 | 215 | 89,620 | 9,055 – 436,641 | 98,495 |
| 2000 | 215 | 89,620 | 9,055 – 436,668 | 98,355 |
| 1999 | 213 | 91,500 | 9,240 – 437,370 | 98,355 |
| 1998 | 213 | 91,500 | 9,240 – 437,370 | 98,355 |
| 1997 | 213 | 91,500 | 9,240 – 437,370 | 98,355 |
| 1996 | 213 | 91,500 | 9,240 – 437,370 | 98,355 |
| 1995 | 213 | 91,500 | 9,240 – 437,370 | 98,355 |
| 1994 | 213 | 91,500 | 9,240 – 437,370 | 98,355 |
| 1993 | 213 | 91,500 | 9,240 – 437,370 | 98,355 |
| 1992 | 209 | 91,500 | 8,870 – 437,370 | 98,355 |
| 1991 | 190 | 95,300 | 3,753 – 444,068 | 98,355 |
| 1990 | 186 | 98,355 | 5,458 – 451,220 | 98,355 |
| 1989 | 186 | 98,355 | 5,458 – 451,220 | 98,355 |
| 1988 | 186 | 98,355 | 5,458 – 451,220 | 98,355 |
| 1987 | 186 | 98,355 | 5,458 – 451,220 | 98,355 |
| 1986 | 186 | 98,355 | 5,458 – 451,220 | 98,355 |
| 1985 | 186 | 98,355 | 5,458 – 451,220 | 98,355 |
| 1984 | 186 | 98,355 | 5,458 – 451,220 | 98,355 |
| 1983 | 186 | 98,355 | 5,458 – 451,220 | 98,355 |
| 1982 | 186 | 98,355 | 5,458 – 451,220 | 98,355 |
| 1981 | 186 | 98,355 | 5,458 – 451,220 | 98,355 |
| 1980 | 186 | 98,355 | 5,458 – 451,220 | 98,355 |
| 1979 | 185 | 100,250 | 6,020 – 452,860 | 98,355 |
| 1978 | 185 | 100,250 | 6,020 – 452,860 | 98,355 |
| 1977 | 185 | 100,250 | 6,020 – 452,860 | 98,355 |
| 1976 | 185 | 100,250 | 6,020 – 452,860 | 98,355 |
| 1975 | 185 | 100,250 | 6,020 – 452,860 | 98,355 |
| 1974 | 185 | 100,250 | 6,020 – 452,860 | 98,355 |
| 1973 | 185 | 100,250 | 6,020 – 452,860 | 98,355 |
| 1972 | 185 | 100,250 | 6,020 – 452,860 | 98,355 |
| 1971 | 185 | 100,250 | 6,020 – 452,860 | 98,355 |
| 1970 | 185 | 100,250 | 6,020 – 452,860 | 98,355 |
| 1969 | 185 | 100,250 | 6,020 – 452,860 | 98,355 |
| 1968 | 185 | 100,250 | 6,020 – 452,860 | 98,355 |
| 1967 | 185 | 100,250 | 6,020 – 452,860 | 98,355 |
| 1966 | 185 | 100,250 | 6,020 – 452,860 | 98,355 |
| 1965 | 185 | 100,250 | 6,020 – 452,860 | 98,355 |
| 1964 | 185 | 100,250 | 6,020 – 452,860 | 98,355 |
| 1963 | 185 | 100,250 | 6,020 – 452,860 | 98,355 |
| 1962 | 185 | 100,250 | 6,020 – 452,860 | 98,355 |
| 1961 | 185 | 100,250 | 6,020 – 452,860 | 98,355 |
062023 → 2024
Who rose and fell
The biggest changes in value between the two newest editions. Places are shown second, because they also move when other countries do.
Rose most
before → after Fiji18,270 → 18,333 · 153rd → 153rd+63
- French Polynesia3,471 → 3,521 · 170th → 170th+50
 Finland303,960 → 304,000 · 71st → 71st+40
 Comoros1,861 → 1,870 · 174th → 174th+9
 Kenya580,876 → 580,880 · 45th → 45th+4
Fell most
before → after- Australia7,692,020 → 7,688,287 · 6th → 6th−3,733
 Uzbekistan440,650 → 438,510 · 56th → 56th−2,140
 Chile742,832 → 742,032 · 38th → 38th−800
 Poland306,270 → 306,070 · 70th → 70th−200
- Spain499,697 → 499,686 · 51st → 51st−12
221 countries were measured in both 2023 and 2024.
07Across every edition
Land area in records
The extremes of the statistic. A record reached by more than one country names none of them.
Highest reading on record
16,389,950
Land area (sq. km)
Lowest reading on record
0
Land area (sq. km)
Biggest rise between editions
+122,884
1,000,000 → 1,122,884
Biggest fall between editions
−176,890
8,965,590 → 8,788,700
Biggest change since first measured
+122,135
1,000,000 → 1,122,135
Highest most often
33 of 64
editions, alone at the first-listed end
08The measure
About land area
How much land a country has, excluding lakes, rivers and the sea it claims. It is the other denominator this site leans on: population density, arable land per person and the share of a country that is forest or farm all divide by this number.
What the number is: Land area (sq. km).
09Where it fits
Connections
Its part in the Country Index, the statistics whose values line up most closely with it across countries, and others on the same subject.
In the Country Index
Context, with no vote
This statistic is published in full under People & Population, but does not help decide any Country Index standing.
Moves with
Where land area is higher, these tend to be higher too.
- Agricultural EmissionsFAO · 197 countries in commonρ 0.89
- Methane EmissionsEDGAR · 206 countries in commonρ 0.87
- Total PopulationUN DESA Population Division · 220 countries in commonρ 0.85
Moves against
Where land area is higher, these tend to be lower.
- Services ExportsUNCTAD · 179 countries in commonρ −0.66
- Political Stability and Absence of ViolenceKeyWorld Bank Group · 209 countries in commonρ −0.64
- Outbound Mobility Ratio, TertiaryUIS · 116 countries in commonρ −0.63
Rank correlation (ρ, from −1 to 1) across countries, on each statistic’s newest edition, out of 385 statistics sharing at least 80 countries with this one. Two statistics that move together do not cause each other.
10Keep reading
Explore further
The subject
The countries at either end
11Questions
Land area: questions and answers
Which country has the highest land area?
Russia, at 16,376,870, among the 221 countries compared in 2024.
Which country has the lowest land area?
Vatican City, at 0, among the 221 countries compared in 2024.
How many countries does the Land Area cover?
221 in 2024, and 222 at least once across all editions. The number measured varies from 185 to 222 between editions.
What is the world average land area?
This site does not calculate a world average, which would depend on how countries are weighted. In the middle country of the 221 compared in 2024, the figure was 87,589.
Is this Food and Agriculture Organization of the United Nations (FAO)’s own ranking?
No. Food and Agriculture Organization of the United Nations (FAO) publishes the values but ranks nobody; the position on this page is derived by Nations Inquiry by ordering the published values, and equal values share a position.
How often is the Land Area published?
This site holds 64 editions, describing 1961 to 2024.
Where does the data come from, and can I download it?
From Food and Agriculture Organization of the United Nations (FAO), under CC BY 4.0. From FAOSTAT's Land Use domain, read from the FAO's own bulk download and converted from 1000 hectares to square kilometres. The World Bank serves the same series but its copy has drifted — 26 countries differ in 2022. Every edition is on this site’s Datasets pages as a full table, and downloads as a CSV file with every value unrounded.
12Method
Sources, method and citation
Source
Land Area — Food and Agriculture Organization of the United Nations (FAO)
From FAOSTAT's Land Use domain, read from the FAO's own bulk download and converted from 1000 hectares to square kilometres. The World Bank serves the same series but its copy has drifted — 26 countries differ in 2022.
Newest edition
Report year 2024Data year 2024
Cite the source as: FAO. FAOSTAT Land, Inputs and Sustainability: Land Use. Rome: Food and Agriculture Organization of the United Nations.
Licence: CC BY 4.0, checked 2026-09-10.
How this page reads the numbers
- Food and Agriculture Organization of the United Nations (FAO) ranks nobody on this measure. The position is derived by Nations Inquiry by ordering the published values; equal values share a position.
- This statistic has no better end, so the page describes higher and lower values and never calls a country a leader.
- A country is named at an end only when it holds that value alone. Where several share it, the page says how many and names none first.
- Values are stored exactly as published and trimmed only for display. “The middle country” is the median of the countries measured, not a world average.
The file itself, column by column — where it came from, what each column holds, and every edition as a CSV — is on its dataset page.
Cite this page
Nations Inquiry (2026). Land area by country: Land Area, data from Food and Agriculture Organization of the United Nations (FAO). https://nationsinquiry.com/statistics/land-area