World Bank Group · Political Stability and Absence of Violence
Political stability by country
How likely is a government to be overthrown by violent or unconstitutional means?
Andorra placed first of the 211 countries compared in 2025, at 1.56343, and Yemen last, at -2.50634. In the middle country the figure was 0.17060. Among the 187 countries measured in every edition since 1996, the middle one moved from -0.07971 to 0.08365.
Share
Political stability · 2025
Key statistic · Peace & Security


Highest of 211Andorra
1.56343012025 · position · derived
Who leads
The three countries at the highest end of 211 compared, the three at the other end, and the first on each continent.
 1
Photo: Tiia Monto derivative work: Jjtkk · CC BY-SA 3.0, greyscale
 2
Photo: Guido Radig,Inkey · CC BY 3.0, greyscale
 3
Photo: User:Crescentmoon56 · CC0, greyscale

Highest on each continent
- Africa
 Seychelles1.17168
- Americas
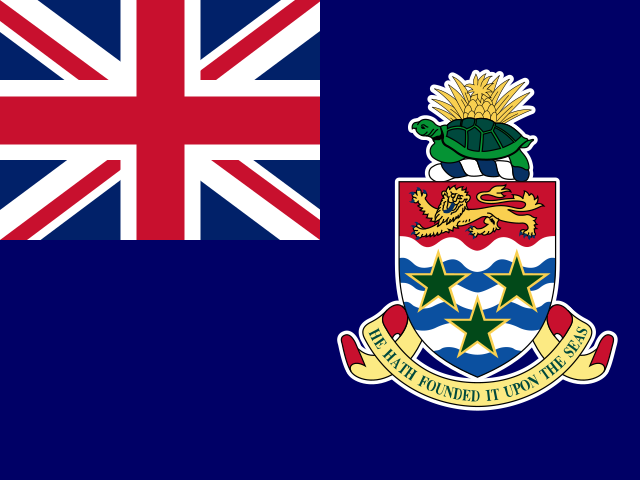 Cayman Islands1.48936
- Asia
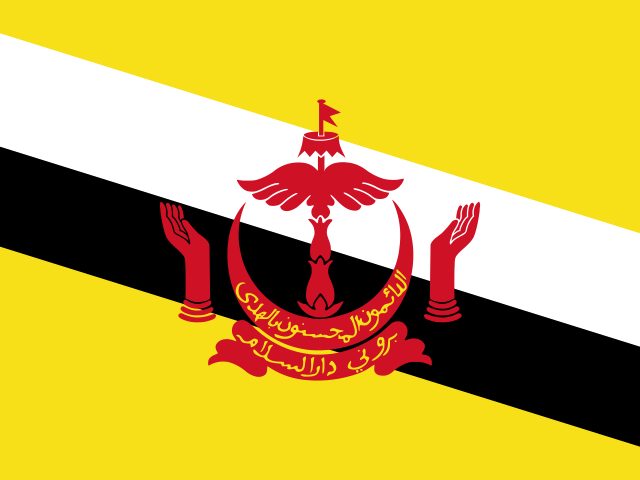 Brunei1.49912
- EuropeAndorra1.56343
- Oceania
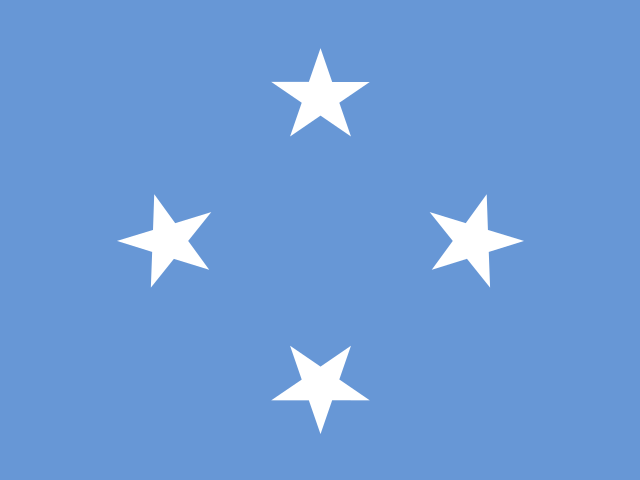
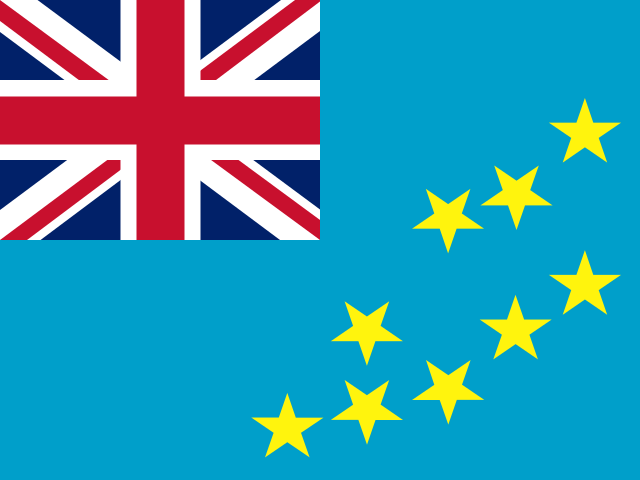
2 countries share 1.51767
- Every region
02Every measured country
Political stability on a map
Each country is shaded by its value, in five groups holding the same number of countries. Hover a country for its value, or select it to open its profile. Below the map, each continent’s middle country.
Darker is a higher value — the better end.
- -2.50634–-0.65442
- -0.64170–-0.09359
- -0.09223–0.46761
- 0.50933–1.01978
- 1.02060–1.56343
- No reading in 2025
- Oceania
1.20451
the middle country, of 20 measured · 21 members
2 share 1.51767
 Papua New Guinea-0.54613
Highest and lowest reading in Oceania.
- Europe
0.60051
the middle country, of 44 measured · 49 members
Andorra1.56343 Russia-0.94496
Highest and lowest reading in Europe.
- Americas
0.50547
the middle country, of 42 measured · 48 members
Cayman Islands1.48936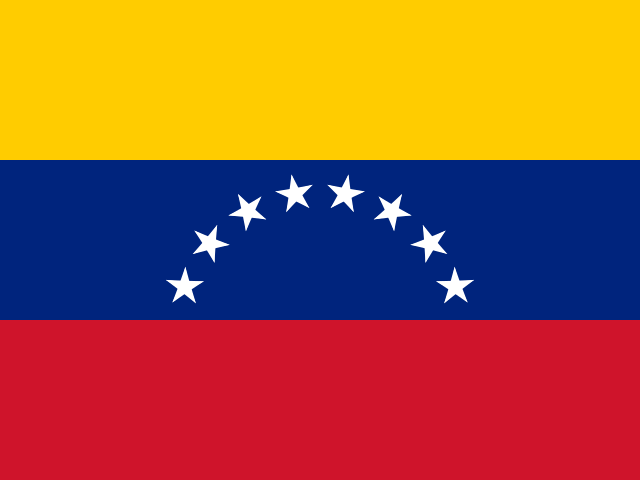 Venezuela-1.50836
Highest and lowest reading in Americas.
- Asia
-0.01601
the middle country, of 51 measured · 52 members
Brunei1.49912 Yemen-2.50634
Highest and lowest reading in Asia.
- Africa
-0.55669
the middle country, of 54 measured · 55 members
Seychelles1.17168 Mali-2.49891
Highest and lowest reading in Africa.
- Every region
22 sub-regions, highest middle country first
- Polynesia
1.33514
the middle country, of 7 measured · 7 members
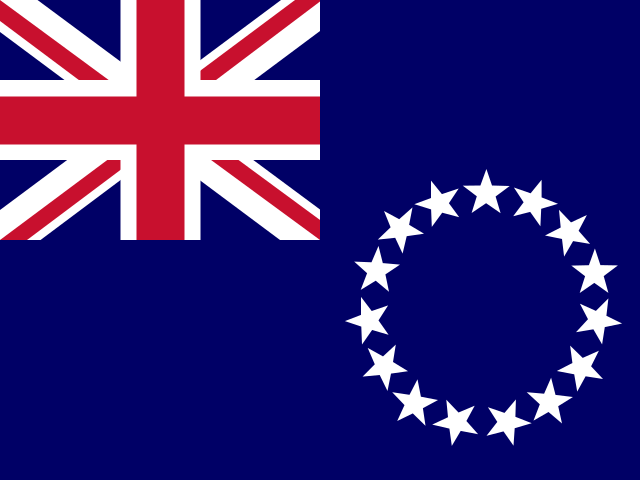 Cook Islands1.44271
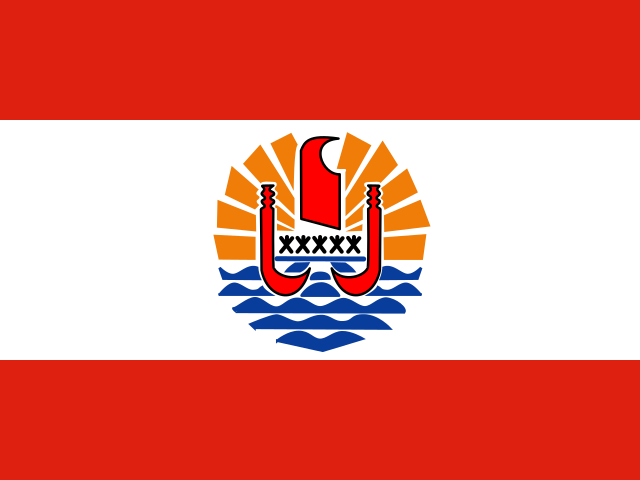 French Polynesia0.57606
Highest and lowest reading in Polynesia.
- Micronesia
1.27363
the middle country, of 6 measured · 7 members
2 share 1.51767
 Guam1.19124
Highest and lowest reading in Micronesia.
- Caribbean
1.07298
the middle country, of 18 measured · 24 members
Cayman Islands1.48936 Haiti-1.37987
Highest and lowest reading in Caribbean.
- Northern Europe
0.87000
the middle country, of 10 measured · 13 members
 Iceland1.32132
 United Kingdom0.28969
Highest and lowest reading in Northern Europe.
- Eastern Asia
0.84616
the middle country, of 8 measured · 8 members
 Japan1.25859
 China0.02248
Highest and lowest reading in Eastern Asia.
- Melanesia
0.74742
the middle country, of 5 measured · 5 members
 Fiji0.98234Papua New Guinea-0.54613
Highest and lowest reading in Melanesia.
- Western Europe
0.53452
the middle country, of 9 measured · 9 members
 Liechtenstein1.52598
 France-0.09223
Highest and lowest reading in Western Europe.
- Southern Europe
0.44822
the middle country, of 15 measured · 17 members
Andorra1.56343 Bosnia and Herzegovina-0.34012
Highest and lowest reading in Southern Europe.
- South-eastern Asia
0.33467
the middle country, of 11 measured · 11 members
Brunei1.49912 Myanmar-2.11608
Highest and lowest reading in South-eastern Asia.
- Eastern Europe
0.22592
the middle country, of 10 measured · 10 members
 Czechia1.02060Russia-0.94496
Highest and lowest reading in Eastern Europe.
- Central America
0.05053
the middle country, of 8 measured · 8 members
 Costa Rica1.22297
 Mexico-0.60816
Highest and lowest reading in Central America.
- Southern Africa
-0.01092
the middle country, of 5 measured · 5 members
 Botswana1.07871
 Eswatini-0.57062
Highest and lowest reading in Southern Africa.
- South America
-0.01249
the middle country, of 12 measured · 12 members
 Uruguay1.30034Venezuela-1.50836
Highest and lowest reading in South America.
- Central Asia
-0.01601
the middle country, of 5 measured · 5 members
 Turkmenistan0.23579
 Tajikistan-0.29508
Highest and lowest reading in Central Asia.
- Western Asia
-0.38251
the middle country, of 18 measured · 19 members
 Qatar1.04136Yemen-2.50634
Highest and lowest reading in Western Asia.
- Middle Africa
-0.48857
the middle country, of 9 measured · 9 members
 São Tomé and Príncipe0.54576
 DR Congo-2.13181
Highest and lowest reading in Middle Africa.
- Eastern Africa
-0.56218
the middle country, of 18 measured · 19 members
Seychelles1.17168 Somalia-2.16788
Highest and lowest reading in Eastern Africa.
- Western Africa
-0.59260
the middle country, of 16 measured · 16 members
 Cabo Verde0.85881Mali-2.49891
Highest and lowest reading in Western Africa.
- Southern Asia
-0.60788
the middle country, of 9 measured · 9 members
 Bhutan1.39326
 Afghanistan-2.04271
Highest and lowest reading in Southern Asia.
- Northern Africa
-0.79301
the middle country, of 6 measured · 6 members
 Morocco-0.54277
 Sudan-2.06928
Highest and lowest reading in Northern Africa.
- Australia and New Zealand
2 of 2 measured — too few for a middle: Australia, New Zealand.
 New Zealand1.18153
 Australia0.78059
Highest and lowest reading in Australia and New Zealand.
- Northern America
4 of 4 measured — too few for a middle: Bermuda, Canada, Greenland, United States.
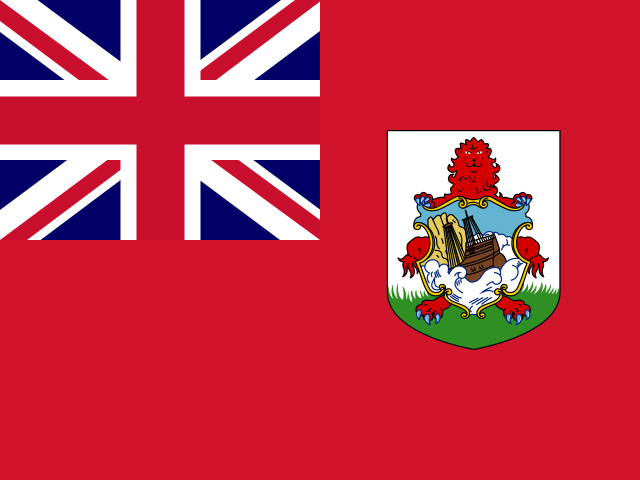 Bermuda1.08058
 United States-0.30208
Highest and lowest reading in Northern America.
03The whole field at once
The spread
211 countries, one dot each, on one scale — further right is a higher value. Half the countries are above 0.17060; a quarter are above 0.90246, and a quarter below -0.51059. The bar in each row marks that continent’s middle country.
04All 211 ever measured
Every country
In order, highest value first. “=” marks a position shared with another country. World Bank Group ranks nobody on this measure; the position is derived here by ordering the published values. A HIGHER score means MORE stable — the dimension is named for the good end, unlike most measures of violence — so Somalia at −3.05 in 2007, the lowest reading in the series, is the least stable rather than the most.
Showing 25 of 211 countries

















































































































































Values for 2025. The change column compares 2025 with 2024 only; the sparkline covers the recent editions.
051996–2025 · 27 editions
Over time
Each point is one annual estimate. The scale is a z-score: the world average is fixed at 0 every year, so a country can improve in absolute terms and still fall down this line.
- the middle country
- the middle half of countries
- the middle of the 187 countries measured every time
- each continent’s middle country
The same, year by year
| Year | Countries | Middle country | Middle half | Measured every time |
|---|---|---|---|---|
| 2025 | 211 | 0.17060 | -0.51059 – 0.90246 | 0.08365 |
| 2024 | 211 | 0.13853 | -0.55999 – 0.88171 | -0.01693 |
| 2023 | 211 | 0.12693 | -0.55898 – 0.91638 | 0.00213 |
| 2022 | 211 | 0.09910 | -0.57308 – 0.89202 | -0.06983 |
| 2021 | 211 | 0.08362 | -0.56691 – 0.86462 | -0.11351 |
| 2020 | 211 | 0.05820 | -0.57421 – 0.89162 | -0.08062 |
| 2019 | 211 | 0.06776 | -0.57376 – 0.86894 | -0.06560 |
| 2018 | 210 | 0.11208 | -0.65182 – 0.84510 | -0.05951 |
| 2017 | 207 | 0.01767 | -0.64527 – 0.80605 | -0.06864 |
| 2016 | 207 | -0.01606 | -0.62167 – 0.80786 | -0.12419 |
| 2015 | 207 | 0.04643 | -0.69108 – 0.87507 | -0.06419 |
| 2014 | 209 | 0.03663 | -0.63222 – 0.93864 | -0.03500 |
| 2013 | 209 | -0.00604 | -0.80853 – 0.90048 | -0.09391 |
| 2012 | 209 | 0.04699 | -0.68513 – 0.89985 | -0.08250 |
| 2011 | 209 | -0.00340 | -0.69292 – 0.90162 | -0.09299 |
| 2010 | 208 | 0.01002 | -0.63041 – 0.90415 | -0.06717 |
| 2009 | 208 | 0.15790 | -0.55585 – 0.91408 | 0.00357 |
| 2008 | 205 | 0.07442 | -0.56663 – 0.80950 | -0.00804 |
| 2007 | 205 | 0.11545 | -0.57867 – 0.79929 | 0.04391 |
| 2006 | 205 | 0.08124 | -0.68651 – 0.88434 | -0.04524 |
| 2005 | 205 | 0.03079 | -0.73520 – 0.86768 | -0.07329 |
| 2004 | 205 | -0.03067 | -0.68855 – 0.68556 | -0.14451 |
| 2003 | 200 | 0.06828 | -0.93595 – 0.78090 | -0.03723 |
| 2002 | 190 | -0.01538 | -0.83005 – 0.79624 | -0.02913 |
| 2000 | 189 | -0.02124 | -0.82561 – 0.76280 | -0.02155 |
| 1998 | 188 | -0.00082 | -0.85432 – 0.77793 | -0.00203 |
| 1996 | 187 | -0.07971 | -0.83395 – 0.76897 | -0.07971 |
062024 → 2025
Who rose and fell
The biggest changes in value between the two newest editions. Places are shown second, because they also move when other countries do.
Improved most
before → after Bangladesh-1.41755 → -0.94143 · 188th → 182nd+0.47611
 Gabon-0.32128 → 0.11656 · 140th → 111th+0.43784
 Kyrgyzstan-0.39607 → -0.01601 · 148th → 123rd+0.38006
- Cook Islands1.11612 → 1.44271 · 31st → 7th+0.32659
 Guinea-1.04287 → -0.73188 · 183rd → 173rd+0.31099
Declined most
before → after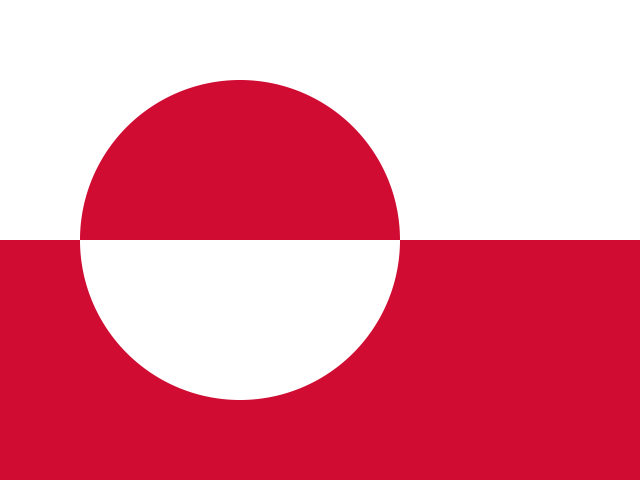 Greenland1.25053 → 0.79006 · 23rd → 63rd−0.46046
- French Polynesia1.03436 → 0.57606 · 39th → 77th−0.45830
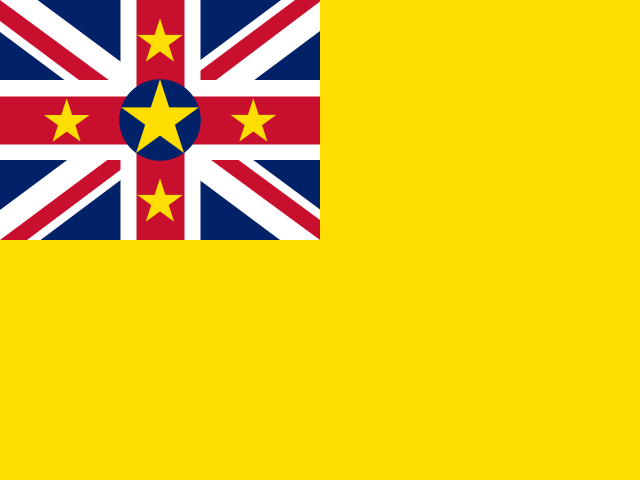 Niue1.45444 → 1.01171 · 6th → 44th−0.44273
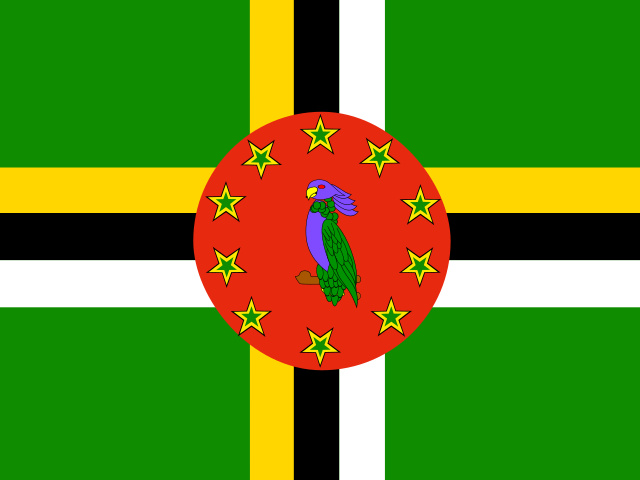 Dominica1.26137 → 0.98300 · 17th → 46th−0.27837
 Iran-1.44104 → -1.69059 · 189th → 193rd−0.24955
211 countries were measured in both 2024 and 2025.
07Across every edition
Political stability in records
The extremes of the statistic. A record reached by more than one country names none of them.
Highest reading on record
1.76267
Political Stability estimate (−2.5 to 2.5)
Lowest reading on record
-3.04820
Political Stability estimate (−2.5 to 2.5)
Biggest improvement between editions
+1.35277
-1.97848 → -0.62572
Biggest decline between editions
−1.34261
0.53083 → -0.81177
Most improved since first measured
+2.45298
-2.58979 → -0.13681
At the top most often
11 of 27
editions, alone at the first-listed end
08The measure
About political stability
Political Stability and Absence of Violence is the World Bank’s estimate of how likely a government is to be brought down by unconstitutional or violent means, including politically motivated violence and terrorism. It is scored from −2.5 to 2.5 across 200 countries, back to 1996.
What the number is: Political Stability estimate (−2.5 to 2.5).
What it does not measure
It is an estimate built from risk ratings and surveys, with a margin of error. A stable government is not necessarily a free or effective one.
09Where it fits
Connections
Its part in the Country Index, the statistics whose values line up most closely with it across countries, and others on the same subject.
In the Country Index
A key statistic for Peace & Security
“Whether a country is at risk of violent upheaval — politically motivated violence, terrorism and the threat of destabilisation. It is the closest measure this site has to whether a state is at peace with itself.”
- Edition used
- 2025 (data 2025)
- Countries
- 211
- Licence
- CC BY 4.0
Moves with
Where political stability is higher, these tend to be higher too.
- Rule of LawKeyWorld Bank Group · 211 countries in commonρ 0.82
- Corruption Perceptions IndexKeyTransparency International · 182 countries in commonρ 0.78
- Control of CorruptionWorld Bank Group · 211 countries in commonρ 0.77
Moves against
Where political stability is higher, these tend to be lower.
- INFORM Risk IndexKeyEuropean Commission Joint Research Centre, with the Inter-Agency Standing Committee · 191 countries in commonρ −0.84
- Refugees by Country of OriginUNHCR, the UN Refugee Agency · 199 countries in commonρ −0.81
- Political Violence by Non-State ActorsKeyV-Dem Institute, University of Gothenburg · 171 countries in commonρ −0.79
Rank correlation (ρ, from −1 to 1) across countries, on each statistic’s newest edition, out of 385 statistics sharing at least 80 countries with this one. Two statistics that move together do not cause each other.
10Analysis
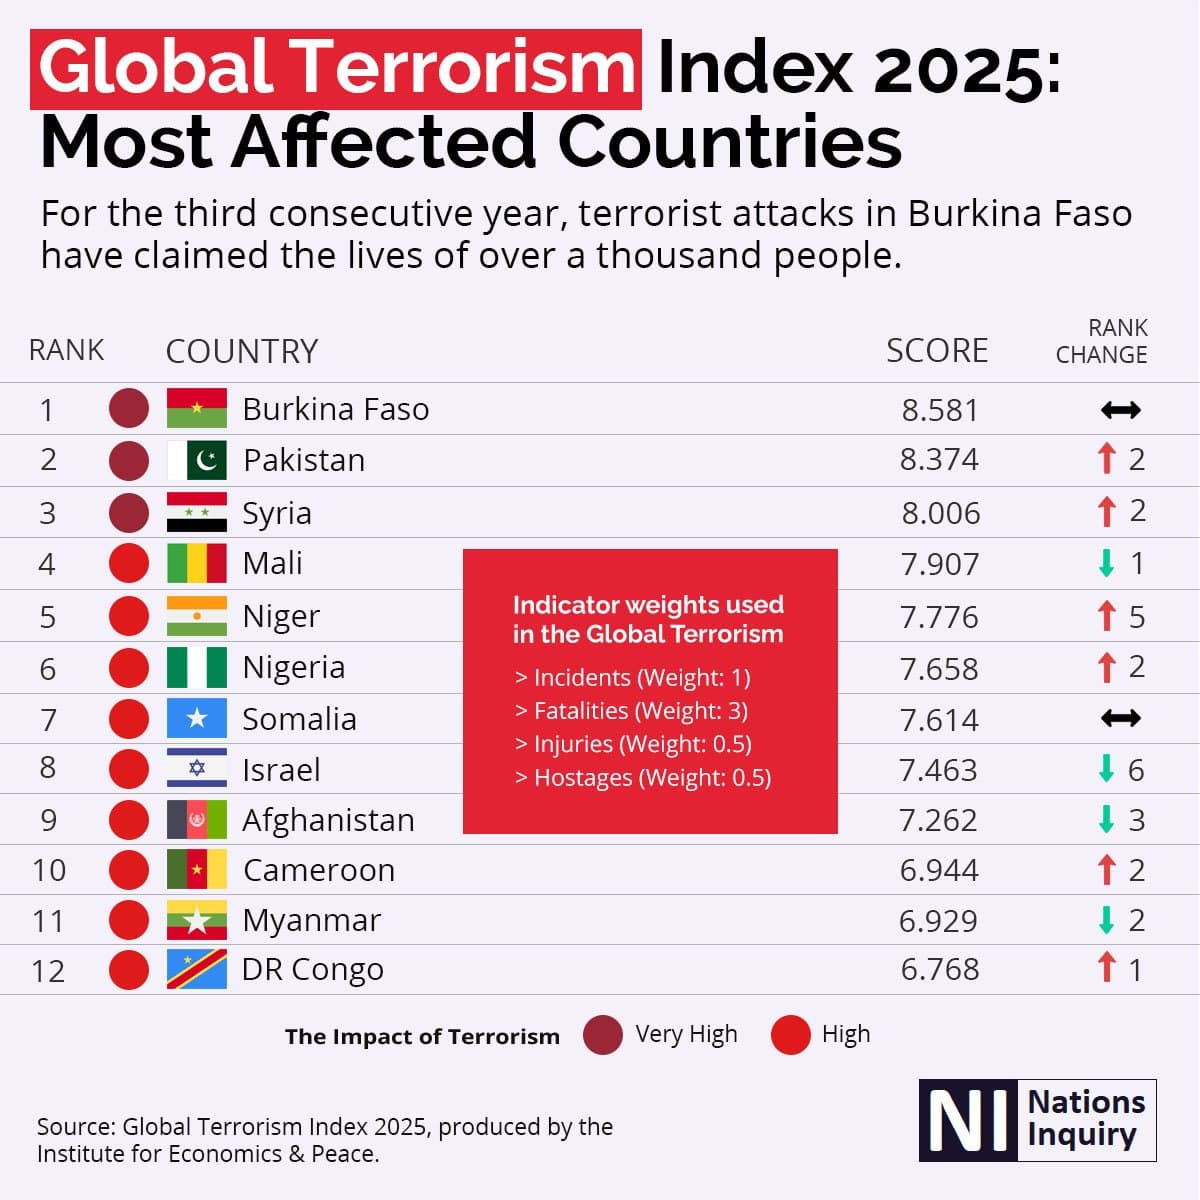
Charts and analysis on political stability
11Keep reading
Explore further
The subject
The countries at either end
More from World Bank Group
12Questions
Political stability: questions and answers
Which country has the highest political stability?
Andorra, at 1.56343, among the 211 countries compared in 2025.
Which country has the lowest political stability?
Yemen, at -2.50634, among the 211 countries compared in 2025.
How many countries does the Political Stability and Absence of Violence cover?
211 in 2025. The number measured varies from 187 to 211 between editions.
What is the world average political stability?
This site does not calculate a world average, which would depend on how countries are weighted. In the middle country of the 211 compared in 2025, the figure was 0.17060.
Is this World Bank Group’s own ranking?
No. World Bank Group publishes the values but ranks nobody; the position on this page is derived by Nations Inquiry by ordering the published values, and equal values share a position.
How often is the Political Stability and Absence of Violence published?
This site holds 27 editions, describing 1996 to 2025.
Where does the data come from, and can I download it?
From World Bank Group, under CC BY 4.0. One of the six Worldwide Governance Indicators; the same figures also appear as a column of the Government Effectiveness table. The Bank’s 0–100 governance score is a rescaled estimate on a fixed scale — not a percentile and not a league place. Every edition is on this site’s Datasets pages as a full table, and downloads as a CSV file with every value unrounded.
13Method
Sources, method and citation
Source
Political Stability and Absence of Violence — World Bank Group
One of the six Worldwide Governance Indicators; the same figures also appear as a column of the Government Effectiveness table. The Bank’s 0–100 governance score is a rescaled estimate on a fixed scale — not a percentile and not a league place.
Newest edition
Report year 2025Data year 2025
Cite the source as: World Bank. Worldwide Governance Indicators. Washington, DC: World Bank Group.
Licence: CC BY 4.0, checked 2026-09-07.
How this page reads the numbers
- World Bank Group ranks nobody on this measure. The position is derived by Nations Inquiry by ordering the published values; equal values share a position.
- Which end is better follows the publisher’s own reading of the measure.
- A country is named at an end only when it holds that value alone. Where several share it, the page says how many and names none first.
- Values are stored exactly as published and trimmed only for display. “The middle country” is the median of the countries measured, not a world average.
The file itself, column by column — where it came from, what each column holds, and every edition as a CSV — is on its dataset page.
Photographs
The countries at the top of this statistic, from their profiles: Wikimedia Commons, shown in greyscale, each used under the licence named.
- Andorra — Tiia Monto derivative work: Jjtkk, CC BY-SA 3.0
- Liechtenstein — Guido Radig,Inkey, CC BY 3.0
- Micronesia — User:Crescentmoon56, CC0
Cite this page
Nations Inquiry (2026). Political stability by country: Political Stability and Absence of Violence, data from World Bank Group. https://nationsinquiry.com/statistics/political-stability