Loading…
European Commission Joint Research Centre, with the Inter-Agency Standing Committee · INFORM Risk Index
INFORM Risk Index by country
How likely is a humanitarian crisis to overwhelm a country?
Of the 191 countries compared in 2025, Singapore had the lowest reading, 0.7, and South Sudan had the highest reading, 8.5. In the middle country the figure was 3.7. Among the 191 countries measured in every edition since 2016, the middle one moved from 3.6 to 3.7.
INFORM Risk Index · 2025
Key statistic · Risk & Resilience

Lowest of 191Singapore
0.7012025 · position · derived
Who leads
The three countries at the lowest end of 191 compared, the three at the other end, and the first on each continent.
 1
1Photo: Khairul Nizam . · CC BY 2.0, greyscale
 2
2Photo: Guido Radig,Inkey · CC BY 3.0, greyscale
 3
3Photo: Michal Osmenda from Brussels, Belgium · CC BY-SA 2.0, greyscale

Highest in 2025
 South Sudan8.5
 Yemen8.1
 Somalia8.1
Where a country sits says how it compares with the others measured, and nothing about why.
Lowest on each continent
- Africa
 Seychelles1.4
 - Americas
- AsiaSingapore0.7
- Europe
2 countries share 1.0
- Oceania
 New Zealand1.6
 - Every region
02Every measured country
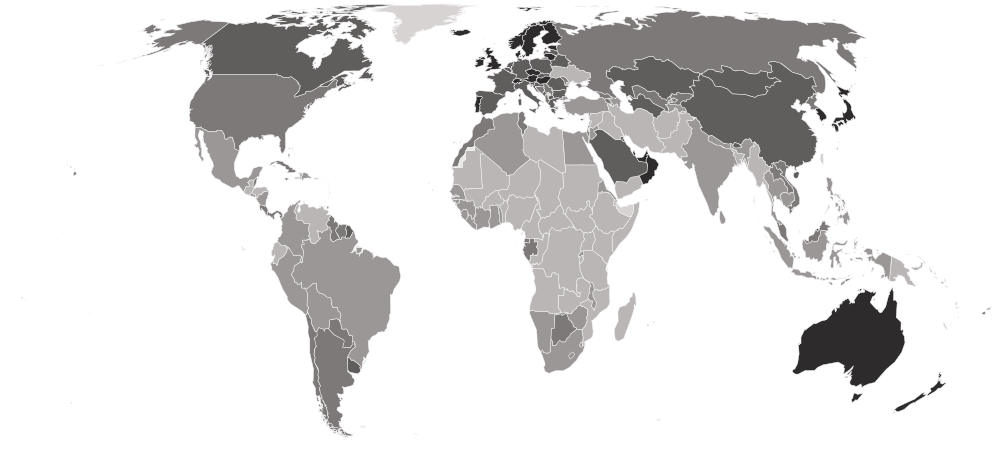
INFORM Risk Index on a map
Each country is shaded by its value, in five groups holding the same number of countries. Hover a country for its value, or select it to open its profile. Below the map, each continent’s middle country.
Darker is a lower value — the better end.
- 5.5–8.5
- 4.2–5.4
- 3.1–4.1
- 2.5–3.0
- 0.7–2.4
- No reading in 2025
- Europe
2.5
the middle country, of 40 measured · 49 members
2 share 1.0
 Ukraine5.6
Lowest and highest reading in Europe.
- Oceania
3.1
the middle country, of 14 measured · 21 members
New Zealand1.6 Papua New Guinea6.3
Lowest and highest reading in Oceania.
- Americas
3.7
the middle country, of 35 measured · 48 members
 Saint Kitts and Nevis1.9
 Haiti7.5
Lowest and highest reading in Americas.
- Asia
3.8
the middle country, of 48 measured · 52 members
Singapore0.7Yemen8.1Lowest and highest reading in Asia.
- Africa
5.4
the middle country, of 54 measured · 55 members
Seychelles1.4South Sudan8.5Lowest and highest reading in Africa.
- Every region
22 sub-regions, lowest middle country first
- Northern Europe
1.9
the middle country, of 10 measured · 13 members
 Denmark1.3
 Latvia2.6
Lowest and highest reading in Northern Europe.
- Western Europe
2.5
the middle country, of 8 measured · 9 members
2 share 1.0
3 share 2.6
Lowest and highest reading in Western Europe.
- Southern Europe
2.7
the middle country, of 12 measured · 17 members
 Malta1.7
 Bosnia and Herzegovina3.6
Lowest and highest reading in Southern Europe.
- Eastern Europe
2.8
the middle country, of 10 measured · 10 members
 Czechia1.9Ukraine5.6
Lowest and highest reading in Eastern Europe.
- Caribbean
2.8
the middle country, of 13 measured · 24 members
Saint Kitts and Nevis1.9Haiti7.5Lowest and highest reading in Caribbean.
- Eastern Asia
2.8
the middle country, of 5 measured · 8 members
 South Korea2.0
 North Korea3.7
Lowest and highest reading in Eastern Asia.
- Micronesia
3.3
the middle country, of 5 measured · 7 members
2 share 2.1
 Kiribati3.6
Lowest and highest reading in Micronesia.
- Western Asia
3.5
the middle country, of 18 measured · 19 members
 Qatar1.4Yemen8.1
Lowest and highest reading in Western Asia.
- Central Asia
3.6
the middle country, of 5 measured · 5 members
 Kazakhstan2.8
 Tajikistan4.6
Lowest and highest reading in Central Asia.
- South-eastern Asia
4.0
the middle country, of 11 measured · 11 members
Singapore0.7 Myanmar6.9
Lowest and highest reading in South-eastern Asia.
- South America
4.3
the middle country, of 12 measured · 12 members
 Uruguay2.5
 Venezuela5.9
Lowest and highest reading in South America.
- Southern Africa
4.3
the middle country, of 5 measured · 5 members
 Botswana3.3
 South Africa5.1
Lowest and highest reading in Southern Africa.
- Central America
4.4
the middle country, of 8 measured · 8 members
 Costa Rica3.7
 Guatemala5.8
Lowest and highest reading in Central America.
- Northern Africa
4.7
the middle country, of 6 measured · 6 members
 Tunisia3.5
 Sudan7.8
Lowest and highest reading in Northern Africa.
- Southern Asia
5.3
the middle country, of 9 measured · 9 members
 Maldives2.1
 Afghanistan7.8
Lowest and highest reading in Southern Asia.
- Western Africa
5.3
the middle country, of 16 measured · 16 members
 Cabo Verde2.6
 Niger7.5
Lowest and highest reading in Western Africa.
- Eastern Africa
5.6
the middle country, of 18 measured · 19 members
Seychelles1.4South Sudan8.5Lowest and highest reading in Eastern Africa.
- Middle Africa
6.0
the middle country, of 9 measured · 9 members
 São Tomé and Príncipe2.5
 DR Congo8.0
Lowest and highest reading in Middle Africa.
- Australia and New Zealand
2 of 2 measured — too few for a middle: Australia, New Zealand.
New Zealand1.6 Australia2.4
Lowest and highest reading in Australia and New Zealand.
- Melanesia
4 of 5 measured — too few for a middle: Fiji, Papua New Guinea, Solomon Islands, Vanuatu.
 Fiji3.1Papua New Guinea6.3
Lowest and highest reading in Melanesia.
- Northern America
2 of 4 measured — too few for a middle: Canada, United States.
 Canada2.8
 United States3.2
Lowest and highest reading in Northern America.
- Polynesia
3 of 7 measured — too few for a middle: Samoa, Tonga, Tuvalu.
 Tuvalu2.5
 Tonga3.0
Lowest and highest reading in Polynesia.
03The whole field at once
The spread
191 countries, one dot each, on one scale — further right is a higher value. Half the countries are above 3.7; a quarter are above 5.3, and a quarter below 2.6. The bar in each row marks that continent’s middle country.
04All 191 ever measured
Every country
In order, highest value first — position 1 is the highest value, the way European Commission Joint Research Centre, with the Inter-Agency Standing Committee’s own tables read. “=” marks a position shared with another country. European Commission Joint Research Centre, with the Inter-Agency Standing Committee ranks nobody on this measure; the position is derived here by ordering the published values. Scores are published to one decimal, so 191 countries hold only 65 distinct values between them; ten countries sit on 2.6 alone. Neighbouring positions should be read as the same reading, which is exactly what INFORM’s own five risk classes say.
Showing 25 of 191 countries









































































































































Values for 2025. The change column compares 2025 with 2024 only; the sparkline covers the recent editions.
052016–2025 · 10 editions
Over time
Each point is one published edition, named for the year it is released and built from the year before — so the 2026 edition describes 2025.
- the middle country
- the middle half of countries
- the middle of the 191 countries measured every time
- each continent’s middle country
The same, year by year
| Year | Countries | Middle country | Middle half | Measured every time |
|---|---|---|---|---|
| 2025 | 191 | 3.7 | 2.6 – 5.3 | 3.7 |
| 2024 | 191 | 3.5 | 2.6 – 5.3 | 3.5 |
| 2023 | 191 | 3.6 | 2.6 – 5.2 | 3.6 |
| 2022 | 191 | 3.6 | 2.6 – 5.2 | 3.6 |
| 2021 | 191 | 3.6 | 2.4 – 5.3 | 3.6 |
| 2020 | 191 | 3.6 | 2.4 – 5.3 | 3.6 |
| 2019 | 191 | 3.6 | 2.4 – 5.1 | 3.6 |
| 2018 | 191 | 3.5 | 2.4 – 5.1 | 3.5 |
| 2017 | 191 | 3.5 | 2.5 – 5.2 | 3.5 |
| 2016 | 191 | 3.6 | 2.4 – 5.3 | 3.6 |
062024 → 2025
Who rose and fell
The biggest changes in value between the two newest editions. Places are shown second, because they also move when other countries do.
Improved most
before → after Mauritania5.8 → 5.5 · 31st → 39th−0.3
- Tonga3.3 → 3.0 · 107th → 120th−0.3
- Venezuela6.2 → 5.9 · 23rd → 28th−0.3
 Comoros3.5 → 3.3 · 96th → 110th−0.2
 Honduras5.8 → 5.6 · 31st → 35th−0.2
Worsened most
before → after Argentina3.1 → 3.7 · 117th → 94th+0.6
 Jamaica3.2 → 3.8 · 113th → 90th+0.6
 Eswatini3.7 → 4.3 · 92nd → 75th+0.6
 Dominican Republic4.4 → 4.9 · 73rd → 60th+0.5
 Cambodia4.6 → 5.1 · 66th → 54th+0.5
191 countries were measured in both 2024 and 2025.
07Across every edition
INFORM Risk Index in records
The extremes of the statistic. A record reached by more than one country names none of them.
Highest reading on record
8.7
INFORM Risk score (0–10, where 10 is the highest risk)
European Commission Joint Research Centre, with the Inter-Agency Standing Committee · 2016
Lowest reading on record
0.6
INFORM Risk score (0–10, where 10 is the highest risk)
European Commission Joint Research Centre, with the Inter-Agency Standing Committee · 2016
Biggest improvement between editions
−0.9
4.0 → 3.1
European Commission Joint Research Centre, with the Inter-Agency Standing Committee · 2021 → 2022
Biggest decline between editions
+1.0
3.0 → 4.0
European Commission Joint Research Centre, with the Inter-Agency Standing Committee · 2021 → 2022
Most improved since first measured
−1.4
4.3 → 2.9
European Commission Joint Research Centre, with the Inter-Agency Standing Committee · 2016 → 2025
At the top most often
10 of 10
editions, alone at the first-listed end
European Commission Joint Research Centre, with the Inter-Agency Standing Committee · 2016–2025
08The parts of the index
Inside the number
European Commission Joint Research Centre, with the Inter-Agency Standing Committee publishes the parts the headline is built from. Each part’s highest and lowest country, and its middle value.
| Part | Highest | Lowest | Middle country |
|---|---|---|---|
| Hazard & Exposure191 countries |  Syria8.6 Syria8.6 |  Luxembourg0.5 Luxembourg0.5 | 3.7 |
| Vulnerability191 countries | Somalia9.4 | Singapore0.5 | 3.8 |
| Lack of Coping Capacity191 countries | South Sudan9.2 | Denmark0.7 | 4.2 |
09The measure
About INFORM Risk Index
INFORM Risk scores a country’s exposure to humanitarian crisis from 0 to 10, combining the hazards it faces, how vulnerable its people are, and how little capacity there is to cope. Built by the European Commission’s Joint Research Centre with the UN’s Inter-Agency Standing Committee, it is what aid agencies use to decide where to prepare.
What the number is: INFORM Risk score (0–10, where 10 is the highest risk).
What it does not measure
It is a risk profile, not a forecast of any particular crisis, and it does not measure how severe a crisis already under way has become — the INFORM Severity Index does that.
10Where it fits
Connections
Its part in the Country Index, the statistics whose values line up most closely with it across countries, and others on the same subject.
In the Country Index
A key statistic for Risk & Resilience
“Humanitarian crisis risk, which counts conflict and displacement that the hazard indices leave out. Correlates 0.468 with the World Risk Index.”
- Edition used
- 2026 (data 2025)
- Countries
- 191
- Licence
- CC BY 4.0 (via the European Commission's reuse policy)
Moves with
Where INFORM Risk Index is higher, these tend to be higher too.
- Gender Inequality IndexKeyUNDP Human Development Report Office · 172 countries in commonρ 0.83
- INFORM Severity IndexACAPS · 81 countries in commonρ 0.81
- Self-Employment RateILO · 174 countries in commonρ 0.81
Moves against
Where INFORM Risk Index is higher, these tend to be lower.
- Ecological FootprintKeyGlobal Footprint Network · 126 countries in commonρ −0.86
- Rule of LawKeyWorld Bank Group · 191 countries in commonρ −0.83
- Political Stability and Absence of ViolenceKeyWorld Bank Group · 191 countries in commonρ −0.83
Rank correlation (ρ, from −1 to 1) across countries, on each statistic’s newest edition, out of 126 statistics sharing at least 80 countries with this one. Two statistics that move together do not cause each other.
11Keep reading
Explore further
The subject
The countries at either end
12Questions
INFORM Risk Index: questions and answers
Which country has the lowest INFORM Risk Index?
Singapore, at 0.7, among the 191 countries compared in 2025.
Which country has the highest INFORM Risk Index?
South Sudan, at 8.5, among the 191 countries compared in 2025.
How many countries does the INFORM Risk Index cover?
191 in 2025.
What is the world average INFORM Risk Index?
This site does not calculate a world average, which would depend on how countries are weighted. In the middle country of the 191 compared in 2025, the figure was 3.7.
Is this European Commission Joint Research Centre, with the Inter-Agency Standing Committee’s own ranking?
No. European Commission Joint Research Centre, with the Inter-Agency Standing Committee publishes the values but ranks nobody; the position on this page is derived by Nations Inquiry by ordering the published values, and equal values share a position.
How often is the INFORM Risk Index published?
This site holds 10 editions, describing 2016 to 2025.
Where does the data come from, and can I download it?
From European Commission Joint Research Centre, with the Inter-Agency Standing Committee, under CC BY 4.0 (via the European Commission's reuse policy). From the JRC’s own trend file, with all three dimensions stored alongside the score. It measures humanitarian crisis risk — conflict, displacement and fragility included — where the World Risk Index measures natural hazards. Near neighbours, not duplicates. Every edition is available on this site’s Datasets pages as a full table, unrounded.
13Method
Sources, method and citation
Source
INFORM Risk Index — European Commission Joint Research Centre, with the Inter-Agency Standing Committee
From the JRC’s own trend file, with all three dimensions stored alongside the score. It measures humanitarian crisis risk — conflict, displacement and fragility included — where the World Risk Index measures natural hazards. Near neighbours, not duplicates.
Newest edition
Report year 2026Data year 2025
Cite the source as: European Commission, Joint Research Centre. INFORM Risk Index. Ispra: European Commission.
Licence: CC BY 4.0 (via the European Commission's reuse policy), checked 2026-08-29.
How this page reads the numbers
- European Commission Joint Research Centre, with the Inter-Agency Standing Committee ranks nobody on this measure. The position is derived by Nations Inquiry by ordering the published values; equal values share a position.
- Which end is better follows the publisher’s own reading of the measure.
- A country is named at an end only when it holds that value alone. Where several share it, the page says how many and names none first.
- Values are stored exactly as published and trimmed only for display. “The middle country” is the median of the countries measured, not a world average.
The full note on this data
10 editions (2017–2026) covering 191 countries, from the JRC's own trend file. Each edition is named for the year it is published and is built from data for the year before, so the 2026 edition describes 2025. The score combines three dimensions — hazard and exposure, vulnerability, and lack of coping capacity — all of which are stored alongside it. ⚠ It measures HUMANITARIAN CRISIS risk, which includes conflict, displacement and political fragility, where the World Risk Index measures exposure to natural hazards. They are near neighbours but not duplicates: Afghanistan sits near the top here and mid-table there. ⚠ ⚠ INFORM publishes five risk classes rather than an ordinal ranking. A POSITION is derived here (2026-09-10) by ordering the score, and the score is published to ONE DECIMAL, so 191 countries hold only 65 distinct values between them: the deepest run is ten countries at 2.6, all sharing position 138. Neighbouring positions should be read as the same reading, which is exactly what INFORM’s own classes say.
Photographs
The countries at the top of this statistic, from their profiles: Wikimedia Commons, shown in greyscale, each used under the licence named.
- Singapore — Khairul Nizam ., CC BY 2.0
- Liechtenstein — Guido Radig,Inkey, CC BY 3.0
- Luxembourg — Michal Osmenda from Brussels, Belgium, CC BY-SA 2.0
Cite this page
Nations Inquiry (2026). INFORM Risk Index by country: INFORM Risk Index, data from European Commission Joint Research Centre, with the Inter-Agency Standing Committee. https://nationsinquiry.com/statistics/inform-risk