Loading…
BICC · Global Militarisation Index
Global Militarisation Index by country
How much weight does a country give its military compared with its society?
Of the 149 countries compared in 2023, Haiti had the lowest reading, 3.51, and Ukraine had the highest reading, 351.09. In the middle country the figure was 100.66. Among the 103 countries measured in every edition since 1990, the middle one moved from 135.77 to 97.92.
Part ofPeace & Security
Global Militarisation Index · 2023
Key statistic · Peace & Security

Lowest of 149Haiti
3.51012023 · BICC’s rank
Who leads
The three countries at the lowest end of 149 compared, the three at the other end, and the first on each continent.
 1
1Photo: Santiagockn · CC0, greyscale
 2
2Photo: Dirk Heldmaier derivative work: Jjtkk · CC BY-SA 3.0, greyscale
 3
3Photo: Damiano Luchetti · CC0, greyscale
Lowest on each continent
- Africa
 Mauritius32.58
 - AmericasHaiti3.51
- Asia
 Timor-Leste47.92
 - Europe
 Malta27.55
 - Oceania
 Papua New Guinea34.09
4 of 21 measured
- Every region
02Every measured country
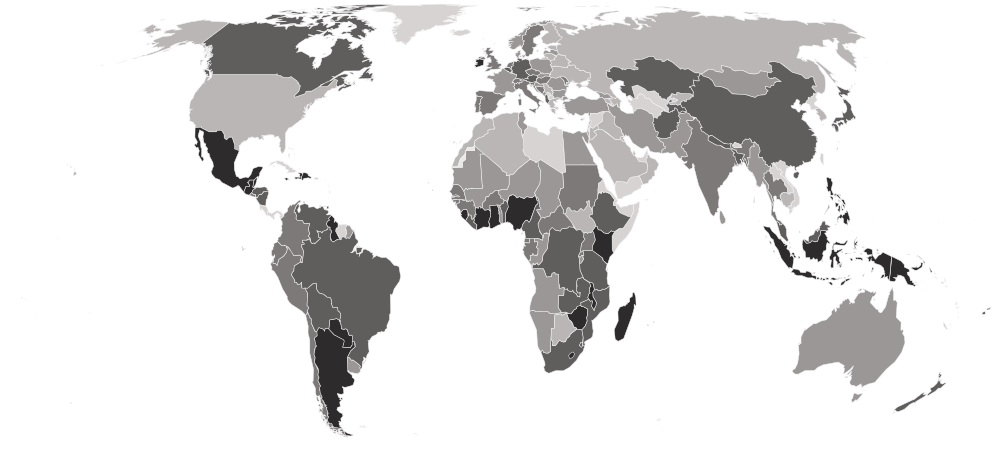
Global Militarisation Index on a map
Each country is shaded by its value, in five groups holding the same number of countries. Hover a country for its value, or select it to open its profile. Below the map, each continent’s middle country.
Darker is a lower value — the better end.
- 148.64–351.09
- 115.01–143.33
- 89.73–114.10
- 66.58–89.30
- 3.51–66.27
- No reading in 2023 (13 measured in an earlier edition)
- Americas
73.31
the middle country, of 23 measured · 48 members
Haiti3.51 United States153.29
Lowest and highest reading in Americas.
- Africa
91.15
the middle country, of 48 measured · 55 members
Mauritius32.58 Algeria206.01
Lowest and highest reading in Africa.
- Europe
112.59
the middle country, of 37 measured · 49 members
Malta27.55 Ukraine351.09
Lowest and highest reading in Europe.
- Asia
140.64
the middle country, of 37 measured · 52 members
Timor-Leste47.92 Israel262.28
Lowest and highest reading in Asia.
- Oceania
4 of 21 measured — too few for a middle: Australia, Fiji, New Zealand, Papua New Guinea.
Papua New Guinea34.09 Australia115.92
Lowest and highest reading in Oceania.
- Every region
20 sub-regions, lowest middle country first
- Central America
63.42
the middle country, of 6 measured · 8 members
 Guatemala42.60
 El Salvador90.75
Lowest and highest reading in Central America.
- Southern Africa
69.82
the middle country, of 5 measured · 5 members
 Lesotho59.42
 Botswana156.68
Lowest and highest reading in Southern Africa.
- Eastern Africa
72.01
the middle country, of 14 measured · 19 members
Mauritius32.58 South Sudan179.32
Lowest and highest reading in Eastern Africa.
- Western Africa
83.27
the middle country, of 16 measured · 16 members
 Cabo Verde33.50
 Togo143.33
Lowest and highest reading in Western Africa.
- South America
88.07
the middle country, of 11 measured · 12 members
 Guyana55.24
 Uruguay136.32
Lowest and highest reading in South America.
- Western Europe
90.30
the middle country, of 7 measured · 9 members
 Austria86.95
 France119.87
Lowest and highest reading in Western Europe.
- Southern Asia
97.92
the middle country, of 7 measured · 9 members
 Bangladesh66.74
 Iran138.18
Lowest and highest reading in Southern Asia.
- Southern Europe
107.43
the middle country, of 11 measured · 17 members
Malta27.55 Greece208.50
Lowest and highest reading in Southern Europe.
- Middle Africa
108.02
the middle country, of 8 measured · 9 members
 DR Congo66.58
 Chad140.86
Lowest and highest reading in Middle Africa.
- South-eastern Asia
109.29
the middle country, of 9 measured · 11 members
Timor-Leste47.92 Singapore206.80
Lowest and highest reading in South-eastern Asia.
- Northern Europe
121.77
the middle country, of 9 measured · 13 members
 Ireland43.51
 Lithuania177.46
Lowest and highest reading in Northern Europe.
- Eastern Europe
128.92
the middle country, of 10 measured · 10 members
 Czechia93.05Ukraine351.09
Lowest and highest reading in Eastern Europe.
- Northern Africa
130.08
the middle country, of 5 measured · 6 members
 Sudan89.73Algeria206.01
Lowest and highest reading in Northern Africa.
- Western Asia
208.53
the middle country, of 14 measured · 19 members
 Georgia135.60Israel262.28
Lowest and highest reading in Western Asia.
- Australia and New Zealand
2 of 2 measured — too few for a middle: Australia, New Zealand.
 New Zealand70.28Australia115.92
Lowest and highest reading in Australia and New Zealand.
- Caribbean
4 of 24 measured — too few for a middle: Dominican Republic, Haiti, Jamaica, Trinidad and Tobago.
Haiti3.51 Jamaica66.27
Lowest and highest reading in Caribbean.
- Central Asia
3 of 5 measured — too few for a middle: Kazakhstan, Kyrgyzstan, Tajikistan.
 Tajikistan67.62
 Kyrgyzstan149.50
Lowest and highest reading in Central Asia.
- Eastern Asia
4 of 8 measured — too few for a middle: China, Japan, Mongolia, South Korea.
 Japan73.61
 South Korea189.87
Lowest and highest reading in Eastern Asia.
- Melanesia
2 of 5 measured — too few for a middle: Fiji, Papua New Guinea.
Papua New Guinea34.09 Fiji73.30
Lowest and highest reading in Melanesia.
- Northern America
2 of 4 measured — too few for a middle: Canada, United States.
 Canada86.76United States153.29
Lowest and highest reading in Northern America.
03The whole field at once
The spread
149 countries, one dot each, on one scale — further right is a higher value. Half the countries are above 100.66; a quarter are above 138.18, and a quarter below 71.51. The bar in each row marks that continent’s middle country.
04All 162 ever measured
Every country
In order, highest value first — rank 1 is the highest value, the way BICC’s own tables read. “=” marks a rank shared with another country. Score and rank are both BICC’s own, so nothing here is derived. Read a high score as “more militarised” rather than automatically as “worse governed”: BICC presents the index neutrally, and the good-and-bad direction on this site is our framing, not theirs.
Showing 25 of 162 countries






















































































































_banner.jpg)


Values for 2023. The change column compares 2023 with 2022 only; the sparkline covers the recent editions.
051990–2023 · 34 editions
Over time
Each point is one year. Coverage grows across the series because the Soviet successor states have no figures before 1992 and several Gulf states have gaps — stored as absences, never as zeroes.
- the middle country
- the middle half of countries
- the middle of the 103 countries measured every time
- each continent’s middle country
The same, year by year
| Year | Countries | Middle country | Middle half | Measured every time |
|---|---|---|---|---|
| 2023 | 149 | 100.66 | 71.51 – 138.18 | 97.92 |
| 2022 | 149 | 100.86 | 71.44 – 136.88 | 99.71 |
| 2021 | 151 | 102.85 | 70.97 – 140.15 | 98.56 |
| 2020 | 150 | 104.42 | 73.36 – 140.43 | 100.43 |
| 2019 | 150 | 101.64 | 73.10 – 137.16 | 96.12 |
| 2018 | 150 | 98.09 | 72.77 – 137.82 | 94.66 |
| 2017 | 152 | 101.29 | 71.48 – 142.99 | 96.86 |
| 2016 | 153 | 102.04 | 71.75 – 142.71 | 93.71 |
| 2015 | 153 | 105.75 | 72.44 – 146.58 | 95.69 |
| 2014 | 152 | 103.04 | 73.71 – 146.90 | 95.82 |
| 2013 | 153 | 108.50 | 75.48 – 144.08 | 95.55 |
| 2012 | 154 | 109.54 | 76.53 – 148.74 | 99.85 |
| 2011 | 153 | 111.98 | 76.33 – 155.61 | 107.31 |
| 2010 | 153 | 114.82 | 73.85 – 156.87 | 104.65 |
| 2009 | 153 | 116.96 | 75.63 – 160.99 | 106.65 |
| 2008 | 153 | 114.36 | 75.46 – 159.58 | 108.41 |
| 2007 | 154 | 117.08 | 77.37 – 156.03 | 109.52 |
| 2006 | 154 | 116.51 | 76.33 – 159.00 | 112.45 |
| 2005 | 152 | 113.94 | 77.18 – 158.29 | 111.13 |
| 2004 | 151 | 113.64 | 80.72 – 161.58 | 112.11 |
| 2003 | 147 | 117.89 | 77.96 – 160.20 | 115.34 |
| 2002 | 147 | 120.14 | 79.54 – 162.54 | 116.76 |
| 2001 | 144 | 121.99 | 77.41 – 164.27 | 118.27 |
| 2000 | 143 | 120.02 | 76.29 – 166.82 | 119.35 |
| 1999 | 142 | 124.89 | 75.25 – 176.16 | 124.37 |
| 1998 | 144 | 122.16 | 74.59 – 176.21 | 117.30 |
| 1997 | 147 | 122.07 | 75.50 – 178.37 | 121.77 |
| 1996 | 147 | 124.52 | 75.84 – 174.24 | 128.76 |
| 1995 | 146 | 126.46 | 76.03 – 179.30 | 126.20 |
| 1994 | 147 | 136.36 | 85.08 – 186.10 | 136.36 |
| 1993 | 143 | 133.70 | 82.22 – 189.06 | 125.12 |
| 1992 | 133 | 136.12 | 85.60 – 183.76 | 133.67 |
| 1991 | 123 | 129.74 | 85.18 – 182.31 | 134.13 |
| 1990 | 121 | 135.39 | 90.42 – 184.71 | 135.77 |
062022 → 2023
Who rose and fell
The biggest changes in value between the two newest editions. Places are shown second, because they also move when other countries do.
Improved most
before → after Zimbabwe84.34 → 65.42 · 98th → 122nd−18.93
 Venezuela105.82 → 88.07 · 70th → 92nd−17.74
- Sudan107.22 → 89.73 · 69th → 90th−17.50
- Tajikistan83.75 → 67.62 · 100th → 117th−16.13
- Togo157.30 → 143.33 · 23rd → 31st−13.97
Worsened most
before → after Lebanon197.18 → 246.25 · 13th → 3rd+49.07
- Ukraine315.53 → 351.09 · 1st → 1st+35.56
- Algeria179.04 → 206.01 · 19th → 14th+26.98
 Finland149.36 → 174.48 · 28th → 22nd+25.12
- South Sudan155.57 → 179.32 · 24th → 20th+23.75
149 countries were measured in both 2022 and 2023.
07Across every edition
Global Militarisation Index in records
The extremes of the statistic. A record reached by more than one country names none of them.
Highest reading on record
500.00
GMI score (higher means a heavier military weight)
Lowest reading on record
0.00
GMI score (higher means a heavier military weight)
Biggest improvement between editions
−114.97
203.53 → 88.56
Biggest decline between editions
+144.31
171.22 → 315.53
Most improved since first measured
−202.36
412.79 → 210.43
At the top most often
20 of 34
editions, alone at the first-listed end
08The measure
About Global Militarisation Index
The Global Militarisation Index weighs a country’s military against its society: spending set against both GDP and health budgets, and troops set against both doctors and total population. Bonn International Centre for Conflict Studies has published it for every year since 1990.
What the number is: GMI score (higher means a heavier military weight).
What it does not measure
It weighs military resources, not how they are used: a heavily militarised country is not necessarily at war, and a lightly militarised one may still be in conflict.
09Where it fits
Connections
Its part in the Country Index, the statistics whose values line up most closely with it across countries, and others on the same subject.
In the Country Index
A key statistic for Peace & Security
“How much of a country's resources sit with its military rather than its hospitals and schools, comparing spending, personnel and heavy weapons against health provision. Correlates 0.02 with political stability: a heavily armed country and an unstable one are genuinely different things, which is why the topic needs both.”
- Edition used
- 2023 (data 2023)
- Countries
- 149
- Licence
- CC BY
Moves with
Where Global Militarisation Index is higher, these tend to be higher too.
- Completeness of Birth RegistrationUNICEF · 134 countries in commonρ 0.43
Moves against
Where Global Militarisation Index is higher, these tend to be lower.
- Prevalence of Severe Food InsecurityKeyFAO · 117 countries in commonρ −0.41
Rank correlation (ρ, from −1 to 1) across countries, on each statistic’s newest edition, out of 116 statistics sharing at least 80 countries with this one. Two statistics that move together do not cause each other.
11Questions
Global Militarisation Index: questions and answers
Which country has the lowest Global Militarisation Index?
Haiti, at 3.51, among the 149 countries compared in 2023.
Which country has the highest Global Militarisation Index?
Ukraine, at 351.09, among the 149 countries compared in 2023.
How many countries does the Global Militarisation Index cover?
149 in 2023, and 162 at least once across all editions. The number measured varies from 121 to 154 between editions.
What is the world average Global Militarisation Index?
This site does not calculate a world average, which would depend on how countries are weighted. In the middle country of the 149 compared in 2023, the figure was 100.66.
Is this Bonn International Centre for Conflict Studies (BICC)’s own ranking?
Yes. The rank shown is the one Bonn International Centre for Conflict Studies (BICC) publishes.
How often is the Global Militarisation Index published?
This site holds 34 editions, describing 1990 to 2023.
Where does the data come from, and can I download it?
From Bonn International Centre for Conflict Studies (BICC), under CC BY. From BICC’s published Global Militarisation Index tables. Every edition is available on this site’s Datasets pages as a full table, unrounded.
12Method
Sources, method and citation
Source
Global Militarisation Index — Bonn International Centre for Conflict Studies (BICC)
From BICC’s published Global Militarisation Index tables.
Newest edition
Report year 2023Data year 2023
Cite the source as: Bonn International Centre for Conflict Studies (BICC). Global Militarisation Index. Bonn: BICC.
Licence: CC BY, checked 2026-08-29.
How this page reads the numbers
- The rank is Bonn International Centre for Conflict Studies (BICC)’s own, as published.
- Which end is better follows the publisher’s own reading of the measure.
- A country is named at an end only when it holds that value alone. Where several share it, the page says how many and names none first.
- Values are stored exactly as published and trimmed only for display. “The middle country” is the median of the countries measured, not a world average.
The full note on this data
33 data years (1990–2022) covering 121 to 162 countries — coverage grows because the Soviet successor states have no figures before 1992 and several Gulf states have gaps, which are stored as absences rather than zeroes. The index measures the weight of a country's military relative to its society: military spending against both GDP and health spending, and military and paramilitary personnel against both physicians and total population. Score and rank are BOTH published by BICC, so neither is derived here. ⚠ THE DIRECTION IS OUR FRAMING, NOT BICC'S. BICC presents the index neutrally, as a measure of relative weight rather than a verdict; this site's schema has no neutral option, so it is recorded as higher-is-worse on the reasoning that what the index counts is resources held by the military rather than by health and education. Read the scores as "more militarised", not automatically as "worse governed".
Photographs
The countries at the top of this statistic, from their profiles: Wikimedia Commons, shown in greyscale, each used under the licence named.
- Haiti — Santiagockn, CC0
- Malta — Dirk Heldmaier derivative work: Jjtkk, CC BY-SA 3.0
- Mauritius — Damiano Luchetti, CC0
Cite this page
Nations Inquiry (2026). Global Militarisation Index by country: Global Militarisation Index, data from Bonn International Centre for Conflict Studies (BICC). https://nationsinquiry.com/statistics/militarisation