Loading…
V-Dem Institute, University of Gothenburg · Political Violence by Non-State Actors
Political violence by non-state actors by country
How often do groups outside the state use violence for political ends?
Of the 171 countries compared in 2025, Luxembourg had the lowest reading, -3.182, and Myanmar had the highest reading, 3.375. In the middle country the figure was -0.661. Among the 163 countries measured in every edition since 1990, the middle one moved from -0.495 to -0.663.
Part ofPeace & Security
Political violence by non-state actors · 2025
Key statistic · Peace & Security

Lowest of 171Luxembourg
-3.182012025 · position · derived
Who leads
The three countries at the lowest end of 171 compared, the three at the other end, and the first on each continent.
 1
1Photo: Michal Osmenda from Brussels, Belgium · CC BY-SA 2.0, greyscale
 2
2Photo: Unknown author · CC BY-SA 3.0, greyscale
 3
3
Highest in 2025
 Myanmar3.375
 Yemen3.086
 Central African Republic2.976
Where a country sits says how it compares with the others measured, and nothing about why.
Lowest on each continent
- Africa
 Seychelles-2.987
 - Americas
 Uruguay-3.126
 - Asia
 United Arab Emirates-3.134
 - EuropeLuxembourg-3.182
- Oceania
 New Zealand-2.026
 - Every region
02Every measured country
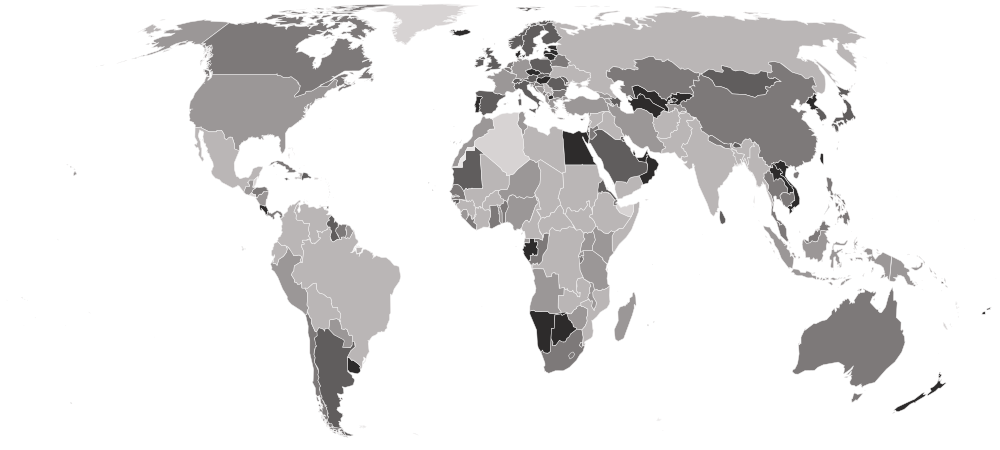
Political violence by non-state actors on a map
Each country is shaded by its value, in five groups holding the same number of countries. Hover a country for its value, or select it to open its profile. Below the map, each continent’s middle country.
Darker is a lower value — the better end.
- 1.050–3.375
- -0.328–0.952
- -1.004–-0.369
- -1.814–-1.044
- -3.182–-1.815
- No reading in 2025 (5 measured in an earlier edition)
- Oceania
-1.320
the middle country, of 5 measured · 21 members
New Zealand-2.026 Papua New Guinea-0.328
Lowest and highest reading in Oceania.
- Europe
-1.144
the middle country, of 40 measured · 49 members
Luxembourg-3.182 Serbia1.332
Lowest and highest reading in Europe.
- Asia
-0.675
the middle country, of 48 measured · 52 members
United Arab Emirates-3.134Myanmar3.375Lowest and highest reading in Asia.
- Americas
-0.381
the middle country, of 25 measured · 48 members
Uruguay-3.126 Venezuela2.652
Lowest and highest reading in Americas.
- Africa
0.084
the middle country, of 53 measured · 55 members
Seychelles-2.987Central African Republic2.976Lowest and highest reading in Africa.
- Every region
20 sub-regions, lowest middle country first
- Northern Europe
-2.114
the middle country, of 10 measured · 13 members
 Iceland-3.108
 Ireland-1.085
Lowest and highest reading in Northern Europe.
- Central Asia
-1.890
the middle country, of 5 measured · 5 members
 Turkmenistan-2.671
 Tajikistan-0.060
Lowest and highest reading in Central Asia.
- Eastern Asia
-1.507
the middle country, of 7 measured · 8 members
 North Korea-2.780
 China-0.506
Lowest and highest reading in Eastern Asia.
- Caribbean
-1.457
the middle country, of 5 measured · 24 members
 Trinidad and Tobago-1.799
 Haiti2.317
Lowest and highest reading in Caribbean.
- Eastern Europe
-1.122
the middle country, of 10 measured · 10 members
 Czechia-2.761
 Ukraine1.069
Lowest and highest reading in Eastern Europe.
- Southern Europe
-0.907
the middle country, of 13 measured · 17 members
 Portugal-2.670Serbia1.332
Lowest and highest reading in Southern Europe.
- Southern Africa
-0.891
the middle country, of 5 measured · 5 members
 Namibia-2.750
 Eswatini-0.588
Lowest and highest reading in Southern Africa.
- Western Europe
-0.727
the middle country, of 7 measured · 9 members
Luxembourg-3.182 France0.343
Lowest and highest reading in Western Europe.
- Western Asia
-0.658
the middle country, of 17 measured · 19 members
United Arab Emirates-3.134Yemen3.086Lowest and highest reading in Western Asia.
- South-eastern Asia
-0.454
the middle country, of 10 measured · 11 members
 Singapore-2.219Myanmar3.375
Lowest and highest reading in South-eastern Asia.
- South America
-0.204
the middle country, of 12 measured · 12 members
Uruguay-3.126Venezuela2.652Lowest and highest reading in South America.
- Western Africa
-0.184
the middle country, of 16 measured · 16 members
 Cabo Verde-2.606
 Mali1.588
Lowest and highest reading in Western Africa.
- Central America
-0.027
the middle country, of 6 measured · 8 members
 Costa Rica-2.391
 Mexico2.030
Lowest and highest reading in Central America.
- Middle Africa
0.011
the middle country, of 9 measured · 9 members
 Gabon-2.010Central African Republic2.976
Lowest and highest reading in Middle Africa.
- Southern Asia
0.078
the middle country, of 9 measured · 9 members
 Sri Lanka-1.511
 Bangladesh2.310
Lowest and highest reading in Southern Asia.
- Eastern Africa
0.342
the middle country, of 18 measured · 19 members
Seychelles-2.987 Somalia2.715
Lowest and highest reading in Eastern Africa.
- Northern Africa
0.503
the middle country, of 5 measured · 6 members
 Egypt-2.309
 Libya2.296
Lowest and highest reading in Northern Africa.
- Australia and New Zealand
2 of 2 measured — too few for a middle: Australia, New Zealand.
New Zealand-2.026 Australia-0.946
Lowest and highest reading in Australia and New Zealand.
- Melanesia
3 of 5 measured — too few for a middle: Fiji, Papua New Guinea, Solomon Islands.
 Fiji-1.815Papua New Guinea-0.328
Lowest and highest reading in Melanesia.
- Northern America
2 of 4 measured — too few for a middle: Canada, United States.
 Canada-0.939
 United States0.752
Lowest and highest reading in Northern America.
03The whole field at once
The spread
171 countries, one dot each, on one scale — further right is a higher value. Half the countries are above -0.661; a quarter are above 0.482, and a quarter below -1.515. The bar in each row marks that continent’s middle country.
04All 176 ever measured
Every country
In order, highest value first — position 1 is the highest value, the way V-Dem Institute, University of Gothenburg’s own tables read. “=” marks a position shared with another country. V-Dem Institute, University of Gothenburg ranks nobody on this measure; the position is derived here by ordering the published values. ⚠ Higher is worse, so the derived position puts the most affected country first. It counts violence by actors outside the state; violence by the state itself is measured by the Physical Violence Index on this site, and crime committed for profit is excluded.
Showing 25 of 176 countries


































































































































Values for 2025. The change column compares 2025 with 2024 only; the sparkline covers the recent editions.
051990–2025 · 36 reference years
Over time
Each point is one year from 1990, all of them re-estimated together in V-Dem's v16 release. Rises tend to accompany insurgencies, contested elections and civil wars; the scale has no fixed ends, so read the movement rather than the number on its own.
- the middle country
- the middle half of countries
- the middle of the 163 countries measured every time
- each continent’s middle country
The same, year by year
| Year | Countries | Middle country | Middle half | Measured every time |
|---|---|---|---|---|
| 2025 | 171 | -0.661 | -1.515 – 0.482 | -0.663 |
| 2024 | 175 | -0.626 | -1.547 – 0.432 | -0.641 |
| 2023 | 176 | -0.617 | -1.543 – 0.356 | -0.650 |
| 2022 | 176 | -0.522 | -1.514 – 0.405 | -0.517 |
| 2021 | 176 | -0.530 | -1.561 – 0.423 | -0.539 |
| 2020 | 176 | -0.620 | -1.571 – 0.566 | -0.628 |
| 2019 | 176 | -0.620 | -1.682 – 0.704 | -0.628 |
| 2018 | 176 | -0.787 | -1.808 – 0.591 | -0.799 |
| 2017 | 176 | -0.651 | -1.623 – 0.591 | -0.730 |
| 2016 | 176 | -0.633 | -1.577 – 0.624 | -0.776 |
| 2015 | 176 | -0.757 | -1.577 – 0.591 | -0.776 |
| 2014 | 176 | -0.748 | -1.612 – 0.624 | -0.799 |
| 2013 | 176 | -0.755 | -1.684 – 0.500 | -0.799 |
| 2012 | 176 | -0.755 | -1.710 – 0.544 | -0.783 |
| 2011 | 176 | -0.737 | -1.737 – 0.523 | -0.742 |
| 2010 | 175 | -0.767 | -1.714 – 0.409 | -0.777 |
| 2009 | 175 | -0.767 | -1.730 – 0.259 | -0.798 |
| 2008 | 175 | -0.798 | -1.724 – 0.316 | -0.809 |
| 2007 | 175 | -0.801 | -1.743 – 0.285 | -0.809 |
| 2006 | 175 | -0.847 | -1.724 – 0.302 | -0.869 |
| 2005 | 175 | -0.743 | -1.724 – 0.388 | -0.749 |
| 2004 | 175 | -0.847 | -1.750 – 0.408 | -0.887 |
| 2003 | 175 | -0.818 | -1.713 – 0.471 | -0.826 |
| 2002 | 175 | -0.770 | -1.713 – 0.554 | -0.809 |
| 2001 | 175 | -0.760 | -1.713 – 0.559 | -0.791 |
| 2000 | 175 | -0.766 | -1.701 – 0.496 | -0.791 |
| 1999 | 175 | -0.732 | -1.523 – 0.637 | -0.757 |
| 1998 | 174 | -0.791 | -1.689 – 0.589 | -0.943 |
| 1997 | 173 | -0.757 | -1.691 – 0.593 | -0.770 |
| 1996 | 173 | -0.627 | -1.691 – 0.710 | -0.663 |
| 1995 | 173 | -0.627 | -1.663 – 0.761 | -0.645 |
| 1994 | 173 | -0.534 | -1.663 – 0.797 | -0.620 |
| 1993 | 173 | -0.534 | -1.513 – 0.842 | -0.620 |
| 1992 | 172 | -0.456 | -1.473 – 0.844 | -0.534 |
| 1991 | 170 | -0.577 | -1.451 – 0.938 | -0.620 |
| 1990 | 167 | -0.495 | -1.394 – 0.779 | -0.495 |
062024 → 2025
Who rose and fell
The biggest changes in value between the two newest editions — reference years recalculated in one report, not two separate publications. Places are shown second, because they also move when other countries do.
Improved most
before → afterWorsened most
before → after Côte d’Ivoire-0.799 → 1.368 · 101st → 25th+2.167
 Benin-2.524 → -0.928 · 159th → 100th+1.596
 Bolivia0.662 → 2.065 · 41st → 13th+1.403
 Croatia-2.232 → -0.907 · 150th → 98th+1.325
 Switzerland-2.754 → -1.438 · 166th → 123rd+1.316
171 countries were measured in both 2024 and 2025. The field changed from 175 to 171 countries, so a place can move for reasons that have nothing to do with the country itself.
07Across every edition
Political violence by non-state actors in records
The extremes of the statistic. A record reached by more than one country names none of them.
Highest reading on record
4.186
Original latent estimate (≈ −3.5 to +4); higher = more violence
Lowest reading on record
-3.427
Original latent estimate (≈ −3.5 to +4); higher = more violence
Biggest improvement between editions
−3.328
2.265 → -1.063
Biggest decline between editions
+3.570
-0.371 → 3.199
Most improved since first measured
−5.132
3.453 → -1.679
At the top most often
19 of 36
editions, alone at the first-listed end
08The measure
About political violence by non-state actors
V-Dem's measure of political violence asks how often people and groups outside the state — insurgents, militias, party youth wings and the like — used physical force against people to pursue political aims. It is an expert-coded estimate on an open-ended scale centred near zero, and a higher figure means more violence.
What the number is: Original latent estimate (≈ −3.5 to +4); higher = more violence.
What it does not measure
Violence by the state's own agents is a separate measure, and crime committed for profit is excluded.
09Where it fits
Connections
Its part in the Country Index, the statistics whose values line up most closely with it across countries, and others on the same subject.
In the Country Index
A key statistic for Peace & Security
“Violence used for political ends by groups outside the state — militias, armed party wings and insurgents — the other side of the state violence that Physical Violence measures.”
- Edition used
- 2025 (data 2025)
- Countries
- 171
- Licence
- CC BY-SA 4.0
Moves with
Where political violence by non-state actors is higher, these tend to be higher too.
- INFORM Risk IndexKeyEuropean Commission Joint Research Centre, with the Inter-Agency Standing Committee · 168 countries in commonρ 0.70
- Refugees by Country of OriginUNHCR, the UN Refugee Agency · 169 countries in commonρ 0.61
- Deaths in Organized ViolenceUCDP · 170 countries in commonρ 0.58
Moves against
Where political violence by non-state actors is higher, these tend to be lower.
- Political Stability and Absence of ViolenceKeyWorld Bank Group · 171 countries in commonρ −0.79
- State Authority over TerritoryV-Dem Institute, University of Gothenburg · 170 countries in commonρ −0.62
- Rule of LawKeyWorld Bank Group · 171 countries in commonρ −0.62
Rank correlation (ρ, from −1 to 1) across countries, on each statistic’s newest edition, out of 186 statistics sharing at least 80 countries with this one. Two statistics that move together do not cause each other.
10Keep reading
Explore further
The subject
The countries at either end
More from V-Dem Institute, University of Gothenburg
11Questions
Political violence by non-state actors: questions and answers
Which country has the lowest political violence by non-state actors?
Luxembourg, at -3.182, among the 171 countries compared in 2025.
Which country has the highest political violence by non-state actors?
Myanmar, at 3.375, among the 171 countries compared in 2025.
How many countries does the Political Violence by Non-State Actors cover?
171 in 2025, and 176 at least once across all editions. The number measured varies from 167 to 176 between editions.
What is the world average political violence by non-state actors?
This site does not calculate a world average, which would depend on how countries are weighted. In the middle country of the 171 compared in 2025, the figure was -0.661.
Is this V-Dem Institute, University of Gothenburg’s own ranking?
No. V-Dem Institute, University of Gothenburg publishes the values but ranks nobody; the position on this page is derived by Nations Inquiry by ordering the published values, and equal values share a position.
How often is the Political Violence by Non-State Actors published?
This site holds 36 reference years, 1990–2025, all recalculated in V-Dem Institute, University of Gothenburg’s 2026 report on one method — not 36 separate publications.
Where does the data come from, and can I download it?
From V-Dem Institute, University of Gothenburg, under CC BY-SA 4.0. From the V-Dem Institute's Country-Year Full+Others dataset (v16), University of Gothenburg — this indicator is not in the smaller Core file — published under CC BY-SA 4.0. The series here starts in 1990 so that every row belongs to a present-day country. Stored as the measurement model's original estimate, not V-Dem's 0–4 rescaling. Every edition is on this site’s Datasets pages as a full table, and downloads as a CSV file with every value unrounded.
12Method
Sources, method and citation
Source
Political Violence by Non-State Actors — V-Dem Institute, University of Gothenburg
From the V-Dem Institute's Country-Year Full+Others dataset (v16), University of Gothenburg — this indicator is not in the smaller Core file — published under CC BY-SA 4.0. The series here starts in 1990 so that every row belongs to a present-day country. Stored as the measurement model's original estimate, not V-Dem's 0–4 rescaling.
Newest edition
Report year 2025Data year 2025
Cite the source as: Coppedge, M. et al. V-Dem Country-Year Dataset v16. Varieties of Democracy (V-Dem) Project, University of Gothenburg.
Licence: CC BY-SA 4.0, checked 2026-09-26.
How this page reads the numbers
- V-Dem Institute, University of Gothenburg ranks nobody on this measure. The position is derived by Nations Inquiry by ordering the published values; equal values share a position.
- Which end is better follows the publisher’s own reading of the measure.
- A country is named at an end only when it holds that value alone. Where several share it, the page says how many and names none first.
- Values are stored exactly as published and trimmed only for display. “The middle country” is the median of the countries measured, not a world average.
The file itself, column by column — where it came from, what each column holds, and every edition as a CSV — is on its dataset page.
Photographs
The countries at the top of this statistic, from their profiles: Wikimedia Commons, shown in greyscale, each used under the licence named.
- Luxembourg — Michal Osmenda from Brussels, Belgium, CC BY-SA 2.0
- United Arab Emirates — Unknown author, CC BY-SA 3.0
- Uruguay — Elemaki, CC BY 3.0
Cite this page
Nations Inquiry (2026). Political violence by non-state actors by country: Political Violence by Non-State Actors, data from V-Dem Institute, University of Gothenburg. https://nationsinquiry.com/statistics/political-violence