Loading…
V-Dem Institute, University of Gothenburg · State Authority over Territory
State control of territory by country
How much of its territory does the state actually control?
Of the 174 countries compared in 2025, 19 countries shared the highest reading, 100.00%, and Yemen had the lowest reading, 47.56%. In the middle country the figure was 95.30%. Among the 150 countries measured in every edition since 1990, the middle one moved from 94.75% to 95.00%.
State control of territory · 2025
Context statistic
19 countries share the highest value, 100.00% — no single country is named first.
012025 · values only
Who leads
The three countries at the highest end of 174 compared, the three at the other end, and the first on each continent.
Highest in 2025 · shared
19 countries share the highest reading, 100.00%
No single country is named first: picking one from a shared value would be a choice the data does not make.













Highest on each continent
- Africa
 São Tomé and Príncipe100.00%
 - Americas
4 countries share 100.00%
- Asia
3 countries share 100.00%
- Europe
11 countries share 100.00%
- Oceania
 New Zealand99.83%
 - Every region
02Every measured country
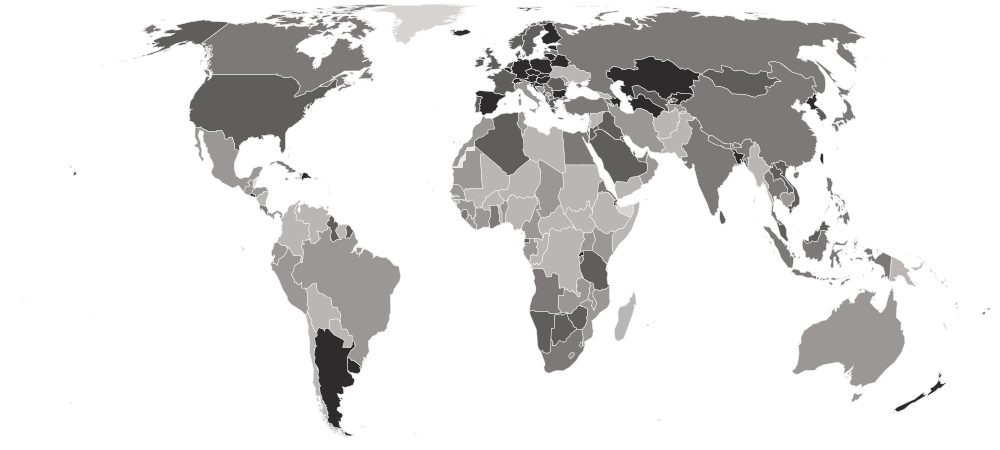
State control of territory on a map
Each country is shaded by its value, in five groups holding the same number of countries. Hover a country for its value, or select it to open its profile. Below the map, each continent’s middle country.
Darker is a higher value — the better end.
- 47.56–85.00%
- 85.28–94.43%
- 94.44–97.20%
- 97.25–99.50%
- 99.57–100.00%
- No reading in 2025
- Europe
99.17%
the middle country, of 40 measured · 49 members
11 share 100.00%
 Ukraine69.00%
Highest and lowest reading in Europe.
- Asia
96.00%
the middle country, of 47 measured · 52 members
3 share 100.00%
 Yemen47.56%
Highest and lowest reading in Asia.
- Oceania
93.69%
the middle country, of 6 measured · 21 members
New Zealand99.83% Papua New Guinea71.00%
Highest and lowest reading in Oceania.
- Africa
90.38%
the middle country, of 54 measured · 55 members
São Tomé and Príncipe100.00% Sudan49.75%
Highest and lowest reading in Africa.
- Americas
90.25%
the middle country, of 27 measured · 48 members
4 share 100.00%
 Suriname65.00%
Highest and lowest reading in Americas.
- Every region
20 sub-regions, highest middle country first
- Eastern Europe
99.92%
the middle country, of 10 measured · 10 members
4 share 100.00%
Ukraine69.00%Highest and lowest reading in Eastern Europe.
- Western Europe
99.86%
the middle country, of 7 measured · 9 members
2 share 100.00%
 France98.33%
Highest and lowest reading in Western Europe.
- Central Asia
99.75%
the middle country, of 5 measured · 5 members
 Kazakhstan100.00%
 Tajikistan94.00%
Highest and lowest reading in Central Asia.
- Northern Europe
99.17%
the middle country, of 10 measured · 13 members
3 share 100.00%
 Latvia96.67%
Highest and lowest reading in Northern Europe.
- Eastern Asia
98.94%
the middle country, of 6 measured · 8 members
 Taiwan100.00%
 Japan96.25%
Highest and lowest reading in Eastern Asia.
- Southern Europe
97.50%
the middle country, of 13 measured · 17 members
2 share 100.00%
 Bosnia and Herzegovina85.28%
Highest and lowest reading in Southern Europe.
- Caribbean
95.93%
the middle country, of 6 measured · 24 members
2 share 100.00%
 Haiti70.25%
Highest and lowest reading in Caribbean.
- Western Asia
95.80%
the middle country, of 17 measured · 19 members
 Azerbaijan100.00%Yemen47.56%
Highest and lowest reading in Western Asia.
- South-eastern Asia
95.43%
the middle country, of 10 measured · 11 members
 Malaysia98.75%
 Myanmar49.00%
Highest and lowest reading in South-eastern Asia.
- Southern Asia
95.40%
the middle country, of 9 measured · 9 members
 Bangladesh99.80%
 Pakistan78.93%
Highest and lowest reading in Southern Asia.
- Southern Africa
95.00%
the middle country, of 5 measured · 5 members
 Botswana98.33%
 Lesotho94.43%
Highest and lowest reading in Southern Africa.
- Northern Africa
92.46%
the middle country, of 6 measured · 6 members
 Algeria99.50%Sudan49.75%
Highest and lowest reading in Northern Africa.
- Eastern Africa
91.79%
the middle country, of 18 measured · 19 members
 Rwanda99.86%
 South Sudan65.00%
Highest and lowest reading in Eastern Africa.
- Western Africa
89.38%
the middle country, of 16 measured · 16 members
 Cabo Verde99.00%
 Mali77.80%
Highest and lowest reading in Western Africa.
- Central America
88.33%
the middle country, of 7 measured · 8 members
 El Salvador100.00%
 Nicaragua82.63%
Highest and lowest reading in Central America.
- Middle Africa
86.00%
the middle country, of 9 measured · 9 members
São Tomé and Príncipe100.00% DR Congo73.57%
Highest and lowest reading in Middle Africa.
- South America
85.80%
the middle country, of 12 measured · 12 members
 Argentina100.00%Suriname65.00%
Highest and lowest reading in South America.
- Australia and New Zealand
2 of 2 measured — too few for a middle: Australia, New Zealand.
New Zealand99.83% Australia92.38%
Highest and lowest reading in Australia and New Zealand.
- Melanesia
4 of 5 measured — too few for a middle: Fiji, Papua New Guinea, Solomon Islands, Vanuatu.
 Vanuatu99.14%Papua New Guinea71.00%
Highest and lowest reading in Melanesia.
- Northern America
2 of 4 measured — too few for a middle: Canada, United States.
 United States97.46%
 Canada97.00%
Highest and lowest reading in Northern America.
03The whole field at once
The spread
174 countries, one dot each, on one scale — further right is a higher value. Half the countries are above 95.30%; a quarter are above 98.98%, and a quarter below 86.91%. The bar in each row marks that continent’s middle country.
04All 174 ever measured
Every country
In order, highest value first. No rank or position is shown: too many countries share the same value for an order to mean anything. ⚠ V-Dem judges "official territory" by international law, so a country part of whose recognised territory is held by another state or a breakaway authority reads below 100 whatever the merits of the dispute; this site reports V-Dem's convention and takes no side. The figures are experts' estimates, not surveyed maps, and many countries share round readings, which is why no position is derived.
Showing 25 of 174 countries
























































































































Values for 2025. The change column compares 2025 with 2024 only; the sparkline covers the recent editions.
051990–2025 · 36 reference years
Over time
Each point is one year from 1990, all of them re-estimated together in V-Dem's v16 release. Sharp falls tend to accompany civil wars, insurgencies or the loss of ground to armed groups.
- the middle country
- the middle half of countries
- the middle of the 150 countries measured every time
- each continent’s middle country
The same, year by year
| Year | Countries | Middle country | Middle half | Measured every time |
|---|---|---|---|---|
| 2025 | 174 | 95.30% | 86.91% – 98.98% | 95.00% |
| 2024 | 174 | 94.71% | 87.53% – 98.75% | 94.50% |
| 2023 | 174 | 95.00% | 87.53% – 98.69% | 95.00% |
| 2022 | 174 | 95.05% | 87.74% – 98.55% | 95.00% |
| 2021 | 174 | 94.76% | 88.44% – 98.61% | 94.63% |
| 2020 | 174 | 94.90% | 87.69% – 98.46% | 94.90% |
| 2019 | 174 | 95.10% | 88.23% – 98.39% | 95.00% |
| 2018 | 174 | 95.33% | 88.91% – 98.55% | 95.10% |
| 2017 | 174 | 95.33% | 88.71% – 98.44% | 95.18% |
| 2016 | 174 | 95.44% | 87.68% – 98.45% | 95.18% |
| 2015 | 174 | 95.53% | 87.62% – 98.61% | 95.18% |
| 2014 | 174 | 95.62% | 88.44% – 98.62% | 95.18% |
| 2013 | 174 | 95.76% | 89.03% – 98.61% | 95.18% |
| 2012 | 174 | 95.69% | 89.69% – 98.71% | 95.05% |
| 2011 | 174 | 95.80% | 90.03% – 98.69% | 95.15% |
| 2010 | 173 | 95.73% | 90.12% – 98.73% | 95.31% |
| 2009 | 173 | 95.50% | 89.81% – 98.67% | 95.00% |
| 2008 | 173 | 95.50% | 89.60% – 98.60% | 95.00% |
| 2007 | 172 | 95.50% | 89.55% – 98.68% | 95.00% |
| 2006 | 172 | 95.50% | 89.61% – 98.62% | 95.00% |
| 2005 | 171 | 95.46% | 89.21% – 98.59% | 95.00% |
| 2004 | 171 | 95.46% | 87.43% – 98.59% | 95.00% |
| 2003 | 171 | 95.46% | 87.54% – 98.63% | 95.00% |
| 2002 | 171 | 95.46% | 87.28% – 98.63% | 94.96% |
| 2001 | 170 | 95.38% | 87.40% – 98.65% | 94.88% |
| 2000 | 170 | 95.10% | 87.52% – 98.59% | 94.79% |
| 1999 | 170 | 95.20% | 87.05% – 98.68% | 94.79% |
| 1998 | 170 | 95.20% | 87.05% – 98.68% | 94.73% |
| 1997 | 170 | 95.27% | 86.89% – 98.68% | 94.88% |
| 1996 | 170 | 95.20% | 87.05% – 98.68% | 94.88% |
| 1995 | 170 | 94.96% | 86.89% – 98.68% | 94.88% |
| 1994 | 170 | 94.88% | 86.03% – 98.68% | 94.82% |
| 1993 | 170 | 95.00% | 85.15% – 98.68% | 94.88% |
| 1992 | 168 | 94.92% | 85.44% – 98.56% | 94.73% |
| 1991 | 165 | 94.63% | 86.00% – 98.44% | 94.60% |
| 1990 | 150 | 94.75% | 85.85% – 98.38% | 94.75% |
062024 → 2025
Who rose and fell
The biggest changes in value between the two newest editions — reference years recalculated in one report, not two separate publications. Places are shown second, because they also move when other countries do.
Improved most
before → after Libya43.50% → 65.60%+22.10
 Somalia61.20% → 74.67%+13.47
 Djibouti84.83% → 98.00%+13.17
- Haiti59.50% → 70.25%+10.75
 Saudi Arabia88.33% → 98.80%+10.47
Declined most
before → after Chile93.76% → 80.67%−13.09
- Papua New Guinea80.75% → 71.00%−9.75
- Pakistan86.00% → 78.93%−7.07
- Yemen54.22% → 47.56%−6.66
 Nigeria84.30% → 78.25%−6.05
174 countries were measured in both 2024 and 2025.
07Across every edition
State control of territory in records
The extremes of the statistic. A record reached by more than one country names none of them.
Highest reading on record
Reached 455 times by 34 countries — shared, so no holder is named
100.00%
Territory under effective state control (% of official territory)
Lowest reading on record
33.80%
Territory under effective state control (% of official territory)
Biggest improvement between editions
+40.16
43.09% → 83.25%
Biggest decline between editions
−33.00
85.80% → 52.80%
Most improved since first measured
+57.95
33.80% → 91.75%
08The measure
About state control of territory
V-Dem's measure of state authority asks what share of a country's official territory the state effectively controls — where it is the recognised authority and can prevail over insurgents, armed groups or criminal organisations that reject it. It is an expert estimate, given as a percentage.
What the number is: Territory under effective state control (% of official territory).
What it does not measure
It is an expert estimate rather than a surveyed map, and it judges territory by international law rather than by who governs it.
09Where it fits
Connections
Its part in the Country Index, the statistics whose values line up most closely with it across countries, and others on the same subject.
In the Country Index
Context, with no vote
This statistic is published in full under Governance & Institutions and Peace & Security, but does not help decide any Country Index standing.
Governance & InstitutionsPeace & SecurityWhich statistics vote, and why
Moves with
Where state control of territory is higher, these tend to be higher too.
- Political Stability and Absence of ViolenceKeyWorld Bank Group · 174 countries in commonρ 0.63
- Completeness of Birth RegistrationUNICEF · 151 countries in commonρ 0.60
- Inequality-adjusted Human Development IndexUNDP Human Development Report Office · 156 countries in commonρ 0.59
Moves against
Where state control of territory is higher, these tend to be lower.
- INFORM Risk IndexKeyEuropean Commission Joint Research Centre, with the Inter-Agency Standing Committee · 172 countries in commonρ −0.66
- Political Violence by Non-State ActorsKeyV-Dem Institute, University of Gothenburg · 170 countries in commonρ −0.62
- INFORM Severity IndexACAPS · 80 countries in commonρ −0.60
Rank correlation (ρ, from −1 to 1) across countries, on each statistic’s newest edition, out of 187 statistics sharing at least 80 countries with this one. Two statistics that move together do not cause each other.
10Keep reading
Explore further
The subject
More from V-Dem Institute, University of Gothenburg
11Questions
State control of territory: questions and answers
Which country has the highest state control of territory?
19 countries share the highest reading, 100.00%, among the 174 compared in 2025, so no single country is named.
Which country has the lowest state control of territory?
Yemen, at 47.56%, among the 174 countries compared in 2025.
How many countries does the State Authority over Territory cover?
174 in 2025. The number measured varies from 150 to 174 between editions.
What is the world average state control of territory?
This site does not calculate a world average, which would depend on how countries are weighted. In the middle country of the 174 compared in 2025, the figure was 95.30%.
Is this V-Dem Institute, University of Gothenburg’s own ranking?
No ranking is shown. V-Dem Institute, University of Gothenburg publishes values only, and too many countries share the same value for an ordering to mean anything, so none is derived.
How often is the State Authority over Territory published?
This site holds 36 reference years, 1990–2025, all recalculated in V-Dem Institute, University of Gothenburg’s 2026 report on one method — not 36 separate publications.
Where does the data come from, and can I download it?
From V-Dem Institute, University of Gothenburg, under CC BY-SA 4.0. From the V-Dem Institute's Country-Year Full+Others dataset (v16), University of Gothenburg — this indicator is not in the smaller Core file — published under CC BY-SA 4.0. The series here starts in 1990 so that every row belongs to a present-day country. Every edition is on this site’s Datasets pages as a full table, and downloads as a CSV file with every value unrounded.
12Method
Sources, method and citation
Source
State Authority over Territory — V-Dem Institute, University of Gothenburg
From the V-Dem Institute's Country-Year Full+Others dataset (v16), University of Gothenburg — this indicator is not in the smaller Core file — published under CC BY-SA 4.0. The series here starts in 1990 so that every row belongs to a present-day country.
Newest edition
Report year 2025Data year 2025
Cite the source as: Coppedge, M. et al. V-Dem Country-Year Dataset v16. Varieties of Democracy (V-Dem) Project, University of Gothenburg.
Licence: CC BY-SA 4.0, checked 2026-09-26.
How this page reads the numbers
- No rank or position is shown: V-Dem Institute, University of Gothenburg publishes values only, and too many countries share the same value for an ordering to mean anything.
- Which end is better follows the publisher’s own reading of the measure.
- A country is named at an end only when it holds that value alone. Where several share it, the page says how many and names none first.
- Values are stored exactly as published and trimmed only for display. “The middle country” is the median of the countries measured, not a world average.
The file itself, column by column — where it came from, what each column holds, and every edition as a CSV — is on its dataset page.
Cite this page
Nations Inquiry (2026). State control of territory by country: State Authority over Territory, data from V-Dem Institute, University of Gothenburg. https://nationsinquiry.com/statistics/state-authority-over-territory