Development & Human Capital2025
India vs Pakistan 2025: Comparison of Hunger Index, Happiness, HDI, Rule of Law, Literacy & GDP
India and Pakistan on six published measures: hunger, happiness, human development, rule of law, literacy and GDP per capita, each from its own publisher and year.
Published Article last edited
Share
These figures are from the edition named beside each measure, as they stood when this chart was published on . The chart is a snapshot and is never refreshed, so a newer edition may exist. What this site keeps current on the subject.
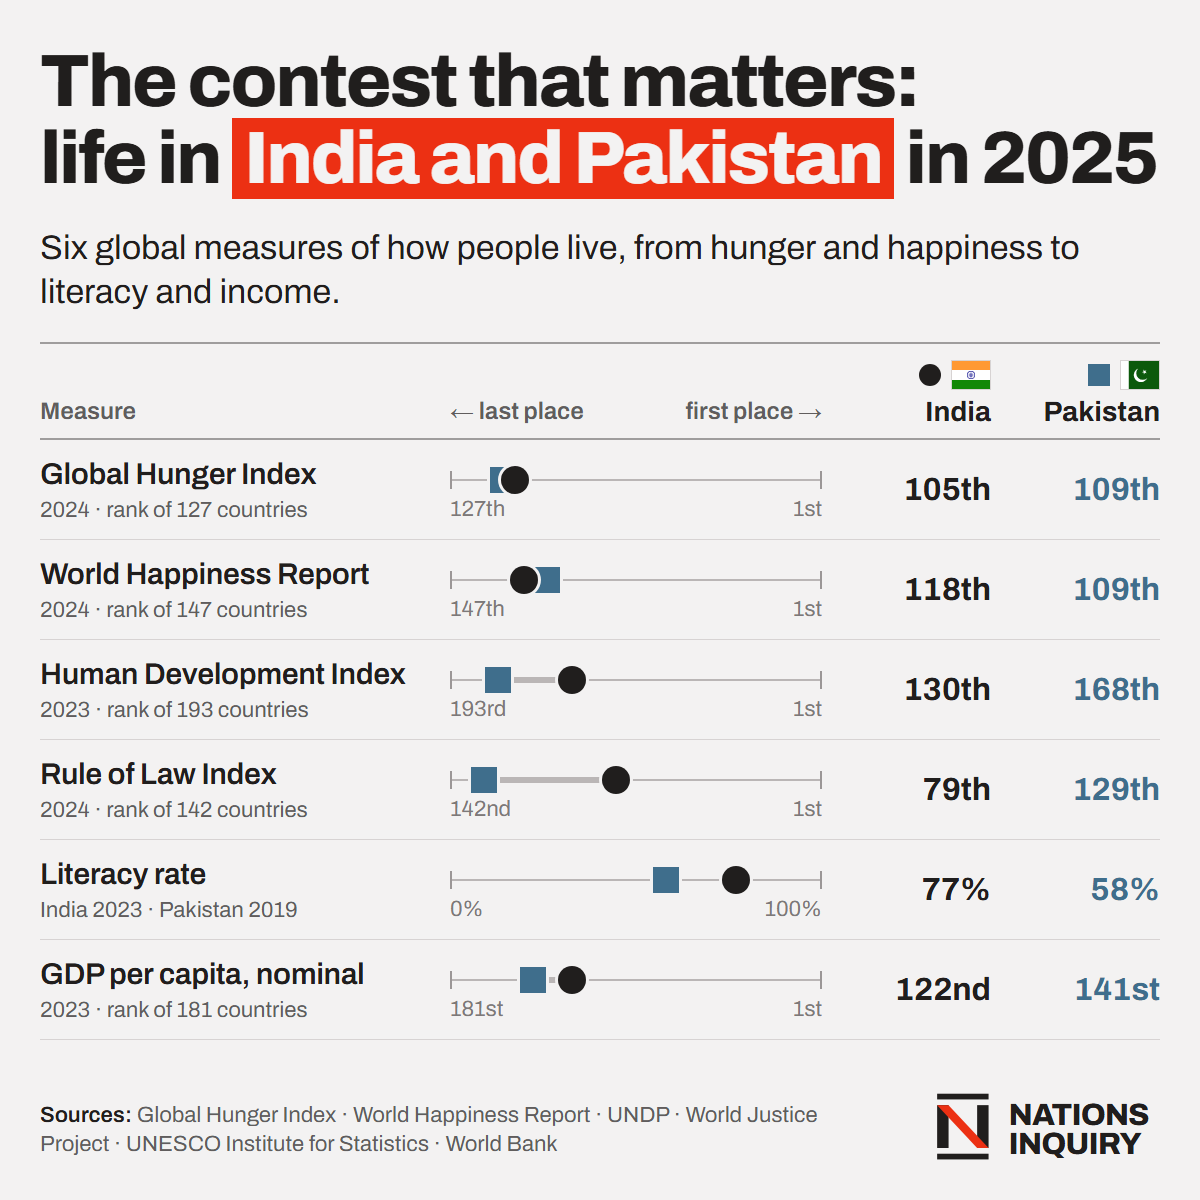
Six rows, one per published measure. Each row draws a line from last place on the left to first place on the right, with India marked as a black circle and Pakistan as a blue square, and prints both values beside it. Five are ranks, where a lower number is the better place: the Global Hunger Index (India 105th of 127, Pakistan 109th), the World Happiness Report (118th of 147 against 109th), the Human Development Index (130th of 193 against 168th), the Rule of Law Index (79th of 142 against 129th) and GDP per capita (122nd of 181 against 141st). The sixth is a literacy rate: 77% for India in 2023 and 58% for Pakistan in 2019, readings four years apart.
01The figures
India and Pakistan compared, 2025
Every row the chart prints, as text rather than pixels — 6 of them, exactly as Six publishers, named on the chart published them. Country names link to their profiles.


- Global Hunger Index (2024)105of 127109of 127
- World Happiness Report (2024)118of 147109of 147
- Human Development Index (2023)130of 193168of 193
- Rule of Law Index (2024)79of 142129of 142
- Literacy rate77%58%
India 2023 and Pakistan 2019 data
- GDP per capita, nominal (2023)122of 181141of 181
Five of these six rows are RANKS, where a lower number is the better place; the literacy row is a percentage, where a higher number is better. The two are not on the same scale and are not added together.
02Analysis
What the chart says
India vs Pakistan in 2025: Six Measures, Two Kinds of Number
This chart was read on 7 May 2025 and sets India and Pakistan side by side on six published measures. Five are ranks, each out of a different field, from 127 countries to 193. The sixth is a literacy rate in per cent. They cannot be added together.
Since Partition in 1947 both countries have faced many of the same problems: feeding everyone, keeping every child in school and raising low incomes. Every statistic held here for both, with each reading’s year, is on the India and Pakistan comparison page.
The Same Hunger Category, Different Life Ratings
The Global Hunger Index 2024 placed India 105th and Pakistan 109th of 127. Both scores fall in the index’s “serious” range, 20.0 to 34.9. The index is built from four readings: undernourishment and child mortality count for a third each, child stunting and child wasting for a sixth each. FAO’s undernourishment figures for 2023 are 12% in India and 16.5% in Pakistan.
The happiness row, labelled 2024 on the poster, comes from the World Happiness Report 2025. It averages how Gallup’s respondents rated their own lives from 0 to 10 over 2022 to 2024, and puts Pakistan 109th and India 118th of 147. It records how people judge their lives, so it need not follow the other rows.
Close in 1990, Further Apart by 2023
UNDP’s Human Development Index for 2023 gives India 0.685, ranked 130th, and Pakistan 0.544, ranked 168th of 193. Life expectancy at birth is 72.0 years in India and 67.6 in Pakistan. A child starting school can expect 13.0 years of it in India and 7.9 in Pakistan, and adults have had 6.9 and 4.3 years of school.
The same series begins in 1990, when the two were much closer: 0.446 for India and 0.396 for Pakistan. That year Pakistan had the longer life expectancy, 59.7 years against 58.6, and the higher income per person, $3,138 against $2,167 in 2021 PPP dollars. Today’s gap opened in the decades since.
Literacy Readings From Different Years
The poster’s literacy row puts India’s 77% for 2023 beside Pakistan’s 58% for 2019. UNESCO’s adult literacy figures are newer but still three years apart, 78.2% for India in 2024 and 58.9% for Pakistan in 2021, so they are printed here, not compared. Within each country the gap between the sexes is wide: in India 70.7% of women and 85.7% of men can read and write, in Pakistan 48.5% of women and 69.1% of men.
Income and the Rule of Law
The GDP row ranks nominal GDP per person in 2023, at market exchange rates: India 122nd and Pakistan 141st of 181. The site holds GDP per capita at purchasing power parity, which allows for local prices. The World Bank’s 2025 figures, in constant 2021 international dollars, are $10,039 for India and $5,617 for Pakistan.
The rule of law row is the WJP Rule of Law Index 2024, built from surveys of households and legal experts. India is 79th and Pakistan 129th of 142.
What Military Weight Is Set Against
A common argument in South Asia is that defence budgets compete with schools and hospitals. BICC’s Global Militarisation Index measures one side of that: military spending against GDP and health spending, and troops against doctors and the whole population. In its 2023 edition Pakistan ranks 45th and India 78th of 149, where first is the most militarised. BICC presents the score as a measure of weight, not a verdict on whether the spending is needed.
03Sources
Where these figures come from
Source
Six published measures, each from its own publisher — Six publishers, named on the chart
Index producer
The figures are from the edition named beside each measure, read on . This page reproduces only the 6 rows the chart itself shows, not the publisher’s full table.
How this site reads a chart — what is stored as published, whose rank is whose, when a country is named at an end, and why a chart is never refreshed.
Cite this page
“India vs Pakistan 2025: Comparison of Hunger Index, Happiness, HDI, Rule of Law, Literacy & GDP”, Nations Inquiry, 2025. https://nationsinquiry.com/charts/india-vs-pakistan-2025-index-hunger-happiness-hdi-law-literacy-gdp
Published · article last edited · Found an error?
04More charts