UNICEF · Children's Climate Risk Index
Children's climate risk by country
How exposed are a country's children to climate and environmental shocks, and how vulnerable are they?
Of the 163 countries compared in 2020, Iceland had the lowest reading, 1.0, and Central African Republic had the highest reading, 8.7. In the middle country the figure was 5.0.
Share
Children's climate risk · 2020
Context statistic

Lowest of 163Iceland
1.0012020 · UNICEF’s rank
Who leads
The three countries at the lowest end of 163 compared, the three at the other end, and the first on each continent.
 1
1Photo: Hansueli Krapf · CC BY-SA 3.0, greyscale
 2
2Photo: Michal Osmenda from Brussels, Belgium · CC BY-SA 2.0, greyscale
 3
3Photo: Karora derivative work: Inkey · Public domain, greyscale
Highest in 2020
 Central African Republic8.7
 Chad8.5
 Nigeria8.5
Where a country sits says how it compares with the others measured, and nothing about why.
Lowest on each continent
- Africa
 Tunisia3.6
 - Americas
 Costa Rica2.9
 - Asia
 Brunei2.4
 - EuropeIceland1.0
- Oceania
 New Zealand1.6
4 of 21 measured
- Every region
02Every measured country
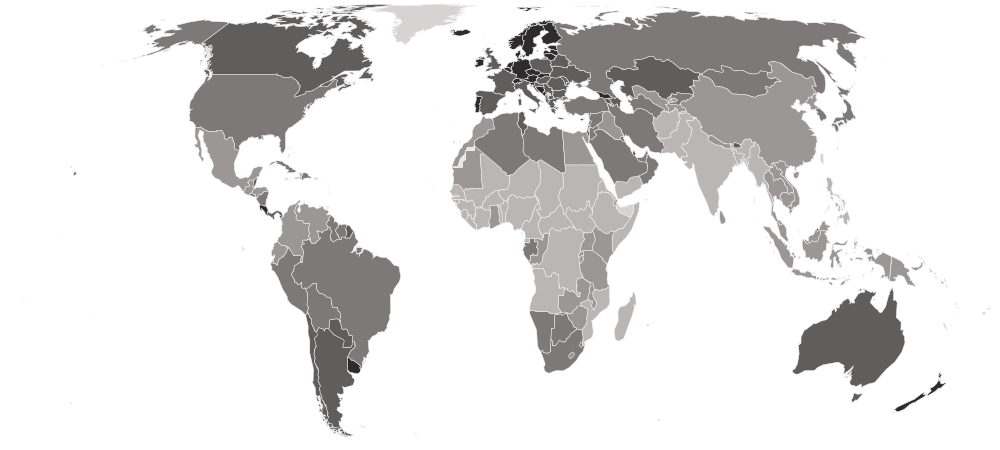
Children's climate risk on a map
Each country is shaded by its value, in five groups holding the same number of countries. Hover a country for its value, or select it to open its profile. Below the map, each continent’s middle country.
Darker is a lower value — the better end.
- 7.1–8.7
- 5.4–7.0
- 4.2–5.3
- 3.2–4.1
- 1.0–3.1
- No reading in 2020
- Europe
2.8
the middle country, of 40 measured · 49 members
Iceland1.0 Albania4.8
Lowest and highest reading in Europe.
- Asia
4.8
the middle country, of 45 measured · 52 members
Brunei2.4 Pakistan7.7
Lowest and highest reading in Asia.
- Americas
5.0
the middle country, of 25 measured · 48 members
Costa Rica2.9 Haiti7.3
Lowest and highest reading in Americas.
- Africa
7.1
the middle country, of 49 measured · 55 members
Tunisia3.6Central African Republic8.7Lowest and highest reading in Africa.
- Oceania
4 of 21 measured — too few for a middle: Australia, New Zealand, Papua New Guinea, Solomon Islands.
New Zealand1.6 Papua New Guinea7.0
Lowest and highest reading in Oceania.
- Every region
20 sub-regions, lowest middle country first
- Northern Europe
2.1
the middle country, of 10 measured · 13 members
Iceland1.0 United Kingdom3.8
Lowest and highest reading in Northern Europe.
- Western Europe
2.5
the middle country, of 8 measured · 9 members
 Luxembourg1.5
 France4.1
Lowest and highest reading in Western Europe.
- Southern Europe
3.3
the middle country, of 12 measured · 17 members
 Malta2.1Albania4.8
Lowest and highest reading in Southern Europe.
- Eastern Europe
3.6
the middle country, of 10 measured · 10 members
 Czechia2.4
 Russia4.6
Lowest and highest reading in Eastern Europe.
- Western Asia
3.8
the middle country, of 18 measured · 19 members
 Cyprus2.5
 Yemen7.4
Lowest and highest reading in Western Asia.
- Central Asia
4.6
the middle country, of 5 measured · 5 members
 Kazakhstan4.1
2 share 5.4
Lowest and highest reading in Central Asia.
- Central America
4.9
the middle country, of 8 measured · 8 members
Costa Rica2.92 share 5.9
Lowest and highest reading in Central America.
- Northern Africa
5.0
the middle country, of 6 measured · 6 members
Tunisia3.6 Sudan7.6
Lowest and highest reading in Northern Africa.
- South America
5.0
the middle country, of 12 measured · 12 members
 Uruguay3.0
 Venezuela5.5
Lowest and highest reading in South America.
- Eastern Asia
5.2
the middle country, of 5 measured · 8 members
 Mongolia4.2
 North Korea6.9
Lowest and highest reading in Eastern Asia.
- Southern Africa
5.2
the middle country, of 5 measured · 5 members
 Botswana4.8
 Lesotho5.4
Lowest and highest reading in Southern Africa.
- South-eastern Asia
6.5
the middle country, of 9 measured · 11 members
Brunei2.42 share 7.1
Lowest and highest reading in South-eastern Asia.
- Eastern Africa
6.7
the middle country, of 15 measured · 19 members
 Rwanda5.7
 Somalia8.4
Lowest and highest reading in Eastern Africa.
- Southern Asia
6.8
the middle country, of 8 measured · 9 members
 Bhutan3.8Pakistan7.7
Lowest and highest reading in Southern Asia.
- Western Africa
7.5
the middle country, of 15 measured · 16 members
 Mauritania6.7Nigeria8.5
Lowest and highest reading in Western Africa.
- Middle Africa
7.9
the middle country, of 8 measured · 9 members
 Gabon5.1Central African Republic8.7
Lowest and highest reading in Middle Africa.
- Australia and New Zealand
2 of 2 measured — too few for a middle: Australia, New Zealand.
New Zealand1.6 Australia3.6
Lowest and highest reading in Australia and New Zealand.
- Caribbean
3 of 24 measured — too few for a middle: Cuba, Dominican Republic, Haiti.
 Cuba4.7Haiti7.3
Lowest and highest reading in Caribbean.
- Melanesia
2 of 5 measured — too few for a middle: Papua New Guinea, Solomon Islands.
 Solomon Islands5.2Papua New Guinea7.0
Lowest and highest reading in Melanesia.
- Northern America
2 of 4 measured — too few for a middle: Canada, United States.
 Canada3.7
 United States5.0
Lowest and highest reading in Northern America.
03The whole field at once
The spread
163 countries, one dot each, on one scale — further right is a higher value. Half the countries are above 5.0; a quarter are above 6.7, and a quarter below 3.6. The bar in each row marks that continent’s middle country.
04All 163 ever measured
Every country
In order, highest value first — rank 1 is the highest value, the way UNICEF’s own tables read. “=” marks a rank shared with another country. The rank is UNICEF's own. Scores are published to one decimal, so many countries share a score and a rank. Because half of the index is children's vulnerability, poorer countries rank high even where their climate hazards are moderate; the two pillars beside the score show which half drives a country's place.
Showing 25 of 163 countries




























































































































Values for 2020.
05In this edition
Children's climate risk in records
The extremes of the statistic. A record reached by more than one country names none of them.
Highest reading
8.7
Children's Climate Risk Index (0–10, higher is more risk)
Lowest reading
1.0
Children's Climate Risk Index (0–10, higher is more risk)
06The parts of the index
Inside the number
UNICEF publishes the parts the headline is built from. Each part’s highest and lowest country, and its middle value.
| Part | Highest | Lowest | Middle country |
|---|---|---|---|
| Pillar 1: exposure to climate and environmental shocks (0–10)163 countries |  Bangladesh9.1 Bangladesh9.1 | Iceland1.0 | 5.8 |
| Pillar 2: child vulnerability (0–10)163 countries | Central African Republic9.8 | 2 countries share 0.7 | 3.1 |
07The measure
About children's climate risk
UNICEF's Children's Climate Risk Index scores, from 0 to 10, how exposed a country's children are to climate and environmental shocks — floods, cyclones, heatwaves, water scarcity, disease and pollution — and how vulnerable they are when one strikes, through their health, schooling, water and sanitation and poverty. A higher score means more risk.
What the number is: Children's Climate Risk Index (0–10, higher is more risk).
08Where it fits
Connections
Its part in the Country Index, the statistics whose values line up most closely with it across countries, and others on the same subject.
In the Country Index
Context, with no vote
This statistic is published in full under Environment & Sustainability and Risk & Resilience, but does not help decide any Country Index standing.
Environment & SustainabilityRisk & ResilienceWhich statistics vote, and why
Moves with
Where children's climate risk is higher, these tend to be higher too.
- Coefficient of Human InequalityUNDP Human Development Report Office · 146 countries in commonρ 0.87
- Informal Employment RateILO · 80 countries in commonρ 0.87
- Under-Five Mortality RateKeyUN IGME · 162 countries in commonρ 0.86
Moves against
Where children's climate risk is higher, these tend to be lower.
- Inequality-adjusted Human Development IndexUNDP Human Development Report Office · 146 countries in commonρ −0.89
- Human Development IndexKeyUNDP Human Development Report Office · 162 countries in commonρ −0.87
- Completeness of Birth RegistrationUNICEF · 145 countries in commonρ −0.86
Rank correlation (ρ, from −1 to 1) across countries, on each statistic’s newest edition, out of 371 statistics sharing at least 80 countries with this one. Two statistics that move together do not cause each other.
09Keep reading
Explore further
The data, edition by edition
The countries at either end
More from UNICEF
10Questions
Children's climate risk: questions and answers
Which country has the lowest children's climate risk?
Iceland, at 1.0, among the 163 countries compared in 2020.
Which country has the highest children's climate risk?
Central African Republic, at 8.7, among the 163 countries compared in 2020.
How many countries does the Children's Climate Risk Index cover?
163 in 2020.
What is the world average children's climate risk?
This site does not calculate a world average, which would depend on how countries are weighted. In the middle country of the 163 compared in 2020, the figure was 5.0.
Is this UNICEF’s own ranking?
Yes. The rank shown is the one UNICEF publishes.
How often is the Children's Climate Risk Index published?
This site holds one edition, describing 2020.
Where does the data come from, and can I download it?
From UNICEF, under CC BY 3.0 IGO. From UNICEF's data warehouse, where the score is stored in a note beside a category word, and checked against the ranking table in UNICEF's report. UNICEF calls this the first, beta version of the index; small island states are not covered. Every edition is on this site’s Datasets pages as a full table, and downloads as a CSV file with every value unrounded.
11Method
Sources, method and citation
Source
Children's Climate Risk Index — UNICEF
From UNICEF's data warehouse, where the score is stored in a note beside a category word, and checked against the ranking table in UNICEF's report. UNICEF calls this the first, beta version of the index; small island states are not covered.
Newest edition
Report year 2021Data year 2020
Cite the source as: UNICEF. The Climate Crisis is a Child Rights Crisis: Introducing the Children's Climate Risk Index. New York: United Nations Children's Fund (UNICEF), 2021.
Licence: CC BY 3.0 IGO, checked 2026-10-03.
How this page reads the numbers
- The rank is UNICEF’s own, as published.
- Which end is better follows the publisher’s own reading of the measure.
- A country is named at an end only when it holds that value alone. Where several share it, the page says how many and names none first.
- Values are stored exactly as published and trimmed only for display. “The middle country” is the median of the countries measured, not a world average.
The file itself, column by column — where it came from, what each column holds, and every edition as a CSV — is on its dataset page.
Photographs
The countries at the top of this statistic, from their profiles: Wikimedia Commons, shown in greyscale, each used under the licence named.
- Iceland — Hansueli Krapf, CC BY-SA 3.0
- Luxembourg — Michal Osmenda from Brussels, Belgium, CC BY-SA 2.0
- New Zealand — Karora derivative work: Inkey, Public domain
Cite this page
Nations Inquiry (2026). Children's climate risk by country: Children's Climate Risk Index, data from UNICEF. https://nationsinquiry.com/statistics/childrens-climate-risk