UNICEF · Caesarean Section Rate
Caesarean section rate by country
What share of babies are delivered by caesarean section?
Of the 116 countries compared in the 2025 edition, Egypt had the highest reading, 72.2%, and Chad had the lowest reading, 1.1%. In the middle country the figure was 18.9%. 50 readings from before 2015 are listed but not compared.
Share
Caesarean section rate · the 2025 edition
Context statistic

Highest of 116Egypt
72.2%01the 2025 edition · values only
The highest and the lowest
The three countries with the highest values of 116 compared, the three with the lowest, and the highest on each continent. This statistic has no better end, so no country is shown as leading.
- 1
- 2

- 3

Highest on each continent
- AfricaEgypt72.2%
- AmericasDominican Republic62.9%
- Asia
 Bangladesh52.0%
 - Europe
 Bulgaria46.9%
 - Oceania
 Tuvalu20.2%
 - Every region
02Every measured country
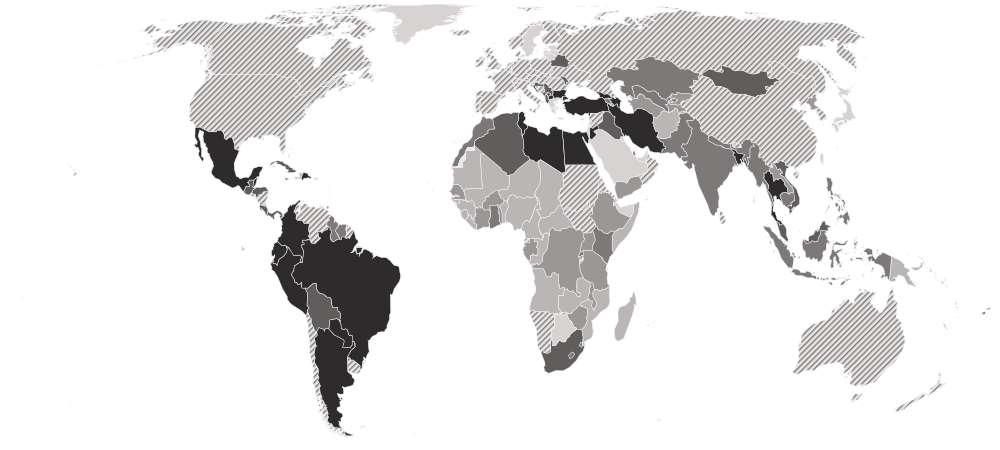
Caesarean section rate on a map
Each country is shaded by its value, in five groups holding the same number of countries. Hover a country for its value, or select it to open its profile. Below the map, each continent’s middle country.
Darker is a higher value. This statistic has no better end, so the shades describe size, not success.
- 1.1–5.9%
- 6.1–13.9%
- 14.9–23.9%
- 24.4–34.4%
- 35.4–72.2%
- Hatched: a reading from before 2015, listed but not compared (50)
- No reading in the 2025 edition
- Americas
33.4%
the middle country, of 21 measured · 48 members
Dominican Republic62.9% Haiti5.4%
Highest and lowest reading in Americas.
- Europe
31.2%
the middle country, of 10 measured · 49 members
Bulgaria46.9%2 share 24.4%
Highest and lowest reading in Europe.
- Asia
21.2%
the middle country, of 32 measured · 52 members
Bangladesh52.0% Timor-Leste3.5%
Highest and lowest reading in Asia.
- Oceania
9.3%
the middle country, of 9 measured · 21 members
Tuvalu20.2% Papua New Guinea3.0%
Highest and lowest reading in Oceania.
- Africa
7.8%
the middle country, of 44 measured · 55 members
Egypt72.2% Chad1.1%
Highest and lowest reading in Africa.
- Every region
18 sub-regions, highest middle country first
- Northern Africa
42.1%
the middle country, of 5 measured · 6 members
Egypt72.2% Morocco21.2%
Highest and lowest reading in Northern Africa.
- South America
38.2%
the middle country, of 9 measured · 12 members
Brazil56.4% Suriname16.1%
Highest and lowest reading in South America.
- Western Asia
33.2%
the middle country, of 9 measured · 19 members
 Türkiye51.5%
 Yemen10.8%
Highest and lowest reading in Western Asia.
- Southern Europe
31.2%
the middle country, of 7 measured · 17 members
 North Macedonia38.3%
2 share 24.4%
Highest and lowest reading in Southern Europe.
- Caribbean
30.4%
the middle country, of 6 measured · 24 members
Dominican Republic62.9%Haiti5.4%Highest and lowest reading in Caribbean.
- Central America
29.9%
the middle country, of 6 measured · 8 members
 Mexico40.7%
 Honduras24.8%
Highest and lowest reading in Central America.
- Southern Asia
23.1%
the middle country, of 7 measured · 9 members
Bangladesh52.0% Afghanistan5.7%
Highest and lowest reading in Southern Asia.
- South-eastern Asia
17.9%
the middle country, of 9 measured · 11 members
 Thailand40.9%Timor-Leste3.5%
Highest and lowest reading in South-eastern Asia.
- Central Asia
11.3%
the middle country, of 5 measured · 5 members
 Uzbekistan20.9%
 Turkmenistan6.2%
Highest and lowest reading in Central Asia.
- Eastern Africa
8.3%
the middle country, of 12 measured · 19 members
 Comoros18.1%
 Somalia1.7%
Highest and lowest reading in Eastern Africa.
- Western Africa
5.5%
the middle country, of 16 measured · 16 members
 Cabo Verde23.9%
 Niger1.3%
Highest and lowest reading in Western Africa.
- Middle Africa
4.3%
the middle country, of 8 measured · 9 members
 São Tomé and Príncipe10.2%Chad1.1%
Highest and lowest reading in Middle Africa.
- Eastern Asia
2 of 8 measured — too few for a middle: Mongolia, North Korea.
 Mongolia28.1%
 North Korea12.9%
Highest and lowest reading in Eastern Asia.
- Eastern Europe
3 of 10 measured — too few for a middle: Belarus, Bulgaria, Moldova.
Bulgaria46.9% Moldova31.0%
Highest and lowest reading in Eastern Europe.
- Melanesia
4 of 5 measured — too few for a middle: Fiji, Papua New Guinea, Solomon Islands, Vanuatu.
 Fiji19.7%Papua New Guinea3.0%
Highest and lowest reading in Melanesia.
- Micronesia
2 of 7 measured — too few for a middle: Kiribati, Nauru.
 Nauru12.5%
 Kiribati9.3%
Highest and lowest reading in Micronesia.
- Polynesia
3 of 7 measured — too few for a middle: Samoa, Tonga, Tuvalu.
Tuvalu20.2% Samoa8.4%
Highest and lowest reading in Polynesia.
- Southern Africa
3 of 5 measured — too few for a middle: Eswatini, Lesotho, South Africa.
 South Africa26.2%
 Eswatini16.5%
Highest and lowest reading in Southern Africa.
03The whole field at once
The spread
116 countries, one dot each, on one scale — further right is a higher value. Half the countries are above 18.9%; a quarter are above 31.5%, and a quarter below 7.6%. The bar in each row marks that continent’s middle country.
04All 166 ever measured
Every country
In order, highest value first. No rank or position is shown: too many countries share the same value for an order to mean anything. Neither end of this table is the good one, so no position is derived. Many high-income countries' newest reading is from around 2007, so they are listed but left out of the comparisons.
Showing 25 of 166 countries



































































































































Values for the 2025 edition.
05In this edition
Caesarean section rate in records
The extremes of the statistic. A record reached by more than one country names none of them.
Highest reading
72.2%
Live births delivered by caesarean section (%)
Lowest reading
1.1%
Live births delivered by caesarean section (%)
06The measure
About caesarean section rate
This is the share of births delivered by caesarean section. It is a measure of access to surgery at birth, but one with no better end: too few caesareans means women who need one go without, and far too many means operations performed without medical need.
What the number is: Live births delivered by caesarean section (%).
07Where it fits
Connections
Its part in the Country Index, the statistics whose values line up most closely with it across countries, and others on the same subject.
In the Country Index
Context, with no vote
This statistic is published in full under Health & Wellbeing and Gender & Equality, but does not help decide any Country Index standing.
Health & WellbeingGender & EqualityWhich statistics vote, and why
Moves with
Where caesarean section rate is higher, these tend to be higher too.
- Actual Individual Consumption per Capita (PPP)World Bank Group · 96 countries in commonρ 0.79
- Human Development IndexKeyUNDP Human Development Report Office · 113 countries in commonρ 0.79
- Life Expectancy at BirthKeyUN DESA Population Division · 116 countries in commonρ 0.78
Moves against
Where caesarean section rate is higher, these tend to be lower.
- Crude Birth RateUN DESA Population Division · 116 countries in commonρ −0.79
- Total Fertility RateUN DESA Population Division · 116 countries in commonρ −0.78
- Population Under Age 15UN DESA Population Division · 116 countries in commonρ −0.78
Rank correlation (ρ, from −1 to 1) across countries, on each statistic’s newest edition, out of 308 statistics sharing at least 80 countries with this one. Two statistics that move together do not cause each other.
08Keep reading
Explore further
The subject
The data, edition by edition
More from UNICEF
09Questions
Caesarean section rate: questions and answers
Which country has the highest caesarean section rate?
Egypt, at 72.2%, among the 116 countries compared in the 2025 edition.
Which country has the lowest caesarean section rate?
Chad, at 1.1%, among the 116 countries compared in the 2025 edition.
How many countries does the Caesarean Section Rate cover?
116 in the 2025 edition, and 166 at least once across all editions.
What is the world average caesarean section rate?
This site does not calculate a world average, which would depend on how countries are weighted. In the middle country of the 116 compared in the 2025 edition, the figure was 18.9%.
Is this UNICEF’s own ranking?
No ranking is shown. UNICEF publishes values only, and too many countries share the same value for an ordering to mean anything, so none is derived.
How often is the Caesarean Section Rate published?
This site holds one edition, describing 2025.
Where does the data come from, and can I download it?
From UNICEF, under CC BY 3.0 IGO. From UNICEF's Maternal and Newborn Health Coverage Database, read from UNICEF's own data warehouse. Where a country has several sources, UNICEF's own priority flag decides which is used. Every edition is on this site’s Datasets pages as a full table, and downloads as a CSV file with every value unrounded.
10Method
Sources, method and citation
Source
Caesarean Section Rate — UNICEF
From UNICEF's Maternal and Newborn Health Coverage Database, read from UNICEF's own data warehouse. Where a country has several sources, UNICEF's own priority flag decides which is used.
Newest edition
Report year 2025Data year not recorded
Cite the source as: UNICEF. Maternal and Newborn Health Coverage Database. New York: UNICEF.
Licence: CC BY 3.0 IGO, checked 2026-10-03.
How this page reads the numbers
- No rank or position is shown: UNICEF publishes values only, and too many countries share the same value for an ordering to mean anything.
- This statistic has no better end, so the page describes higher and lower values and never calls a country a leader.
- A country is named at an end only when it holds that value alone. Where several share it, the page says how many and names none first.
- The file gives each country’s most recent reading, so the rows are from different years. Readings from before 2015 are listed but left out of every comparison on this page.
- Values are stored exactly as published and trimmed only for display. “The middle country” is the median of the countries measured, not a world average.
The file itself, column by column — where it came from, what each column holds, and every edition as a CSV — is on its dataset page.
Cite this page
Nations Inquiry (2026). Caesarean section rate by country: Caesarean Section Rate, data from UNICEF. https://nationsinquiry.com/statistics/caesarean-section